Media-driven polarization. Evidence from the US
←
→
Page content transcription
If your browser does not render page correctly, please read the page content below
Vol. 13, 2019-34 | June 24, 2019 | http://dx.doi.org/10.5018/economics-ejournal.ja.2019-34

Media-driven polarization. Evidence from the US
Mickael Melki and Petros G. Sekeris

Abstract
The authors use US data on media coverage of politics and individual survey data to
document that citizens exposed to more politicized newspapers have more extreme political
preferences. This polarization effect of media is mainly driven by individuals who harbor
liberal opinions reading more newspapers, as opposed to individuals endorsing rather
conservative positions. More politicized media also reinforce other aspects of citizens’
political sophistication such as political knowledge. This enhanced political sophistication
materializes in observable involvement in politics, measured by campaign contributions.
JEL K4 H0
Keywords Media; ideological polarization; political sophistication
Authors
Mickael Melki, Paris School of Business, France, m.melki@psbedu.paris
Petros G. Sekeris, Montpellier Business School, France

Citation Mickael Melki and Petros G. Sekeris (2019). Media-driven polarization.
Evidence from the US. Economics: The Open-Access, Open-Assessment E-Journal, 13
(2019-34): 1–13. http://dx.doi.org/10.5018/economics-ejournal.ja.2019-34

Received March 11, 2019 Published as Economics Discussion Paper April 5, 2019
Revised June 4, 2019 Accepted June 13, 2019 Published June 24, 2019
© Author(s) 2019. Licensed under the Creative Commons License - Attribution 4.0 International (CC BY 4.0)
Economics: The Open-Access, Open-Assessment E-Journal 13 (2019–34)

1   Introduction

Most democracies have never been as politically polarized as they are today.1 Holding polar
political opinions bears important socio-economic consequences, however, since in such contexts
political decisions are likely to deeply divide the population and to bring along important economic
costs. One emblematic such consequence has been the recent 35 days government shutdown in
the U.S. (December 22, 2018 to January 25, 2019), the longest in the country’s history, whose
root cause lied in a disagreement over the funding of the U.S-Mexico border wall. Delving into
the determinants of political polarization, scholars have pointed at socio-economic factors (e.g.
Grechyna 2016). To complement these findings, a growing literature in political economy has
focused on the specific role of media, but the results are mixed. Campante and Hojman (2013)
and Melki and Pickering (2014), for example, provide evidence showing that, historically, the
increasing media penetration over time reduced polarization in US counties and OECD countries,
respectively. However, according to Prior (2013), the emergence of more partisan media may
have contributed to political polarization leading Americans to support more partisan policies or
candidates.
     Part of the lack of convergence in the findings can be attributed to the differential effects
of different media sources on political attitudes and polarization: the media differ along several
dimensions, including their informational content, the intensity of exposition, as well as the type
of public that consumes them. The Nixon-Kennedy 1960 presidential debate constitutes a famous
example of the strikingly different impact on voters’ perception of TV and radio, respectively,
with polls revealing Kennedy to have convinced relatively more TV viewers as compared to radio
listeners (e.g. Druckman 2003). With the evolution of media technology, the attention of the
scholarship therefore turned to these new sources of information. The introduction of the TV
modified the playground in politics by attracting away some attention from the more informative
traditional means of information, i.e. newspapers and radio, by producing a sharp decline in turnout
in the 1950s (Gentzkow 2006), and also by contributing to the recent rise in political polarization
in the U.S. (Martin and Yurukoglu 2017). With the quick rise of internet penetration and the
development of social media, researchers explored whether trends in political polarization could be
attributed to this new type of media. State of the art research, however, fails to establish a definite
effect of internet and social media on political polarization (e.g. Halberstam and Knight 2016,
Boxell et al. 2017, Lelkes et al. 2017).
     It has been recognized that newspapers occupy a central role in informing citizens, and yet their
impact on political polarization remains unexplored. Kennedy and Prat (2017) show in a study on
36 countries that 40% of the surveyed subjects get informed by reading newspapers. Combining
this finding with the strong political content of newspapers (Campante and Do 2014), one realizes
the importance of exploring the potential causal effect of newspapers on political polarization.
     In this paper we analyze the role of newspapers on citizens’ political positions, and thereby on
the ensuing political polarization, while accounting for the political content of news. Moreover, we
study the mechanisms through which media-driven polarization takes place as well as potential
1  See for instance the Sustainable Governance Indicators report for 41 countries of the OECD and European Union
(Stiftung 2018).

www.economics-ejournal.org                                                                                    2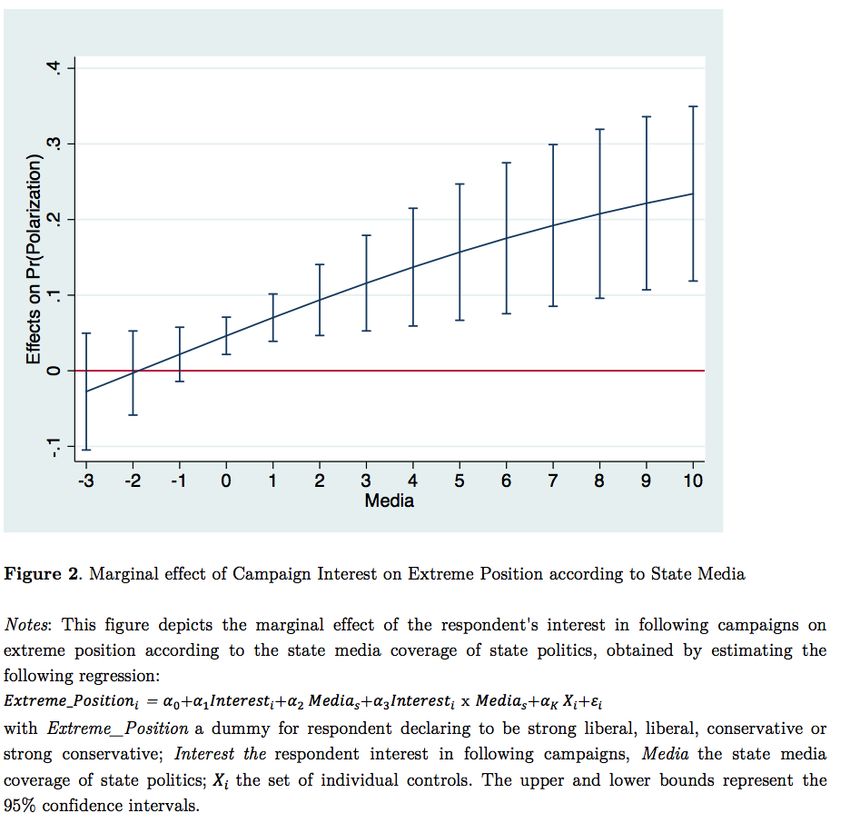
Economics: The Open-Access, Open-Assessment E-Journal 13 (2019–34)

implications. Our measure of media exposition is provided by Campante and Do (2014) who
propose a measure of state media coverage of politics based on nearly four thousand newspapers
all over the United States. We explore the effect of newspaper coverage combined with individual
survey data from the 2008 wave of the American National Election Studies (ANES) on whether
surveyed individuals have an interest in politics and read news. Our results support that in the
states with greater media coverage of politics, an increase in the citizens’ exposure to newspapers
is associated with more extreme political views. In support of a causal effect running from the
media to political opinions, we propose a placebo test by replicating the estimation with political
opinions’ data from 2000, but by using the 2008 measure of state media coverage as an explanatory
variable. Reassuringly, the placebo estimation yields statistically non-significant estimates.
     Interestingly, we uncover an asymmetric effect of media coverage on political opinions since
our results indicate that media coverage induces more extreme political views only on individuals
harboring liberal opinions. By further exploring the potential channel explaining this asymmetry,
we uncover that the effect of newspaper exposition is conditional on individuals reading news-
papers, with conservatives relying less on newspapers as a source of information. Our central
result therefore suggests that politicized information polarizes political opinions. This could be
interpreted as a confirmation of previous findings that news spread quickly in networks of the
same political side (Halberstam and Knight 2016), eventually producing more polarized political
attitudes.
     Consistently, we also find that more politicized media improve individuals’ political sophistica-
tion as measured as political knowledge regarding the U.S. political life.2 Lastly, we demonstrate
that an additional positive implication of a high media coverage of politics is a stronger involvement
of citizens in politics, as measured as campaign contributions.

2    Data and Empirical Strategy

Our measure of media coverage of politics comes from Campante and Do (2004). They looked
at newspapers whose print edition content is available online and searchable on the website
NewsLibrary.com covering nearly four thousand outlets all over the United States in 2008. They
searched for the names of each state’s then current governors as well as, alternatively, for terms
such as state government, state budget, or state elections, where ’state’ refers to the name of each
state. They computed the state-level measure of political coverage by taking the first principal
component of the four search terms for each newspaper (adjusted by size), and performed a
weighted sum of this measure over all newspapers.3
    They provide this index for 47 states as of 2008.4 The mean value of the variable weighted by
the geographical concentration of the newspapers is −0.21 and its standard deviation is 0.96. As
2 This result complements Snyder and Strömberg (2010) finding that voters living in areas where the press covers their
U.S. House representative more are more likely to recall their representative’s name and more able to rate him or her.
3 They used two alternative sets of weights: the circulation of each newspaper in the state and that circulation weighted

by its geographical concentration. The latter, our preferred measure, put more weight on circulation closer to the capital.
4 Rhode Island is excluded from the sample since, as underlined by Campante and Do, it is a outlier − about 5 standard

deviations greater than the state with the next largest measure. Campante and Do explains that "this is because there is
one newspaper, the Providence Journal, that far outstrips the circulation of all other RI-based newspapers in the sample,

www.economics-ejournal.org                                                                                               3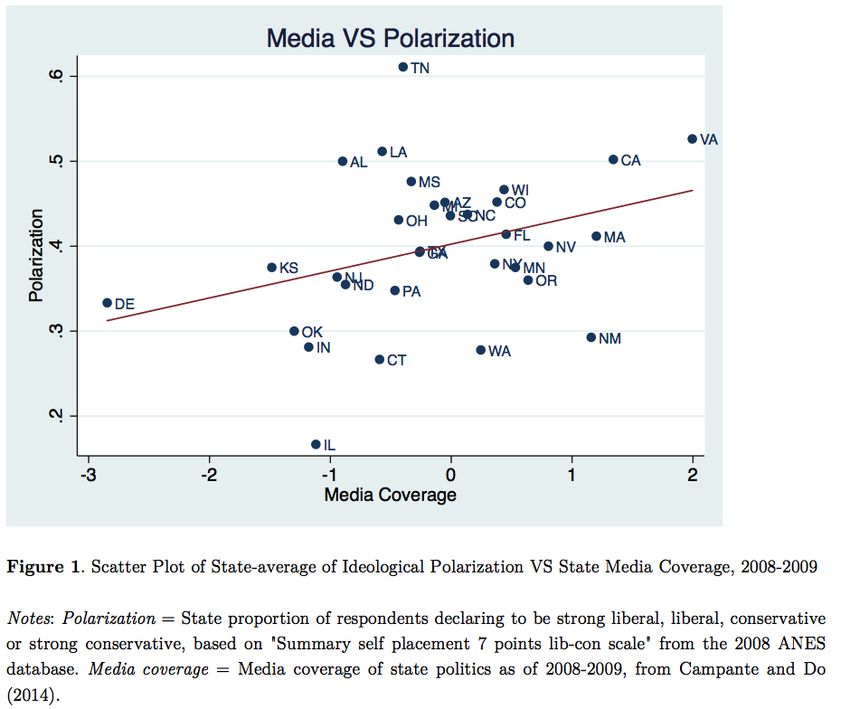
Economics: The Open-Access, Open-Assessment E-Journal 13 (2019–34)

shown in Figure 1, the lowest political coverage is found in Delaware (−2.85) and the highest in
Virginia (1.99).
    Our aim is to analyze the effect of media coverage on citizens’ political preferences, under
the presumption that if citizens from both sides adopt on average more (less) extreme ideological
positions, the ensuing political polarization should increase (decrease). We use the 2008 wave of
the American National Election Studies (ANES), which provides high quality survey data pertinent
to important questions about vote choice, public opinion and related matters in the context of the
2008 United States presidential election opposing the Democratic candidate, Barack Obama, to the
Republican candidate, John McCain. We construct a set of individual variables available for up to
2079 respondents.
    Our measure of political attitudes relies on a self-placement of individuals in the 2008 ANES on
a 7-point liberal-conservative scale ranging from "extremely liberal" to "extremely conservative".
Our main variable of interest, Extreme Position, is a dummy coded 1 for respondents declaring
to be at one of the extremes of the spectrum; i.e. "extremely liberal" (1 point), "liberal" (2
This newspaper had a very large measure of coverage of state politics, and is idiosyncratically driving the state-level
measure".

www.economics-ejournal.org                                                                                           4
Economics: The Open-Access, Open-Assessment E-Journal 13 (2019–34)
points), "conservative" (6 points) or "extremely conservative" (7 points).5 In our sample, 42.2%
of the total respondents can be considered to have extreme ideological positions. Regarding the
variation across states, as shown in Figure 1, the state with the lowest proportion of respondents
endorsing extreme positions is Illinois with less than 20% and the state with the highest proportion
is Tennessee with more than 60%.
As an alternative measure of political attitude, we use a measure of preferences for political
parties. In the 2008 ANES, respondents are asked to rank separately the Democratic and the
Republican parties on a 11-point scale ranging from 0 ("strongly dislike Dem./Rep. party") to
10 ("strongly like Dem./Rep. party").6 In order to capture extreme political preferences, we
then construct the variable Extreme Party Pre f erence which takes the value of 1 for respondents
declaring to strongly like (9 or 10 points) or strongly dislike (0 or 1 point) either party. This
variable is positively but weakly correlated with (.23) Extreme Position suggesting that they
measure different dimensions of respondents’ preferences.
Among the other outcomes of interest, Campaign contribution is a dummy coded 1 if the
respondent states that she "contributed money to specific candidate campaign", referring to the
2008 presidential election.7 Party contribution is a dummy for wether the respondent states that
he/she "gave money to a political party during this (2008) election year." We also use variables
evaluating political knowledge, namely dummies for whether the respondent knows the party with
the most members in the House of Representatives before the election (House), in Senate (Senate)8
and whether he/she knows the name of the Speaker of the House (Speaker).9
Given that respondents are not homogeneously exposed to the press, we construct different
variables of exposure which are equally based on the 2008 ANES. The first one, Campaign Interest
is a measure of the respondent’s interest in politics in general, ranging from 1 to 5 with higher
values capturing higher levels of interest.10 A second, more specific measure of exposure to
newspapers, Read paper, is coded 1 if the respondent reports that he/she has "read about the
(2008) presidential campaign in newspapers". Alternatively, Attention paper reports the level
of attention paid by the respondent to "news about national politics in printed newspapers." We
also construct a variable of exposure to other media with TV news capturing the level of attention
paid to "news about national politics on TV". Finally, our analysis controls for a set of individual
characteristics, which are age, income, education level, gender, household size, residence in urban
area, and time between interview and election, as of 2008.
5 The intermediate values correspond to "slightly liberal" (3 points), "Moderate; middle of the road" (4 points) and
"slightly conservative" (5 points). The exact question is "We hear a lot of talk these days about liberals and conservatives.
Here is a seven-point scale on which the political views that people might hold are arranged from extremely liberal to
extremely conservative. Where would you place YOURSELF on this scale, or haven’t you thought much about this?"
6 The exact question is "I’d like to know what you think about our political parties. After I read the name of a political
party, please rate it on a scale from 0 to 10, where 0 means you strongly dislike that party and 10 means that you strongly
like that party".
7 The exact question is "During an election year people are often asked to make a contribution to support campaigns.
Did you give money to an INDIVIDUAL CANDIDATE running for public office?."
8 The question is "Do you happen to know which party had the most members in the House of Representatives in
Washington/in the U.S. Senate BEFORE the election (this/last) month?"
9 The question is "The first name is NANCY PELOSI. What job or political office does she NOW hold?"
10 The question is "How interested are you in information about what’s going on in government and politics?"
www.economics-ejournal.org 5Economics: The Open-Access, Open-Assessment E-Journal 13 (2019–34)
To analyze the effect of individual characteristics (exposure to media) conditional on a variable
aggregated at a higher level (state media), we follow Facchini and Mayda (2009) and estimate the
following probit model:
Prob(Yi = 1 | Xi ) = Φ(β1 Interesti + β2 Interesti × Medias + βK Zi + ψs ) (1)
where Φ(.) represents the cumulative distribution function of a standard normal, Yi captures the
individual’s ideological (party) position, monetary contribution or political knowledge, Interesti the
individual’s interest in following campaign or media exposure, Medias the state media coverage of
politics in the individual’s state of residence, Xi is a vector of individual controls, ψs state dummies
to control for additive state-specific unobserved effects, and standard errors adjusted for clustering
at the state level.
3 Evidence
Figure 1 depicts the scatter plot of the state-average "polarization", measured as the share of indi-
viduals with extreme ideological positions, versus the state media coverage of politics. Ideological
polarization is higher in states with a higher media coverage of politics, which − if taken at face
value − goes against prior arguments that higher media penetration decreases political polarization
(e.g. Campante and Hojman 2013, Melki and Pickering 2014).
3.1 Ideological Position and Media Coverage
To provide quantitative support of such a possibility, we then turn to the individual data analysis
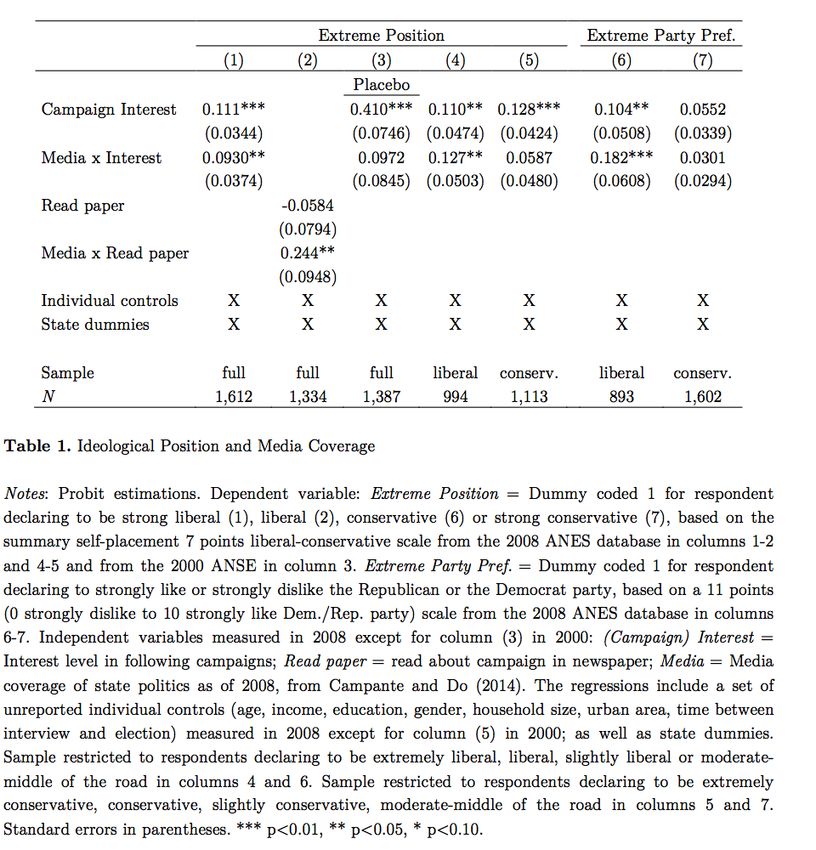
and first estimate equation (1) with Extreme Position as a dependent variable in Table 1. Column
(1) shows that the positive impact of the respondents’ interest in politics on their probability to
adopt extreme (liberal or conservative) positions is magnified in states where the media coverage
of politics is stronger. Figure 2 plots the marginal effect of individuals’ interest level on the
probability of endorsing extreme positions, for given media exposure. The observed effect is
economically significant. Exposure to media in the states with the lowest media political coverage
is not associated with more extreme positions, while media exposure increases the probability of
adopting extreme positions by more than 40% in the states with the largest coverage, such as as
Virginia and California. Column (2) shows that this relationship holds when using a more specific
measure of exposure to newspapers, which is whether the respondent has read about campaign in
newspapers.
www.economics-ejournal.org 6Economics: The Open-Access, Open-Assessment E-Journal 13 (2019–34)
At this stage we cannot exclude a causal effect running from the individuals’ opinion to
the media coverage of politics, or even perhaps the non-inclusion of some omitted variable. To
convince the reader that the link is indeed causal, we propose in column (3) a placebo estimation
by replicating column (1) with all the variables as of 2000 (from the 2000 wave of ANES) instead
of 2008, except for the media variable still measured in 2008. We observe that the interacted
variable is not statistically significant any more, suggesting that the media coverage in 2008 does
not account for the past polarization of 2000.11
11 We replicated this placebo test with the other dependent variables of the analysis, which consistently supports the
absence of statistical association between the media as of 2008 and past political outcomes as of 2000.
www.economics-ejournal.org 7Economics: The Open-Access, Open-Assessment E-Journal 13 (2019–34)
Interestingly, we provide evidence that the polarization effect of media is mostly driven by
liberal respondents. Indeed, column (4) replicates the specification of column (1) by restricting
the sample to respondents positioning themselves as extremely liberal, liberal, slightly liberal
or moderate, while column (5) restricts the sample to those respondents positioning themselves
as extremely conservative, conservative, slightly conservative or moderate. Upon inspection of
Table 1, we observe that the level of "campaign interest" is associated with more extreme positions
in both cases. On the other hand, we observe that the effect of campaign interest conditional
on media coverage is present only for the liberal sample. This finding indirectly suggests that
liberals’ political attitudes are more elastic to the media coverage of politics, contrasting therefore
previous findings on the elasticity of conservatives to slanted TV news (Martin and Yurukoglu
2017). Columns (6) and (7) confirm this asymmetric pattern with our alternative dependent variable
Extreme Party Pre f erence. This last set of estimations brings further support to the finding that
the polarization effect of media is due to liberal individuals adopting more extreme liberal positions
www.economics-ejournal.org 8Economics: The Open-Access, Open-Assessment E-Journal 13 (2019–34)
in the presence of highly politicised media while conservative individuals remain insensitive to the
newspapers’ activity. In the next section we propose a rationale for this finding.
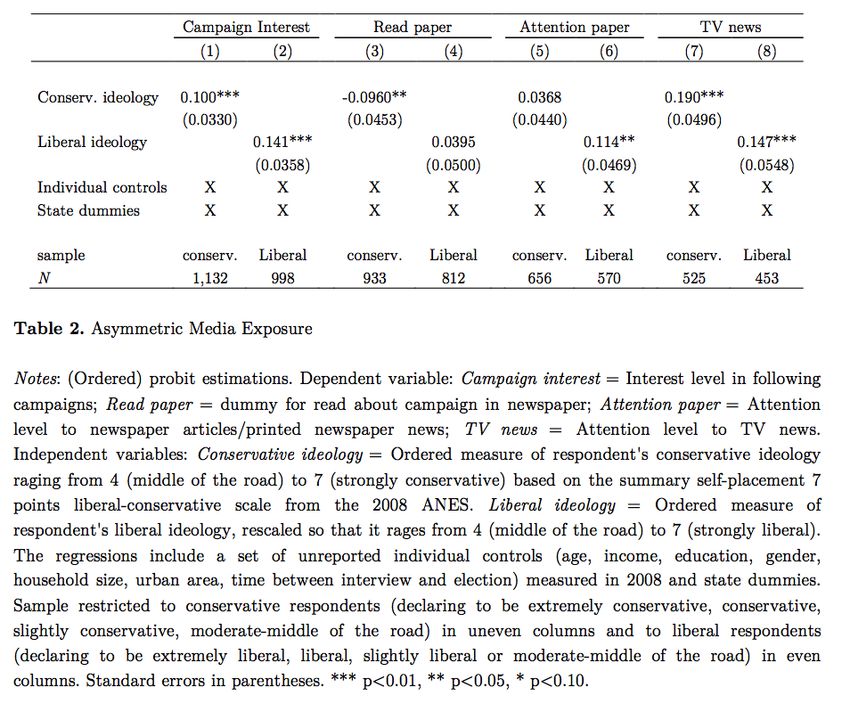
3.2 Asymmetric Media Exposure
A possible explanation for the asymmetric effect of media exposure on liberals’ and conservatives’
political attitudes rests on the potential asymmetric exposure to media of these two types of
individuals. Liberals could be more sensitive to newspapers’ coverage of politics because they
read more newspapers when conservatives are more exposed to TV news; an explanation that
would be consistent with Martin and Yurukoglu (2017). We investigate this possibility in Table
2 by regressing different measures of exposure to media on an ordered measure of conservative
ideology ranging from 4 (middle of the road) to 7 (strongly conservative) for the sample of rather
conservative respondents (from 4 to 7) in the odd columns. In the even columns we replicate this
exercise for the sample of rather liberal respondents.
From Columns (1) and (2), we deduce that more extreme ideology correlates positively with
the respondents’ interest level in politics, for both liberals and conservatives. Columns (3) to (6),
however, provide some support that more liberal respondents do pay more attention to newspapers
than moderate voters, while more conservative individuals tend to read less newspapers than mod-
www.economics-ejournal.org 9Economics: The Open-Access, Open-Assessment E-Journal 13 (2019–34)
erate voters. This result could explain the asymmetric effect of media coverage on the political
attitudes of liberals and conservatives, as observed in Table 1. Indeed, this evidence would suggest
that conservatives do not endorse more extreme positions in the presence of more politicised media
because they pay less attention to newspapers. On the other hand, liberal individuals who are
shown to read more newspapers, are then confronted to more politicised media, and this in turn
could radicalize their political attitudes.
One could object that conservatives may acquire relatively more information from alterna-
tive media sources, the most obvious candidate being TV. In such an instance, the exposure to
politicised media could be different than the one assumed in our analysis, thereby jeopardizing
our interpretations. The results of columns (7) and (8) show that respondents with more extreme
positions pay more attention to news about national politics on TV in both the conservative and the
liberal sample.12 This suggests that TV is not a information channel specific to the conservatives,
as opposed to the newspapers which are principally influencing liberals.
3.3 Political Knowledge and Money Contribution
Consistent with the evidence that politicized media radicalise political preferences (at least for
the liberals), we next show that they also tend to reinforce other aspects of the citizens’ political
sophistication, i.e. the capacity for a person to acquire knowledge on politics, assimilate information
and form political views. Indeed, our analysis uncovers that exposure to politicized media leads to
improved political knowledge. The estimations of Table 3 show that exposure to media is associated
with a higher probability that an individual recognizes the political colour of the majority in the
House of Representatives (column 1), in the Senate (column 2) and the name of the Speaker
of the House (column 3), in the states with a better coverage of politics. Dividing the sample
into conservatives and liberals, Table 4 shows that this effect holds for both sides of the political
spectrum.
Melki and Pickering (2014) consider two competitive hypotheses regarding the effect of the
media on individuals’ political preferences. According to the "benign" view, greater media access
produces a better-informed electorate, which may facilitate political consensus (for instance on
whether a specific policy is efficient or not), which should in turn reduce polarization. On the
contrary, the "malign" view supports that individual political preferences become more extreme
when people are confronted to news. This is a self-selection mechanism whereby out of the several
existing sources of information individuals select the ones more in line with their prior beliefs,
and that eventually radicalizes their priors. Although our results do not provide tangible evidence
of such a self-selection mechanism, they are nevertheless going against the benign view as they
support that more politicized media increase citizens’ political knowledge while radicalizing the
political preferences of a part of the electorate, thus contributing to a more polarized electorate.
Finally we provide evidence according to which the enhanced political sophistication entailed
by more politicized media materializes in observable involvement in politics. Indeed, using two
measures of monetary contributions to politics as the dependent variables in Table 5, we find that
12 In an unreported regression that further confirms these results, we replicated this regression with a variable measuring
the attention level given to TV news on Presidential campaign.
www.economics-ejournal.org 10Economics: The Open-Access, Open-Assessment E-Journal 13 (2019–34) the positive impact of the respondent’s interest in politics on the probability to contribute to a specific candidate during the campaign (columns 1 to 3) or to a political party (columns 4 to 6) is magnified in the states with a higher media coverage of politics. When splitting the sample into rather conservative and rather liberal respondents, we observe this effect to hold for both types of individuals. This result complements earlier work on the U.S. showing that the government invests disproportionally more on groups that have more access to the media, since we show that citizens also participate more to politics when exposed to media. www.economics-ejournal.org 11
Economics: The Open-Access, Open-Assessment E-Journal 13 (2019–34)

4   Conclusion

Analysts of politics lament that political polarization has been increasing in the US, and in many
other countries around the world. In this article we provide evidence that exposure to politicized
media may lead to a radicalization of individual political views, thereby producing more political
polarization. Interestingly, our results also suggest that political polarization may go hand in
hand with a higher political sophistication of citizens, more informed and interested in politics.
More generally, we show that the media-driven polarization is accompanied by other potentially
beneficial evolutions for democracies, which are the improved political knowledge and higher
political participation of citizens.

Acknowledgements We thank Michel Habib, co-editor Jan Fidrmuc, and two anonymous referees of this journal
for their valuable comments.

www.economics-ejournal.org                                                                            12
Economics: The Open-Access, Open-Assessment E-Journal 13 (2019–34)

References
Barro, R. (1976). Rational expectations and the role of monetary olicy. Journal of Monetary Economics, 2(1): 1–32.
  URL http://ideas.repec.org/a/eee/moneco/v2y1976i1p1-32.html.

Boxell, L., Gentzkow, M., and Shapiro, J. M. (2017). Greater Internet use is not associated with faster growth in
  political polarization among US demographic groups. Proceedings of the National Academy of Science, 114(40):
  10612–10617. URL https://www.pnas.org/content/114/40/10612.

Campante, F. R., and Do, Q.-A. (2014). Isolated capital cities, accountability, and corruption: evidence from US states.
  American Economic Review, 104(8): 2456–2481. URL https://doi.org/10.1257/aer.104.8.2456.

Campante, F. R., and Hojman, D. A. (2013). Media and polarization: evidence from the introduction of broadcast TV in
  the United States. Journal of Public Economics, 100: 79–192. URL https://doi.org/10.1016/j.jpubeco.2013.02.006.

Druckman, J. N. (2003). The power of television images: the first Kennedy Nixon debate revisited. Journal of Politics,
  65(2): 559–571. URL https://www.jstor.org/stable/10.1111/1468-2508.t01-1-00015.

Esteban, J.-M., and Ray, D. (1999). On the measurement of polarization. Econometrica, 62(4): 819–851.                 URL
   https://www.jstor.org/stable/2951734.

Facchini, G., and Mayda, A. M. (2009). Does the welfare state affect individual attitudes toward immigrants? Evidence
   across countries. Review of Economics and Statistics, 91(2): 295–314. URL https://www.mitpressjournals.org/doi/
   pdf/10.1162/rest.91.2.295.

Gentzkow, M. (2006). Television and voter turnout. Quarterly Journal of Economics, 121(3): 931–972.                   URL
  https://doi.org/10.1162/qjec.121.3.931.

Grechyna, D. (2016). On the determinants of political polarization. Economics Letters, 144: 10–14.             URL   https:
  //doi.org/10.1016/j.econlet.2016.04.018.

Halberstam, Y., and Knight, B. (2016). Homophily, group size, and the diffusion of political information in social
  networks: evidence from Twitter. Journal of Public Economics, 143: 73–88. URL https://doi.org/10.1016/j.jpubeco.
  2016.08.011.

Kennedy, P., and Prat, A. (2017). Where do people get their news?            SSRN Working Paper 17–65.        URL    https:
  //papers.ssrn.com/sol3/papers.cfm?abstract_id=2989719.

Lelkes, Y., Sood, G., and Iyengar, S. (2017). The hostile audience: the effect of access to broadband internet on partisan
   affect. American Journal of Political Science, 61(1): 5–20. URL https://doi.org/10.1111/ajps.12237.

Martin, G. J., and Yurukoglu, A. (2017). Bias in cable news: persuasion and polarization. American Economic Review,
  107(9): 2565–2599. URL https://doi.org/10.1257/aer.20160812.

Melki, M., and Pickering, A. (2014). Ideological polarization and the media. Economics Letters, 125(1): 36–39.        URL
  https://doi.org/10.1016/j.econlet.2014.08.008.

Prior, M. (2013). Media and political polarization. Annual Review of Political Science, 16: 101–127.           URL   https:
   //doi.org/10.1146/annurev-polisci-100711-135242.

Reynal-Querol, M. (2002). Ethnicity, political systems, and civil wars. Journal of Conflict Resolution, 46(1): 29–54.
  URL https://doi.org/10.1177/0022002702046001003.

Snyder, J. M., and Strömberg, D. (2010). Press coverage and political accountability. Journal of Political Economy,
  118(02): 355–408. URL https://www.jstor.org/stable/10.1086/652903.

Strömberg, D. (2004). Radio’s impact on public spending. Quarterly Journal of Economics, 119(1): 189–221.             URL
   https://doi.org/10.1162/003355304772839560.

www.economics-ejournal.org                                                                                              13
Please note:
You are most sincerely encouraged to participate in the open assessment of this article. You can do so by
either recommending the article or by posting your comments.
Please go to:
http://dx.doi.org/10.5018/economics-ejournal.ja.2019-34

The Editor

© Author(s) 2019. Licensed under the Creative Commons License - Attribution 4.0 International (CC BY 4.0)
You can also read