Mercury Exposure through Fish Consumption in Traditional Communities in the Brazilian Northern Amazon - MDPI
←
→
Page content transcription
If your browser does not render page correctly, please read the page content below
International Journal of
           Environmental Research
           and Public Health

Article
Mercury Exposure through Fish Consumption in
Traditional Communities in the Brazilian
Northern Amazon
Sandra de Souza Hacon 1, *, Marcelo Oliveira-da-Costa 2 , Cecile de Souza Gama 3 ,
Renata Ferreira 4 , Paulo Cesar Basta 1 , Ana Schramm 1 and Decio Yokota 4
 1    Fundação Oswaldo Cruz, Escola Nacional de Saúde Pública Sérgio Arouca, Rio de Janeiro 21041-210, Brazil;
      pcbasta@ensp.fiocruz.br (P.C.B.); schrammana@posgrad.ensp.fiocruz.br (A.S.)
 2    WWF-Brasil, Brasília 70377-540, Brazil; marcelo@wwf.org.br
 3    Instituto de Pesquisas Científicas e Tecnológicas do Amapá, Av. Feliciano Coelho, 1509. Trem,
      Amapá 68901-025, Brazil; cecile.gama@iepa.ap.gov.br
 4    Iepé-Instituto de Pesquisa e Formação Indígena, Macapá, Amapá 68908-120, Brazil;
      renata.ferreira@institutoiepe.org.br (R.F.); decio@institutoiepe.org.br (D.Y.)
 *    Correspondence: shacon@ensp.fiocruz.br

 Received: 29 June 2020; Accepted: 16 July 2020; Published: 22 July 2020

 Abstract: Artisanal small-scale gold mining (ASGM) is the main source of anthropogenic mercury
 emissions and contamination in Latin America. In the Brazilian northern Amazon, ASGM has
 contaminated the environment and people over the past century. The main contamination route
 is through fish consumption, which endangers the food security and livelihoods of traditional
 communities. Our study aims to assess the potential toxicological health risks caused by the
 consumption of Hg-contaminated fish across five regions in Amapá State. We sampled 428 fish from
 18 sites across inland and coastal aquatic systems. We measured the total mercury content in fish
 samples, and the results were applied to a mercury exposure risk assessment targeting three distinct
 groups (adults, women of childbearing age, and children). Mercury contamination was found to
 exceed the World Health Organization’s safe limit in 28.7% of all fish samples, with higher prevalence
 in inland zones. Moreover, the local preference for carnivorous fish species presents a serious health
 risk, particularly for communities near inland rivers in the region. This is the first study to provide
 clear recommendations for reducing the mercury exposure through fish consumption in Amapá State.
 It builds scientific evidence that helps decision-makers to implement effective policies for protecting
 the health of riverine communities.

 Keywords: protected areas; traditional communities; mercury contamination; health risk
 assessment; Amazon

1. Introduction
      Artisanal small-scale gold mining (ASGM) activities have significantly expanded in the Amazon
over the last two decades. ASGM is a major cause of deforestation and habitat degradation in
the Brazilian northern Amazon [1–3], particularly on the borders between Guyana, French Guiana,
Suriname, and Venezuela, and the Brazilian states of Roraima, Amapá, and Pará (also known as the
Guiana Shield Ecoregion) [4]. The ecoregion covers 250 million hectares and contains one of the largest
complexes of uninterrupted primary tropical forests on Earth [5]; the region therefore plays a critical
role in mitigating global climate change and preserving biodiversity and freshwater ecosystems.
      The Brazilian state of Amapá borders French Guiana and Suriname, and almost 72% of its territory
is formally protected. It consists of five indigenous territories, four quilombolas territories, and nineteen

Int. J. Environ. Res. Public Health 2020, 17, 5269; doi:10.3390/ijerph17155269     www.mdpi.com/journal/ijerph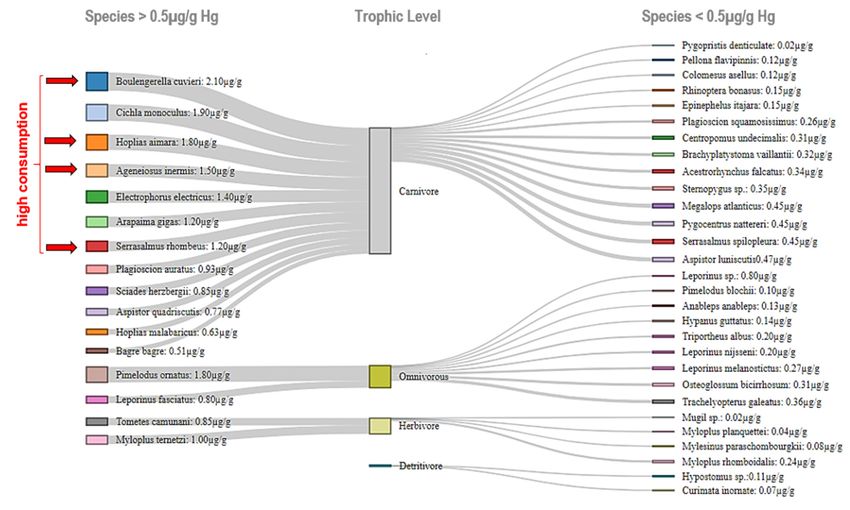
Int. J. Environ. Res. Public Health 2020, 17, 5269 2 of 15
conservation units (twelve federal, five state, and two municipal), covering a total area of 115.656 km2 .
These areas are crucial for human livelihoods, especially for communities that rely on their natural
resources. However, the protection of these areas has been hampered by weak governance, lack of
financial resources for protective management, and different anthropogenic pressures. Among those
threats, the widespread use of mercury (Hg) in ASGM has led to the contamination of both the
environment and the regional population.
The ASGM sector is the leading source of mercury emissions, contamination, and consumption in
Latin America and the Caribbean [6]; thus, the traditional communities that depend on natural resources
for their survival are highly vulnerable to ASGM activities. This activity is generally coordinated by illegal
networks and conducted by wildcat gold miners, and dealers [7]. ASGM has adversely affected the health
of riverside communities—particularly indigenous people [8,9]—that rely on fish as their main protein
source [10,11]. Fisheries in the Amazon provide food security and reduce malnutrition rates, as fish are the
dominant dietary source of essential amino acids, lipids with fatty acids, minerals, and vitamins [12,13].
In ASGM-dominated regions, human exposure to Hg is mainly through bioaccumulation and
biomagnification of methylmercury from fish consumption. In the Brazilian Amazon, indigenous
people, riverside communities, fishermen, quilombolas, peasants, and extractivists inhabit the areas
near rivers, bays, and streams and are therefore highly exposed to Hg compounds. This reality is
aggravated by the social vulnerability of exposed communities, including reduced access to healthcare,
formal education, regular income, basic sanitation, and potable water. In addition, these communities
suffer from high rates of malnutrition, particularly in children under 5 years of age. They are also
vulnerable to a high number of infectious and respiratory diseases (such as malaria, hantavirus
pulmonary syndrome, leishmaniasis, yellow fever, etc.) that are exacerbated by both changes in land
use and climate [14].
Therefore, mercury contamination in the Amazon is both a national and international concern.
In this study, we aimed to develop a better understanding of the risks associated with fish consumption
in various regions of the northern Amazon. Although a few studies have shown mercury contamination
in fish in the region [5], this is the first to conduct an investigation on human Hg exposure in the
study region. We assessed the potential toxicological health risks from mercury exposure through fish
consumption for different age groups across five regions in Amapá State.
2. Methods
2.1. Study Area
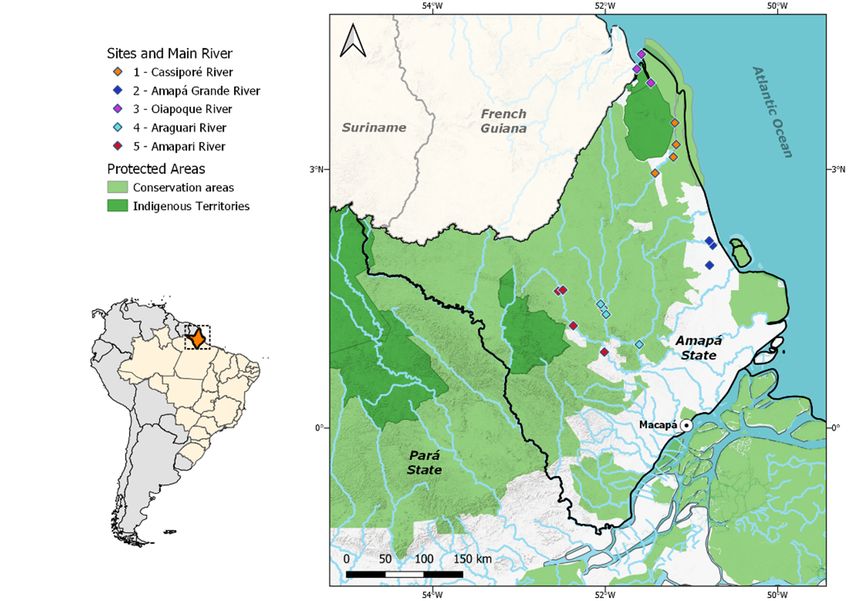
We assessed five regions in the Amapá State territory, including some of the most biodiverse
and economically significant river basins in the region (Figure 1). Watersheds in the state play an
important social, cultural, and economic role, and fish resources in the region are heavily influenced
by the Amazon River and Atlantic Ocean. We chose rivers that bordered protected areas (Table 1)
due to the higher occurrence of mineral deposits [15] and higher number of ASGM sites surrounding
Amapá’s protected areas [16]. Sampling sites were set up at potential ASGM sites (active and inactive).
These sites were identified based on gold mining deforestation maps [3], literature reviews [5,17],
the presence of local communities, the influence of coastal tides or inland waters, sampling logistics,
the distance to protected areas, and interviews with managers of protected areas and locals with
knowledge of the regional gold mining history. Sampling sites 1, 2, and 3 are directly influenced by
coastal tides and are therefore considered coastal zones, while sites 4 and 5 are located in inland waters
and are therefore referred to as inland zones.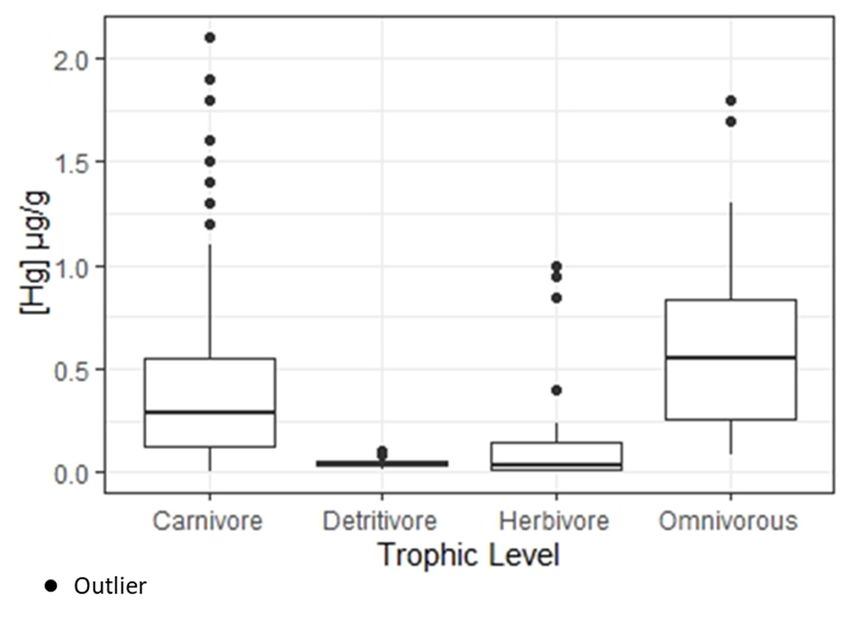
Int. J. Environ. Res. Public Health 2020, 17, 5269 3 of 15
Table 1. Description of the sampling sites and the surrounding regions.
Sites and Main River Tributaries-Sampling Sites Coordinates of Sampling Sites Characteristics of the Region Correlation to Gold Mining Activity
03◦ 320 27.71” N
Maruani River
51◦ 110 34.23” W Coastal zone. Muddy water. High fishing pressure. Gold mining activity for over 250 years.
02◦ 570 25.57” N Influence of tides and pororoca. Protected Areas: Cabo Influence of Garimpo do Lourenço,
CR-Bridge
51◦ 250 18.10” W Orange National Park and Amapá State Forest. located at the headwaters of the
1-Cassiporé River (CR) Communities (pop): Oiapoque, 27.270 a ; Calçoene,
03◦ 170 16.87” N Cassiporé River. On-going mining
CR
51◦ 100 36.68” N 11.117 a ; Vila Velha, 2.723 b ; Cunani (Quilombo) 940 b . processes in the indigenous land of Uaçá
03◦ 080 34.16” N Indigenous lands: Juminã, 61 c ; Uaçá, 4.462 c ; Galibi, 151 d . for gold research and exploration.
CR-Vila Velha
51◦ 120 36.16” W
02◦ 100 16.19” N
AG Coastal zone. Muddy river bottom. High fishing pressure. This region is influenced by Garimpo do
50◦ 470 39.41” W
Influence of tide and pororoca. Protected Areas: Cariaú Tartarugalzinho. At least five other areas
2-Amapá Grande 02◦ 070 13.50” N
AG-Confluence River reserve, Maracá-Jipioca Ecological Station. in the region constitute environmental
River (AG) 50◦ 450 17.52” W
Communities (pop): Calçoene, 11.117 a ; Pracuúba, 5.120 a ; liabilities: Bananal, Buracão, Fofoca,
01◦ 530 19.07” N
Flechal Amapá, 9.109 a Tartarugalzinho, 17.315 a . Mandiocal and Mineiro.
50◦ 470 25.27” W
04◦ 00 11.66” N
Uaçá River Coastal zone. Muddy water. High fishing pressure. Large
51◦ 280 16.28” W Displacement of illegal ASGM toward
population in the surroundings. Borders French Guiana.
04◦ 90 49.10” N French Guiana from 2002. Influence from
3-Oiapoque River (OR) OR Communities (pop): Oiapoque, 27.270 a Calçoene,
51◦ 370 59.97” W ASGM sites in the whole basin from both
11.117 a . Indigenous lands: Juminã, 121 c ; Uaçá: 4 462 c ;
04◦ 200 9.00” N countries.
OR (Bay) Galibi: 151 d .
51◦ 340 50.20” W
01◦ 230 27.10” N
Tajauí River
52◦ 010 28.02” W
Inland zone. Sandy River bottom. Illegal fishing.
00◦ 580 09.70” N
Falsino River Protected Areas: Tumucumaque National Park, Amapá
51◦ 360 16.90” W Influence of the Amapari, Lourenço, Vila
4-Araguari River (AR) National Forest. Communities (pop): Pedra Branca do
01◦ 260 16.75” N Nova, Capivara, Mururé ASGM sites.
Mureré River Amapari, 16.502 a ; Porto Grande, 21.971 a ; Ferreira Gomes,
52◦ 030 14.30” W
7.780 a .
01◦ 190 02.84” N
Mutum River
51◦ 590 23.09” W
01◦ 350 16.86” N
AMR
52◦ 320 38.18” W
Inland zone. Sandy River bottom. Protected Areas: Four legal active ASGM sites. Illegal gold
01◦ 360 04.52” N
Anacuí River Tumucumaque Mountains National Park, Amapá mining sites within PAs and prospection
5-Amapari 52◦ 290 26.99” W
National Forest. Communities (pop): Pedra Branca do projects. The Tucano’s Gold Mine (Pedra
River(AMR) 01◦ 110 13.52” N
AMR/Jurupá River Amapari, 16.502 a ; Serra do Navio, 5.397 a . Indigenous: Branca do Amapari) is the second largest
52◦ 220 14.66” W
Wajãpi, 1.200 d . gold mine in Brazil.
00◦ 520 53.52” N
AMR (Porto Terezinha)
52◦ 000 36.84” W
a [18]. b [19]. c [20]. d [21]. e [22].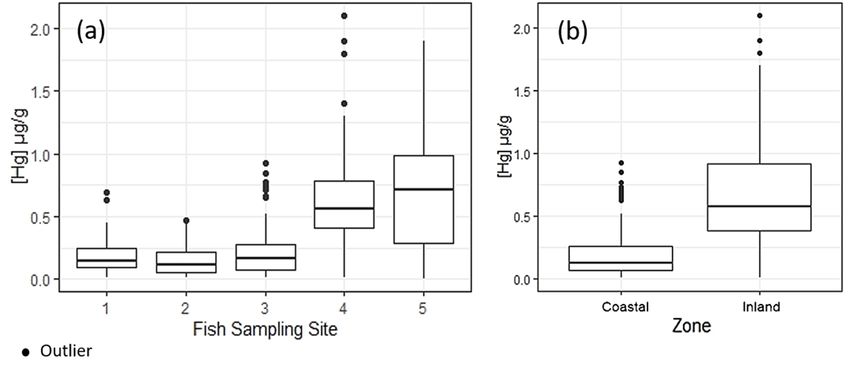
Int. J. Environ. Res. Public Health 2020, 17, 5269                                                            4 of 15
Int. J. Environ. Res. Public Health 2020, 17, x                                                                          3 of 17

      Figure 1.Figure
                   Map 1.ofMap
                            theofstudy   area
                                  the study    indicating
                                            area            thesampling
                                                 indicating the sampling    sites,
                                                                        sites,     protected
                                                                               protected        areas,
                                                                                         areas, and     and indigenous
                                                                                                    indigenous territories.
      territories.
           2.2. Fish Sampling and Preparation
                 Between August 2017 and May 2018, we collected tissue samples from 428 fish from 45 different
            species at 18 sites across the five regions (Table 1). The fish were caught by local fishermen hired
            to support the research project. According to the local fishermen, each fish species was captured
            using specific gear; therefore, gillnets, hooks and hand lines, fishing rods and long lines were used.
            Each specimen was identified to the species level, and a minimum of 70 g of muscle tissue (free of
            skin) was extracted from the dorsal region of the fish body. All dissection tools were sterilized before
            sampling to avoid contamination. Samples were stored in ice boxes and frozen for transportation to
            the laboratory. The study was conducted in accordance with the Brazilian regulation (IN 03/2014),
            under the license SISBIO 58296-1.

            2.3. Mercury Analysis
                 Total mercury (THg) was measured by cold vapor atomic fluorescence spectrometry at the Analytical
           Chemistry Laboratory of the Pontific University of Rio de Janeiro [23]. The analytical quality was
           determined by control strict blanks with duplicate analysis and compared to the analytical results of
           certified reference materials (DORM-2, Dogfish Muscle Certified Reference Material for trace elements,
           National Research Council, Ottawa, ON, Canada). Average recovery values were >96% of the certified
           value analytical results; and the relative standard deviation (RSD) was
Int. J. Environ. Res. Public Health 2020, 17, 5269 5 of 15
identification, (ii) dose–response assessment, (iii) exposure assessment, and (iv) risk characterization.
Most risk assessment studies use secondary data; however, our Hg exposure assessment used
information on the most consumed fish species in the region [5] as well as informal interviews with
local fishermen and individuals from indigenous and riverine communities.
2.5. Estimated Daily Intake
To assess the health risks of total mercury exposure, we incorporated two scenarios for toxicological
risk: (i) the critical scenario and (ii) the current scenario. The critical scenario assumes that some of
the local communities—including the indigenous communities—consume larger quantities of fish
due to the lack of other protein sources. The current scenario represents the eating habits of most
of the communities in the study area. The estimated exposure dose of fish consumers from both
coastal and inland zones were divided into three groups: (i) adults of both genders (age: 17 to 75),
(ii) women of childbearing age (age: 17 to 49), and (iii) children/juveniles (age: 5 to 16). We estimated
their daily intake (EDI) to determine each group’s daily Hg consumption [25]. The average daily fish
consumption was based on 16 studies (Table 2) that assessed the dietary patterns and fish consumption
of Amazonian communities.
The potential exposure dose (µg/kg/d) was calculated according to Equation (1) [26]:
IR × EF × ED 1
Dpot = C × × (1)
BW AT
where Dpot is the potential mercury intake dose (µg/kg/day); C is the total mercury concentration of
fish species (µg/g); IR is the fish intake rate (kg/meal); EF is the frequency of exposure (meals /day);
ED is the exposure duration (day, week); AT corresponds to the time weighted (day) (time weighted
considers the duration of exposure); and BW is the body weight (kg).
The risk ratio was calculated as the ratio between the potential intake dose and the reference dose
using the risk quotient equation (Equation (2)):
QR = Dpot /RfD (2)
where QR is the risk quotient; Dpot is the potential mercury intake dose (µg/kg/day); and RfD is
the reference dose (1.6 µg/kg/week or 0.23 µg/kg/day [25]) of the substance or chemical element
(Hg) that can be consumed weekly over a lifetime without appreciable risk to health. A QR of 1 indicates the possibility of adverse
non-carcinogenic effects.
Table 2. Summary of articles that quantified fish consumption in communities in the Brazilian Amazon.
Reference
Consumption (g/Day;
Reference Local Year Population N Meals/Week; Daily Eat %)
Average (SD) Min-Max
[27] Monte Alegre/PA 1993–1995 Families 35 369 −
[28] Rio Madeira/RO 1991 and 1993 All ages 607 243 (135) 100–300
[29] Rio Cuiabá/MT 1995–1996 >12 153 110.4 (152.5) 20–372
Maroni River,
CommunityInt. J. Environ. Res. Public Health 2020, 17, 5269 6 of 15
Table 2. Cont.
Reference
Consumption (g/Day;
Reference Local Year Population N Meals/Week; Daily Eat %)
Average (SD) Min-Max
Munduruku 249 30.0 (16.6) −
[33] Indigenous/PA −
Kayabi 47 110.4 (60.6) −
Woman > 15 121 124 (65) −
[34] Rio Tapajós/PA 2003
Men > 15 135 189.7 (105.5) −
[35] Lago Puruzinho/PA 2005–2006 All ages 120 406 (204.1) −
Madeira River, Curiã Grouped Daily eat (%)
[36] 2009–2011
Lake, Porto Velho Villages 5.8%–57.7%
All 51 34.29 7.1–330
Young 23 21.4 7.1–180
[37] Madeira River/RO 2015
Woman 12 34.3 10–328.6
Adults (1549–) 28 51.1 10–330
Community of Woman 46 4.9 Meals/week −
[38] Brasília Legal, 2004
Men 22 6 Meals/week −
Tapajós/PA
85 416.39 (209.12) −
Lower Amazon River
[39] Trombetas River 2006–2008 Families 183 490 (240.69) −
Purus River 54 469 (207.72) −
Men Meals/week
(015–) 28 15 ± 0
(1660–) 21 20 ± 1
Tapajós
(5060–) 55 20 ± 0
[40] River–Community of
Woman Meals/week
Barreiras/PA
(015–) 26 14 ± 0
(1660–) 40 20 ± 0
(5060–) 17 20 ± 0
Middle Madeira Grouped
[7] 2009–2010 132 440 270–460
River/RO Villages
2.6. Model Input Variables
The description of the input variables for the mercury exposure model for both the critical and
current scenarios are shown in Table 3. We assumed a 50% consumption of fish species in age groups
with larger average Hg concentrations (carnivorous and omnivorous) as well as the groups with the
lowest Hg concentration (herbivorous and detritivores). The literature review showed a high frequency
of fish consumption and a high variability in the quantity of meals, ranging from 1 to 20 meals per
week [38,40]. We therefore set an average of 10 meals of fish consumed per week, varying from 160 to
430 g/day, based on the characteristics of each group. We estimated the fish daily intake values based
on the literature review (Table 2). The average body weight of the residents in the communities was
obtained from research on family budgets that presented the anthropometry and nutritional status of
children, adolescents, and adults in the state of Amapá [19].Int. J. Environ. Res. Public Health 2020, 17, 5269 7 of 15
Table 3. Exposure parameters used for the health risk assessment of residents in areas influenced by coastal tides (sites 1, 2, and 3) and inland zones (sites 4 and 5).
Women of
Child & Juvenile Women and Men Adults
Childbearing Age
Exposure Parameters by Scenario (5–16) (17–75)
(16–49)
Coastal Tidal Inland Coastal Tidal Inland Coastal Tidal Inland
[Hg]-omnivorous and carnivorous–Average (SD) µg/g 0.50 (0.37) 0.66 (0.61) 0.50 (0.37) 0.66 (0.61) 0.50 (0.37) 0.66 (0.61)
Current
[Hg]-detritivore and herbivore– Average (SD) µg/g 0.17 (0.18) 0.17 (0.22) 0.17 (0.18) 0.17 (0.22) 0.17 (0.18) 0.17 (0.22)
Average fish consumption (kg/d) adjusted for trophic level 0.160 (0.49) 0.160 (0.49) 0.300 (0.154) 0.300 (0.154) 0.255 (0.135) 0.255 (0.135)
Critical
[Hg] (omnivorous & carnivore) 95% µg/g 1.2 (0.37) 1.48 (0.64) 1.2 (0.37) 1.48 (0.64) 1.2 (0.37) 1.48 (0.64)
Average fish consumption (kg/d) 95% carnivorous 0.192 0.192 0.430 0.430 0.300 0.300
Average body weight
25 (12.0) 25 (12.0) 65 (6.3) 65 (6.3) 58 (4.7) 58 (4.7)
kg (SD)
SD—standard deviation.Int. J. Environ. Res. Public Health 2020, 17, 5269 8 of 15
To quantify exposure, we calculated the mean Hg concentrations of carnivorous and omnivorous
fish as well as the 95% confidence interval (CI) of each mean. We also conducted a literature review
to determine the frequency of fish meal consumption and estimated potential doses by assigning
the 95% upper limit of the mean fish consumption. It was assumed 100% of THg concentration was
methylmercury, since methyl Hg constitutes up to 98% of the Hg concentration in fish samples in the
Amazon basin. The body weight was the same for both scenarios, and the factor absorption of total Hg
as methyl Hg by exposed residents was assumed to be 100% for both scenarios. We used the lognormal
Int. J. Environ. Res. Public Health 2020, 17, x 10 of 17
function to estimate the exposure dose.
3.3.Results
Results
3.1.Mercury
3.1. MercuryLevels
LevelsininFish
FishSpecies
Speciesand
andTrophic
TrophicLevels
Levels
Allof
All ofthe
the 428
428 fish
fish sampled
sampled in in this
this study
studyhad
haddetectable
detectablelevels
levelsofofmercury,
mercury, andand 28.7%
28.7%exceeded
exceededthe
World Health Organization’s (WHO) mercury threshold (0.5 µg/g) for human
the World Health Organization’s (WHO) mercury threshold (0.5 µg/g) for human consumption. The consumption. The Hg
concentration
Hg concentrationin in
fish exceeded
fish exceeded the
thesafe
safelimit
limitinin77.6%
77.6%of ofcarnivores,
carnivores, 20% of omnivorous,
20% of omnivorous,and and2.4%
2.4%
of herbivores. Carnivorous fish accounted for 76% (n = 325) of the total samples,
of herbivores. Carnivorous fish accounted for 76% (n = 325) of the total samples, with average Hg with average Hg
concentrations of
concentrations of 0.4
0.4 µg/g
µg/g (SD(SD == 0.38)
0.38) and
andaaconcentration
concentrationrange rangeofof0.008–2.1
0.008–2.1µg/g.
µg/g. Interestingly, thethe
Interestingly, Hg
concentration in omnivorous fish averaged 0.60 µg/g (SD = 0.42) and
Hg concentration in omnivorous fish averaged 0.60 µg/g (SD = 0.42) and reached a maximum of 1.8 reached a maximum of
1.8 µg/g. This could be explained by changes in fish feeding habits.
µg/g. This could be explained by changes in fish feeding habits. For instance, fish from the For instance, fish from the
omnivorousspecies
omnivorous Pimelodusornatus
speciesPimelodus ornatuscan canchange
changetheir
theirdiet
dietdepending
dependingon onthe
theresources
resourcesavailable
availablein in
the environment. Two herbivorous species showed unexpectedly high Hg
the environment. Two herbivorous species showed unexpectedly high Hg concentrations of 1.0 µg/g concentrations of 1.0 µg/g
for Mylesinusparaschombourgkii
forMylesinus paraschombourgkii(flaviano)
(flaviano)and and0.85
0.85µg/g Myloplusternetzi
forMyloplus
µg/gfor ternetzi(pacu).
(pacu).We Wealso
alsoobserved
observed
significantdifferences
significant differencesin inthe
the average
average Hg Hg concentrations
concentrations between
between trophic
trophic levels (pInt. J.J. Environ.
Environ. Res.
Res.Public
PublicHealth
Health2020, 17,x5269
2020,17, 119of
of 17
15
Int. J. Environ. Res. Public Health 2020, 17, x 11 of 17
Figure Sankey
Figure3.3.Sankey diagram
Sankeydiagram categorizing
diagramcategorizing the studied
categorizing the
the studiedfish
studied fishspecies
fish speciesand
species andtrophic
and trophiclevels
trophic levelsbyby
levels bytotal
total
total mercury
mercury
mercury
concentrations (≥0.5
concentrations(≥0.5 µg/g
(≥0.5µg/g and
µg/gand ≤0.5
and≤0.5 µg/g).
≤0.5µg/g).
µg/g).
3.2. Mercury Levels at Sampling Sites (Inland and Coastal Zone)
3.2. Mercury
3.2. MercuryLevelsLevelsatatSampling
SamplingSites
Sites (Inland
(Inland and Coastal Zone)
Coastal Zone)
The median Hg contamination of inland fish samples was 0.580 µg/g for carnivores (n = 131),
The Themedian
medianHg Hgcontamination
contamination of of inland
inland fish samples
samples waswas0.580
0.580µg/g
µg/gfor forcarnivores
carnivores(n(n= 131),
= 131),
0.045 µg/g for herbivores (n = 15), and 0.680 µg/g for omnivores (n = 33); samples of detritivorous
0.045µg/g
0.045 µg/gforforherbivores
herbivores(n (n== 15),
15), and
and 0.680
0.680 µg/g for
for omnivores
omnivores(n (n==33);
33);samples
samplesofofdetritivorous
detritivorous
species
specieswerewere not
werenot notcollected.
collected. In In coastal
In coastal zones,
zones, the
the median
median Hgconcentrations
concentrations were0.165 0.165 µg/g for
species collected. coastal zones, median Hg Hg concentrationswere were 0.165µg/g µg/gforfor
carnivores (n = 194),
carnivores(n(n= =194), 0.019
194),0.019 µg/g
0.019µg/g for
µg/g for herbivores
for herbivores (n
herbivores (n= 5), 0.290 µg/g for omnivores (n = 15), and 0.044 µg/g
carnivores (n == 5),
5), 0.290
0.290 µg/g
µg/gforforomnivores
omnivores(n(n= =15), 15),and
and0.044
0.044
for detritivores
µg/gfor (n
fordetritivores = 35).
detritivores(n(n==35). The median
35).The
Themedian Hg
median Hg levels of
Hg levels carnivorous
levels of and omnivorous species showed no
µg/g of carnivorous
carnivorousand andomnivorous
omnivorousspeciesspecies showed
showed
statistical differences in both aquatic systems. Hg contamination exceeded the WHO limit in 28.7%
nono statisticaldifferences
statistical differencesininboth bothaquatic
aquatic systems.
systems. Hg
Hg contamination
contaminationexceeded
exceededthe theWHO
WHOlimit inin
limit 28.7%
28.7%
ofofallallsamples,
samples, inin5.2%
5.2% ofofcoastal
coastal samples,
samples, and
and 61.5%
61.5% of inland
of samples(p(pInt. J. Environ. Res. Public Health 2020, 17, 5269 10 of 15
The highest Hg concentrations were detected in Serrasalmus rhombeus (piranha preta), Pimelodus ornatus
(mandi casaca), and Hoplias aimara (traírão) in the inland water zone, and Sciades herzbergii (bagre guribu),
Megalops atlanticus (pirapema), and Hoplias malabaricus (traíra) in the coastal zone.
3.3. Health Risk Assessment
Fish from the inland zone had higher levels of Hg compared to fish from the coastal zone
(Figure 4b). This is reflected by the potential dose and toxicological QR of total mercury for both
exposure scenarios in coastal and inland zones (Table 4). The potential THg dose of the three groups
was mostly above the acceptable reference dose of 1.6 µg/kg/week or 0.23 µg/kg/day [25]. In the critical
scenario in both zones, the potential THg dose showed high risks of adverse health effects in all groups,
regardless of location. The exception was the current scenario for women of childbearing age in the
coastal zone (0.08 µg/kg/day). Children/juveniles in the inland zone showed significantly greater risks
(p ≤ 0.005) under the critical scenario (55) relative to the current scenario (37.5). Our results highlight
the elevated health risks associated with fish consumption in the study area.
Table 4. Potential dose (Dpot ) and toxicological risk quotient (QR) of total mercury for both exposure
scenarios in coastal and inland zones.
Pot. Dose Pot. Dose Pot. Dose
Exposure Scenario Child & Juvenile Women and Men Adults Woman of Childbearing Age
(5–16) (17–75) (16–49)
µg/kg/day µg/kg/week µg/kg/day µg/kg/week µg/kg/day µg/kg/week
Dpot /d Dpot /w Dpot /d Dpot /w Dpot /d Dpot /w
Coastal Zone
Current scenario 6.8 34 0.5 2.5 0.08 0.4
Critical scenario 6.9 34.5 6.0 30 4.7 23.5
Inland Zone
Current scenario 7.5 37.5 1.9 9.5 1.8 9
Critical scenario 11 55 9.9 49.5 7.7 38.5
4. Discussion
High levels of mercury were detected in different fish species and trophic levels in remote and
legally protected areas of the northern Amazon; this suggests a high risk of Hg contamination in local
fish consumers. Based on the risk assessment of fish Hg concentrations from 18 sites in Amapá State
we recommend a low-risk fish diet for the three different groups. We found that the local preference for
carnivorous fish species presents a significant health risk for local communities, particularly in inland
water zones. As top predators, carnivorous fish bioaccumulate larger quantities of Hg throughout
their lifecycle.
The mercury dynamics in aquatic ecosystems are complex and influenced by many factors,
including soil type, river flow, fish trophic level, age of fish, season, pH, the productivity of aquatic
ecosystems, characteristics of methylation sites, and others [41,42]. As most of the fish samples (81%)
were caught during the dry season (with only one field campaign during the rainy season), our study
may be limited by the lack of seasonal data; however, we observed no significant difference in Hg
concentration in the fish sampled in the dry and rainy seasons (p ≥ 0.05). Another potential source
of bias is the lack of detailed primary data on local eating habits, including dietary patterns and
meal composition, particularly with regard to the fish intake dose. To minimize this potential bias,
we incorporated a conservative approach by assuming a low daily fish intake in relation to the current
exposure scenario and in response to the high frequency and quantity of weekly meals [27,40]; this is
due to the high regional heterogeneity in the Amazon region, where fish consumption is higher in
some communities due to the lack of alternative protein sources.Int. J. Environ. Res. Public Health 2020, 17, 5269 11 of 15
Furthermore, erosion can significantly influence THg levels in Amazonian aquatic ecosystems
by mobilizing inherited Hg in soils. Consequently, efforts to reduce Hg exposure—particularly in
populations downstream of ASGM sites—must also address soil erosion, with a particular focus on
vulnerable rivers and streams in riparian forests [43]. In addition, changes in land cover/use leads
to frequent forest fires, which releases large quantities of Hg to the atmosphere [44] and aquatic
systems [42]. These issues require the political will to implement effective policies to reduce the drivers
of deforestation in the Amazon.
Comparing the current and critical scenarios in the coastal zone, we observed no significant
difference in the potential doses of children/juveniles based on the acceptable methylmercury dose
(1.6 µg/kg/week or 0.23 µg/kg/day) [25]. In contrast, a significant difference was observed in the
potential doses of children in the inland zone (p ≤ 0.005). For this group, we assumed children consume
the same fish species as adults but in smaller quantities. Furthermore, children are at significant risk
of Hg exposure because of their higher Hg doses and lower body weights (approximately half that
of adults). The potential dose for the other two groups (adults and pregnant women) in both zones
was double the WHO’s daily recommended dose at 0.5 µg/kg/day. The potential dose for women of
childbearing age in the coastal zone was within the safe limit at 0.08 µg/kg/day. Nevertheless, under the
critical scenario in the coastal zone, the toxicological risks for adults (men and women) was 26 and
20 times higher than the daily reference dose for adults and women of childbearing age, respectively.
Our results suggest that both groups in the coastal zone that consume carnivorous fish five times per
week on average have significantly higher health risks from THg contamination, even in areas where
lower fish Hg levels were observed.
Both scenarios showed a high risk of Hg contamination in the inland zone. The highest risks were
observed in children at doses of 37.5 µg/kg/week and 55 µg/kg/week. The consumption of fish with
high levels of Hg therefore poses significant health risks for this group. Adults under the current and
critical scenarios in both zones had a potential dose of 1.9 µg/kg/day and 9.9 µg/kg/day, respectively,
inferring a low risk for the current scenario and very high risk for the critical scenario. For pregnant
women, the potential dose was 1.8 µg/kg/day under the current scenario, and the dose for the critical
scenario was 4.3 times that of the current scenario. Many studies assessing riverbank populations in
the Amazon show that a small proportion of the communities consume carnivorous fish at a frequency
of 10 meals a week [15,27,36,39].
These communities have been exposed to Hg contamination for over a century through the
ingestion of mercury contaminated fish. This long-term Hg exposure has led to potential adverse
health effects, such as fetal impairment in women of childbearing age [45–47].
Our findings suggest that the consumption of the carnivorous fish species Cichla monoculus,
Hoplias malabaricus, Aspistor quadriscutis, Ageneiosus inermis, Plagioscion auratus, and Sciades herzbergii
should not exceed 200 g per week. This is equivalent to a dose of 1.4 µg/kg/week for a 70 kg adult.
In contrast, we identified no health risks regarding the consumption of herbivorous (such as Mugil sp.
(tainha)) and detritivorous species (such as the Hypostomus sp. (acari/cascudo) and Curimata inornata
(branquinha)) in the coastal communities. Moreover, to minimize health risks, Ageneiosus inermis
(mandubé), Boulengerella cuvieri (pirapucu), Cichla monoculus (tucunaré), and Hoplias aimara (traírão)
should only be consumed once a month. Pregnant women should avoid consuming carnivorous fish
and reduce the intake of omnivorous fish during the pregancy.
5. Conclusions
To our knowledge, this is the first study to provide clear recommendations for reducing the
Hg exposure through fish consumption in local communities in the northern Amazon. High levels
of mercury were detected in different fish species in the study area, suggesting a high risk of Hg
contamination in local fish consumers. The highest risk of Hg contamination was observed in children
in the inland zone. To minimize health risks, we proposed a maximum weekly fish intake for different
trophic levels based on both the toxic characteristics of Hg and human susceptibility. We suggestInt. J. Environ. Res. Public Health 2020, 17, 5269 12 of 15
that the consumption of the carnivorous fish species should not exceed 200 g per week, with special
attention to the consumption of mandubé, pirapucu, tucunaré and trairão, that should be consumed
once a month.
The study locations were selected in protected and conserved areas, including Brazil’s largest
natural reserve (Tumucumaque National Park). These regions provide ecosystem services for traditional
communities and maintain their social and cultural values, including the incorporation of fish resources
for human livelihoods.
Due to the persistence of Hg in the environment, legal and illegal ASGM activities in Amapá
continue to impact the health and livelihoods of traditional communities who are dependent on fish as
a primary protein source. This situation has been exacerbated by the global increase in the price of
gold, which has driven the expansion of illegal ASGM activities in the Amazon and further threatens
the environment and the human rights of local communities. This also inhibits the ability of vulnerable
populations to achieve their sustainable development goals.
In this context, it is critical to assess the impacts of Hg contamination on local communities
and their environment. There is a strong need to build scientific evidence that helps to develop
effective mitigation measures and policies to tackle these issues. It is crucial to assess the impact
of mercury contamination on human health at regional scales. Policy makers must also devise and
implement effective mitigation measures to guarantee the food security of indigenous communities;
this includes the proposition of nutritional alternatives and the moderation of fish consumption without
compromising cultural traditions.
Author Contributions: General coordination: M.O.-d.-C.; conceptualization: M.O.-d.-C., C.d.S.G., R.F. and D.Y.;
Field work: C.d.S.G., D.Y. and R.F.; data analysis and method: S.d.S.H., P.C.B. and A.S.; manuscript draft: S.d.S.H.,
M.O.-d.-C., P.C.B. and A.S.; review: S.d.S.H., M.O.-d.-C., C.d.S.G., R.F., P.C.B., A.S. and D.Y. All authors have read
and agreed to the publication of the manuscript.
Funding: This research was funded by the WWF and Iepé with logistical support from Chico Mendes Institute for
Biodiversity Conservation (ICMBio).
Acknowledgments: This research was led by the WWF in close partnership with the Instituto de Pesquisa
e Formação Indígena (Iepé), Fundação Oswaldo Cruz, ICMBio, and the Amapá Institute of Scientific and
Technological Research (IEPA). We thank the researchers, civil society, fishermen, peasants, quilombolas, indigenous
communities, and local and federal institutions who participated in this project. We acknowledge the support
from ICMBio in the design and implementation of field work, particularly Iranildo Coutinho, Ricardo Pires,
and Christoph Jaster. We thank the Amapá Institute of Scientific and Technological Research (IEPA) and the local
inhabitants for their assistance with field work. We also thank Ana Claudia Vasconcellos and André Perisse for
participating in the discussions, preparing the database and visiting the indigenous communities and health
services in Amapá.
Conflicts of Interest: There are no conflict of interest to declare.
References
1. Álvarez-Berríos, N.L.; Aide, T.M. Global demand for gold is another threat for tropical forests. Environ. Res. Lett.
2015, 10, 14006. [CrossRef]
2. Legg, E.D.; Ouboter, P.E.; Wright, M.A.P. Small-Scale gold mining related to mercury contamination in the
Guianas: A review. In Prepared for WWF Guianas; WWF Guianas: Paramaribo, Suriname, 2015. [CrossRef]
3. Rahm, M.; Jullian, B.; Lauger, A.; de Carvalho, R.; Vale, L.; Totaram, J.; Cort, K.A.; Djojodikromo, M.;
Hardjoprajitno, M.; Neri, S.; et al. Monitoring the Impact of Gold Mining on the Forest Cover and Freshwater in the
Guiana Shield; WWF-France: French Guiana, France, 2015; 60p.
4. Dolisca, F. Final Evaluation. Guiana Shield Facility Project; United Nations Development Programme (UNDP)
Guyana Office: Georgetown, Guyana, 2015.
5. Venturieri, R.; Oliveira-Da-Costa, M.; Gama, C.; Jaster, C.B. mercury contamination within protected areas in
the brazilian northern amazon-amapa state. Am. J. Environ. Sci. 2017, 13, 11–21. [CrossRef]
6. UNEP. The Minamata Convention on Mercury and Its Implementation in the Latin America and Caribbean
Region. Report. 2014. Available online: http://mercuryconvention.org/Portals/11/documents/publications/
report_Minamata_LAC_EN_FINAL.pdf (accessed on 17 July 2020).Int. J. Environ. Res. Public Health 2020, 17, 5269 13 of 15
7. Doria, C.R.D.C.; Machado, L.F.; de Souza, S.T.B.; Lima, M.A.L. Fishing in riverside communities in the region
of the middle Madeira River, Rondônia. Novos Cad. NAEA 2016, 19, 163–188. [CrossRef]
8. Barbosa, A.C.; Silva, S.R.L.; Dórea, J.G. Concentration of mercury in hair of indigenous mothers and infants
from the Amazon basin. Arch. Environ. Contam. Toxicol. 1998, 34, 100–105. [CrossRef] [PubMed]
9. Vega, C.M.; Orellana, J.D.Y.; Oliveira, M.W.; Hacon, S.S.; Basta, P.C. Human mercury exposure in yanomami
indigenous villages from the brazilian amazon. Int. J. Environ. Res. Public Health 2018, 15, 1051. [CrossRef]
[PubMed]
10. Martín-Doimeadios, R.R.; Nevado, J.B.; Bernardo, F.G.; Jiménez-Moreno, M.; Arrifano, G.P.F.; Herculano, A.M.;
Nascimento, J.L.M.; Crespo-Lopez, M.E. Comparative study of mercury speciation in commercial fishes of
the Brazilian Amazon. Environ. Sci. Pollut. Res. 2014, 21, 7466–7479. [CrossRef] [PubMed]
11. Santos, E.C.O.; Jesus, I.M.; Brabo, E.S.; Loureiro, E.C.B.; Mascarenhas, A.F.S.; Weirich, J.; Câmara, V.M.;
Cleary, D.; Deoliveirasantos, E.; Britoloureiro, E.; et al. Mercury exposures in riverside Amazon communities
in Pará, Brazil. Environ. Res. 2000, 84, 100–107. [CrossRef]
12. Licona, S.P.V.; Negrete, J.L.M. Mercurio, metilmercurio y otros metales pesados en peces de Colombia: Riesgo
por ingesta. Acta Biológica Colombiana 2019, 24, 232–242. [CrossRef]
13. Organização das Nações Unidas para Agricultura e Alimentação (FAO). The State of Food and Nutritional
Security in Brazil; FAO: Brasília, Brazil, 2015.
14. Ellwanger, J.H.; Kulmann-Leal, B.; Kaminski, V.L.; Valverde-Villegas, J.M.; Da Veiga, A.B.G.; Spilki, F.R.;
Fearnside, P.M.; Caesar, L.; Giatti, L.L.; Wallau, G.L.; et al. Beyond diversity loss and climate change: Impacts of
Amazon deforestation on infectious diseases and public health. Anais Academia Brasileira Ciências 2020, 92, 1.
[CrossRef]
15. Oliveira, M.J. Diagnosis of the Mineral Sector of the State of Amapá; Instituto de Pesquisas Científicas e
Tecnológicas do Estado do Amapá–IEPA: Macapá, Brazil, 2010; p. 148.
16. Instituto Socioambiental-ISA. Indigenous Peoples in Brazil. General Framework of Peoples. 2019. Available
online: https://pib.socioambiental.org/pt/Quadro_Geral_dos_Povos (accessed on 23 March 2020).
17. Tritsch, I.; Marmoex, C.; Davy, D.; Thibaut, B.; Gond, V. Towards a revival of indigenous mobility in French
Guiana? Contemporary transformations of the Wayãpi and Teko Territories. Bull. Lat. Am. Res. 2014, 34,
19–34. [CrossRef]
18. Instituto Brasileiro de Geografia e Estatística (IBGE). Population Estimates. Rio de Janeiro. Available online:
https://cidades.ibge.gov.br/ (accessed on 28 February 2020).
19. Instituto Brasileiro de Geografia e Estatística (IBGE). Family Budget Survey 2008–2009: Anthropometry and
Nutritional Status of Children, Adolescents and Adults in Brazil; IBGE: Rio de Janeiro, Brazil, 2010; 130p.
20. Instituto Brasileiro de Geografia e Estatística (IBGE). Ministry of Planning, Budget and Management. Synopsis of
the Demographic Census 2010; IBGE: Rio de Janeiro, Brazil, 2011; p. 265.
21. Amapá Institute for the Environment and Spatial Planning – IMAP, Indigenous Lands of Amapá. Amapá
State Government. Available online: http://www.imap.ap.gov.br/conteudo/gestao/areas-indigenas (accessed on
17 March 2020).
22. APINA, AWATAC; IEPÉ. Socioenvironmental Management Plan Wajãpi Indigenous Land; Instituto Iepé: Macapá,
Brazil, 2017.
23. U.S. Environmental Protection. Agency EPA-method 1631, Revision E-Mercury in Water by Oxidation, Purge and
Trap and Cold Vapor Atomic Fluorescence Spectrometry; U.S. Environmental Protection Agency: Washington,
WA, USA, 2002.
24. Agency for Toxic Substances and Disease Registry (ATSDR). Toxicological Profile for Mercury; Department of
Health and Human Services, Public Health Service: Atlanta, GA, USA, 1999; p. 617.
25. FAO/WHO. Expert Committee on Food Additives. Sixty-first Meeting. Summary and Conclusions; World Health
Organization: Geneva, Switzerland, 2008.
26. USEPA. Water Quality for the Protection of Human Health: Methylmercury; USEPA, Office of Science and
Technology, Office of Water: Washington, WA, USA, 2002.
27. Cerdeira, R.G.P.; Ruffino, M.L.; Isaac, V.J. Consumo de pescado e outros alimentos pela população ribeirinha
do lago grande de Monte Alegre, PA. Brazil. Acta Amaz. 1997, 27, 213–228. [CrossRef]Int. J. Environ. Res. Public Health 2020, 17, 5269 14 of 15
28. Boischio, A.A.P.; Henshel, D. Fish consumption, fish lore, and mercury pollution—Risk communication for
the Madeira River people. Environ. Res. 2000, 84, 108–126. [CrossRef] [PubMed]
29. Yokoo, E.; Valente, J.; Sichieri, R.; Silva, E. validation and calibration of mercury intake through self-referred
fish consumption in riverine populations in Pantanal Mato-grossense, Brazil. Environ. Res. 2001, 86, 88–93.
[CrossRef] [PubMed]
30. Fréry, N.; Maury-Brachet, R.; Maillot, E.; Deheeger, M.; De Mérona, B.; Boudou, A. Gold-mining activities
and mercury contamination of native amerindian communities in French Guiana: Key role of fish in dietary
uptake. Environ. Health Perspect. 2001, 109, 449–456. [CrossRef]
31. Dórea, J.G.; Barbosa, A.; Ferrari, I.; De Souza, J.R. Mercury in hair and in fish consumed by Riparian women
of the Rio Negro, Amazon, Brazil. Int. J. Environ. Health Res. 2003, 13, 239–248. [CrossRef]
32. Hacon, S.; Rochedo, E.R.; Campos, R.R.; De Lacerda, L.D. Mercury exposure through fish consumption in
the urban area of Alta Floresta in the Amazon Basin. J. Geochem. Explor. 1997, 58, 209–216. [CrossRef]
33. Dórea, J.G.; De Souza, J.R.; Rodrigues, P.; Ferrari, I.; Barbosa, A.C. Hair mercury (signature of fish consumption)
and cardiovascular risk in Munduruku and Kayabi Indians of Amazonia. Environ. Res. 2005, 97, 209–219.
[CrossRef]
34. Passos, C.J.S.; Silva, D.S.; Lemire, M.; Fillion, M.; Guimarães, J.R.D.; Lucotte, M.; Mergler, D. Daily mercury
intake in fish-eating populations in the Brazilian Amazon. J. Expo. Sci. Environ. Epidemiol. 2008, 18, 76–87.
[CrossRef]
35. Oliveira, R.C.; Dórea, J.G.; Bernardi, J.V.E.; Bastos, W.R.; Almeida, R.; Manzatto, A.G. Fish consumption by
traditional subsistence villagers of the Rio Madeira (Amazon): Impact on hair mercury. Ann. Hum. Biol.
2010, 37, 629–642. [CrossRef]
36. Hacon, S.S.; Dórea, J.G.; Fonseca, M.F.; Oliveira, B.A.; Mourão, D.S.; Ruiz, C.M.V.; Gonçalves, R.A.;
Mariani, C.F.; Bastos, W.R. The influence of changes in lifestyle and mercury exposure in riverine populations
of the Madeira River (Amazon Basin) near a hydroelectric project. Int. J. Environ. Res. Public Health 2014, 11,
2437–2455. [CrossRef]
37. Mourão, D.S. Evaluation of Exposure to Mercury in Riverside Communities in Porto Velho. Master’s Thesis,
Escola Nacional de Saúde Pública Sérgio Arouca, Fundação, Oswaldo Cruz, Rio de Janeiro, Brazil, 2016.
38. Mertens, F.; Fillion, M.; Saint-Charles, J.; Mongeau, P.; Távora, R.; Passos, C.J.; Mergler, D. The role of
strong-tie social networks in mediating food security of fish resources by a traditional riverine community in
the Brazilian Amazon. Ecol. Soc. 2015, 20, 18. [CrossRef]
39. Isaac, V.J.; Almeida, M.C. Fish Consumption in the Brazilian Amazon; FAO, COPESCAALC/OP13: Roma, Italy,
2011; p. 54.
40. Faial, K.; Deus, R.; Deus, S.; Neves, R.; Jesus, I.; Santos, E.; Alves, C.N.; Brasil, D. Mercury levels assessment
in hair of riverside inhabitants of the Tapajós River, Pará State, Amazon, Brazil: Fish consumption as a
possible route of exposure. J. Trace Elem. Med. Biol. 2015, 30, 66–76. [CrossRef] [PubMed]
41. Gomes, D.F.; Moreira, R.A.; Sanches, N.A.O.; Vale, C.A.D.; Daam, M.A.; Gorni, G.R.; Bastos, W.R. Dynamics
of (total and methyl) mercury in sediment, fish, and crocodiles in an Amazonian Lake and risk assessment of
fish consumption to the local population. Environ. Monit. Assess. 2020, 192, 101–110. [CrossRef] [PubMed]
42. Wasserman, J.C.; Hacon, S.; Wasserman, M.A. Biogeochemistry of Mercury in the Amazonian Environment.
Ambio J. Hum. Environ. 2003, 32, 336–342. [CrossRef] [PubMed]
43. Miserendino, R.A.; Guimarães, J.R.D.; Schudel, G.; Ghosh, S.; Godoy, J.M.; Silbergeld, E.K.; Lees, P.S.J.;
Bergquist, B.A. Mercury pollution in Amapá, Brazil: Mercury amalgamation in artisanal and small-scale
gold mining or land-cover and land-use changes? ACS Earth Space Chem. 2017, 2, 441–450. [CrossRef]
44. Hacon, S.; Artaxo, P.; Gerab, F.; Yamasoe, M.A.; Campos, R.C.; Conti, L.F.; De Lacerda, L.D. Atmospheric
mercury and trace elements in the region of Alta Floresta in the Amazon Basin. Water Air Soil Pollut. 1995,
80, 273–283. [CrossRef]
45. Davidson, P.W.; Myers, G.J.; Cox, C.; Axtell, C.; Shamlaye, C.; Sloane-Reeves, J.; Cernichiari, E.; Needham, L.;
Choi, A.; Wang, Y.; et al. Effects of prenatal and postnatal methyl mercury exposure from fish consumption
on neurodevelopment: Outcomes at 66 months of age in the Seychelles Child Development Study. JAMA
1998, 280, 701–707. [CrossRef]Int. J. Environ. Res. Public Health 2020, 17, 5269 15 of 15
46. Stern, A.H.; E Smith, A. An assessment of the cord blood:maternal blood methylmercury ratio: Implications
for risk assessment. Environ. Health Perspect. 2003, 111, 1465–1470. [CrossRef]
47. Oken, E.; Wright, R.O.; Kleinman, K.; Bellinger, D.; Amarasiriwardena, C.J.; Hu, H.; Rich-Edwards, J.W.;
Gillman, M.W. Maternal Fish Consumption, Hair Mercury, and Infant Cognition in a U.S. Cohort.
Environ. Health Perspect. 2005, 113, 1376–1380. [CrossRef]
© 2020 by the authors. Licensee MDPI, Basel, Switzerland. This article is an open access
article distributed under the terms and conditions of the Creative Commons Attribution
(CC BY) license (http://creativecommons.org/licenses/by/4.0/).You can also read