Michigan Upper Peninsula Housing Baseline Study - June 15, 2021
←
→
Page content transcription
If your browser does not render page correctly, please read the page content below
Michigan Upper Peninsula Housing Baseline Study
June 15, 2021
AGENDA                                  PRESENTERS

Introduction                            •   Sean Williams
                                        •   Dan Groshans
Methodology
                                        •   Michael Logsdon
Summary of Results
• Descriptive Characteristics Example
• Representativeness of Sample
• General Comments on Building Stock
• Vintage Analysis
Conclusions

                                                   © CLEAResult. All rights reserved. 2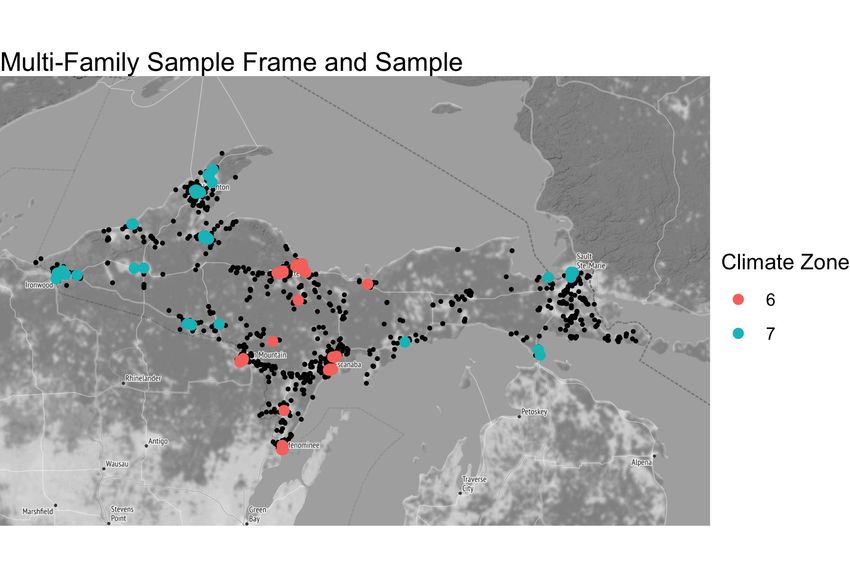
Introduction
            Characteristic                                 Research Objective

      Home Vintage             Gather descriptive data regarding home vintage

      Equipment Efficiency     Identify the typical equipment efficiency levels in residential homes

                               Illustrate the average building envelope characteristics for residential
      Building Envelope
                               dwellings in the Upper Peninsula

      Building Type            Include representative samples of single family and multi-family dwellings

 •   The baseline efficiency of existing homes is the foundation for the deemed energy
     savings calculations in the Michigan Energy Measures Database (MEMD).

 •   The overall objective of the study is to collect descriptive characteristics that will
     inform the assumed baseline and energy savings calculations.

                                                                                                  © CLEAResult. All rights reserved. 3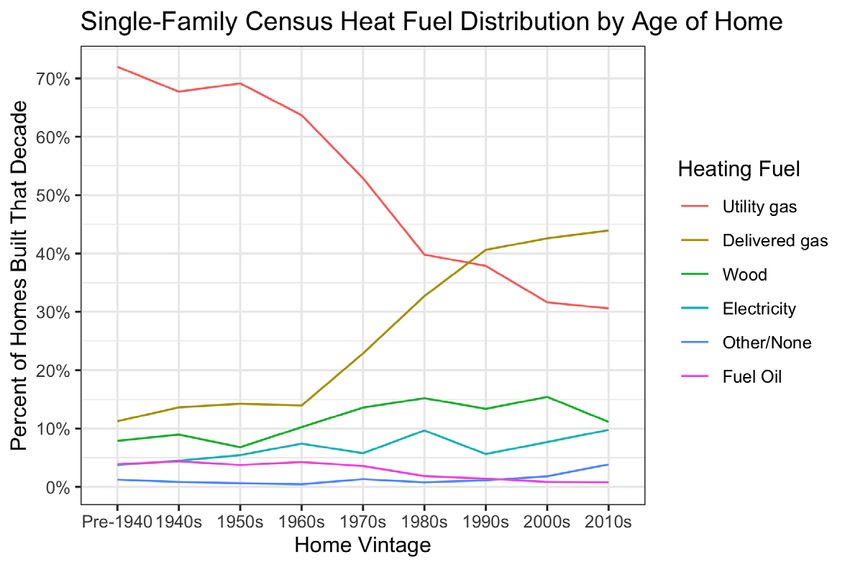
Sampling Plan

                                      Segment
     Weather Zone     Building Type             Total Sample
                                      Sample
                      Single Family     70
     Weather Zone 6                                 140
                       Multi-Family     70

                      Single Family     70
     Weather Zone 7                                 140
                       Multi-Family     70

                                                    © CLEAResult. All rights reserved. 4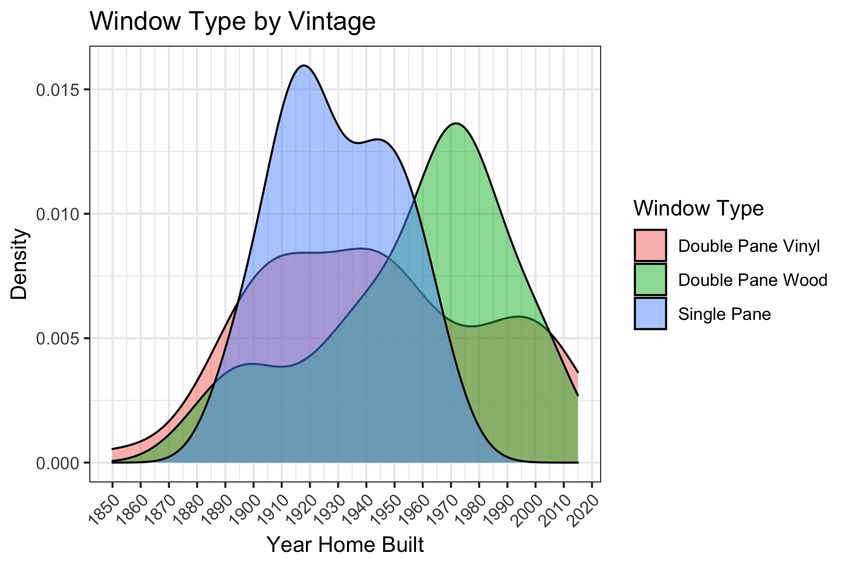
Methodology

    • Obtain a UP residential dataset to be the sample frame
    • Experian Consumer Marketing Database

    • Prepare a direct mail instrument to recruit study participants
    • Offer incentive for telephone survey / virtual audit

    • Select random addresses from the residential dataset to promote the offer
    • Mail postcard to random sample of population

    • Conduct virtual audit
    • Technician led telephone call or Streem virtual audit (with video feed)

                                                                         © CLEAResult. All rights reserved. 5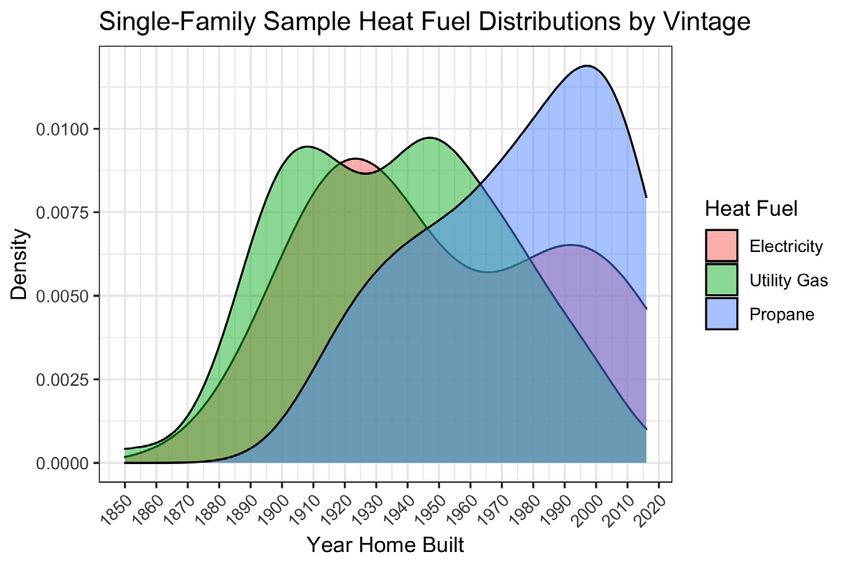
Direct Mail Instrument

                         © CLEAResult. All rights reserved. 6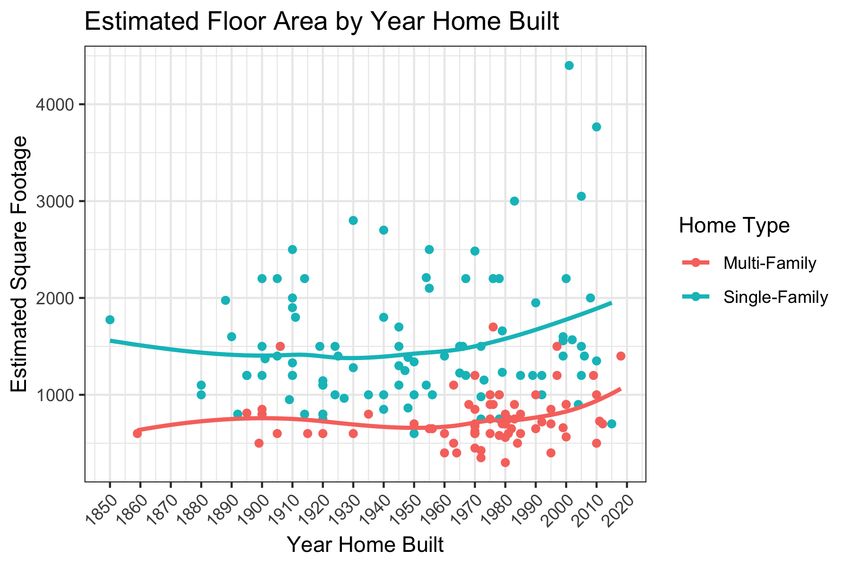
Completed Surveys
               Weather Zone              Building Type     Target Sample   Actual Sample

                                         Single Family          70              75
               Weather Zone 6            Manufactured                           11
                                          Multi-Family          70              72
                                         Single Family          70              70
               Weather Zone 7            Manufactured                           24
                                          Multi-Family          70              61
                                              Total             280            313

 •   Experian data does not differentiate between site-built and manufactured homes
     •   We collected data when manufactured home residents responded
 •   Participants strongly preferred telephone calls over Streem video calls
     •   Only 5 video audits were completed

                                                                                     © CLEAResult. All rights reserved. 7
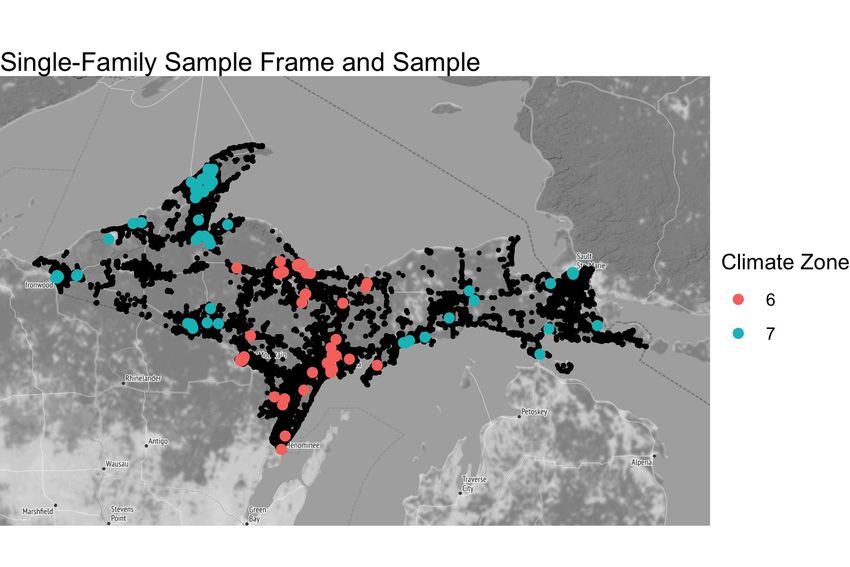
Sample Frame and Sample
Mapped

                          © CLEAResult. All rights reserved. 8
Descriptive Characteristic Example: Heat Type

• Typical summary in report by climate zone and building type

                       Heat Type                                                  Heat Type
                      Single Family                                              Multi-Family
 60                  54                                     30
                                                                                                          26
 50                                                         25
                41                                               22                                  22
                                                                      20        20
 40                                                         20
                                                                           15
 30                                                         15
      19
 20                                                         10
           11
                                        7              7                                                                      5
 10                                                3        5
                                 1          2                                           1   1                           2
  0                                                         0
      Boiler    Furnace    Heat Pump Resistance   Unknown        Boiler    Furnace    Heat Pump    Resistance         Unknown

                          CZ 6   CZ 7                                                CZ 6   CZ 7

                                                                                                     © CLEAResult. All rights reserved. 9
Representativeness of Sample
• Study distributions were compared to US Census* distributions for five attributes
• Year built
• Primary / Secondary home
• Heating fuel
• Household income
• Owner / Renter status
• Note: ACS categories align to decade boundaries. Comparisons use slightly modified bins
Cadmus Proposed Bins Bins Used for Comparisons
Through 1978 Through 1979
1979-1997 1980-1999
1998-2015 2000-2015
2016-current 2016-current
* 2015-2019 ACS 5-year Public Use Microdata Sample
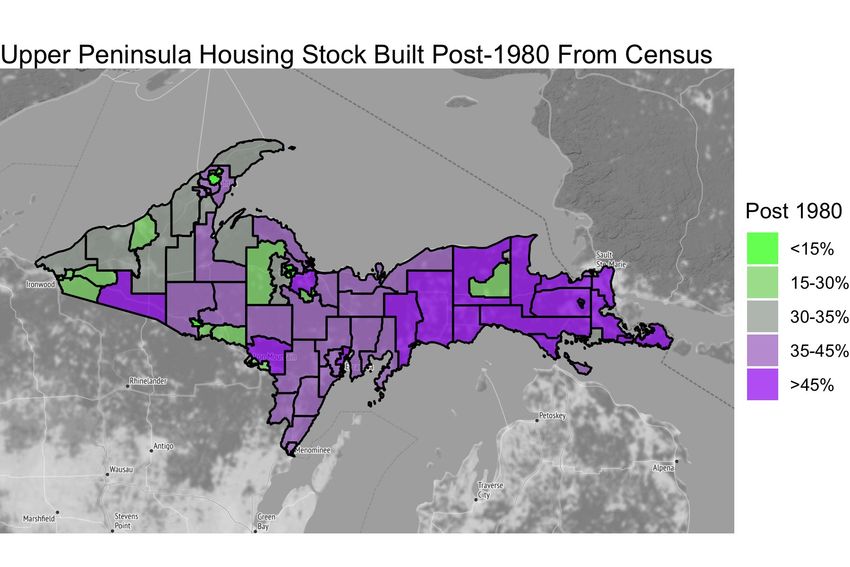
© CLEAResult. All rights reserved. 10General Comments on Building Stock
© CLEAResult. All rights reserved. 11Representativeness of Sample
Single-Family Multi-Family
• Vintage distribution Vintage Bin Sample Census Sample Census
• Single family sample has more older Through 1979 81% 66% 58% 65%
homes than Census 1980-1999 9% 22% 30% 23%
• Multi-family sample is closer 2000-2015 10% 11% 9% 12%
2016-current 1%Representativeness of Sample
Heating Fuel Single-Family Multi-Family
Sample Census Sample* Census
Utility Gas 76% 56% 57% 58%
Delivered Gas 14% 23% 0% 2%
Wood 0% 11% 0%Income Distribution, Single Family
Representativeness of Sample
Income Distribution ACS
Sample Frame
Sample
• Skew towards lower income is
0% 20% 40% 60% 80% 100%
expected with a cash incentive Less than $14,999 $15,000 to 24,999 $25,000 to $34,999
• Census data shows households $35,000 to $49,999 $50,000 to $74,999 $75,000 to $99,999
with higher incomes tend to live in $100,000 to $149,999 Greater than $150,000
newer homes
Income Distribution, Multi-Family
• May explain additional homes in the
oldest vintage bin ACS
Sample Frame
Sample
0% 20% 40% 60% 80% 100%
Less than $14,999 $15,000 to 24,999 $25,000 to $34,999
$35,000 to $49,999 $50,000 to $74,999 $75,000 to $99,999
$100,000 to $149,999 Greater than $150,000
© CLEAResult. All rights reserved. 14Vintage Analysis
• Is there evidence for UP-specific vintage bin boundaries or weighting?
• Remote audits limited data collection on envelope R-values, heat loss, etc.
• 81% of sample fell into oldest (pre 1979) vintage bin. Remaining sample is too small to
verify boundaries of the three more recent (proposed) bins.
• Analyses focused on attributes relevant to construction / weighting of prototypes
• A detailed look at heat fuel by vintage: comparison of Census to the sample
• Exploratory analysis of other attributes
© CLEAResult. All rights reserved. 15Vintage Analysis, Heat Fuel
• Proportion of utility gas declined starting in the
1960s
• Notable switch to propane gas spanning the
1970s to the 1990s.
• In the newest homes, propane is more common
than utility natural gas.
• DHW fuel showed a similar pattern--increased
propane for the newest homes--with a larger
share of electricity
• Heat fuel mix has been changing since the
1960s; No specific shift ~1980
© CLEAResult. All rights reserved. 16Vintage Analysis
• Why do newer homes have the most
delivered fuel?
• Timing and location of new construction
• More developed areas such as Houghton,
Iron Mountain, Ishpeming have more of the
oldest homes with most on natural gas
• Post-1980 development is more dispersed
and in areas that may not have utility gas
© CLEAResult. All rights reserved. 17Year Double Pane Double Pane Single Pane
Total
Built Vinyl Wood Wood
Vintage Analysis, Window Type
Pre-1940 29 11 14 57
1940s 12 1 2 15
1950s 1 3 3 7
1960s 2 6 1 10
1970s 4 7 0 11
1980s 2 2 0 4
1990s 6 2 0 8
2000s 5 3 0 10
• Transition to all double pane windows 2010s 1 0 0 2
Total 62 35 20 124
appears to have happened around 1960
• Crossover from single pane to double
pane wood around 1960.
© CLEAResult. All rights reserved. 18Added Insulation No Yes Percent Yes
Vintage Analysis Pre-1940
1940s
8
2
43
12
84%
86%
Added Insulation, Floor Area 1950s 2 5 71%
1960s 2 6 75%
• Survey: Has insulation been added to attic, walls, 1970s 2 8 80%
1980s 3 1 25%
or floor?
1990s 7 1 13%
• Table includes results for single family homes. 2000s 6 3 33%
• Supports 1980 as a boundary for changes in shell 2010s 0 1 -
characteristics for single family homes Total 32 80 71%
• Built before 1980, 80% of such homes now have some kind
of added insulation
• Built after 1980, only 27% have added insulation
• Average home size has increased since 1980 for
both single family and multi-family homes
© CLEAResult. All rights reserved. 19Conclusions
• The housing stock of the UP features a high prevalence of older homes,
seasonally occupied homes, and delivered fuels.
• The multi-family housing sample resembled the overall building stock reasonably well.
• The single-family housing sample appeared to have been skewed towards older homes
and utility gas.
• In both segments the occupants reported lower incomes on average than suggested by
the Census for comparable dwellings.
• The offer of a cash incentive and use of Experian data for a sample frame
created a bias for lower income households in relatively more urbanized settings
• Larger deviations were observed for single family than for multi-family
• The sample frame did not include most seasonal homes;
October through February recruitment further reduced the response
© CLEAResult. All rights reserved. 20Conclusions, continued
• In terms of vintage bin boundaries or weighting
• Due to the age of the housing stock and the older skew of the sample, these data say very
little about potential adjustments to the three post-1979 vintage bins.
• In terms of the oldest vintage bin, even if the overall weighting may be similar between
peninsulas, the UP contains a larger share of the oldest, pre-WWII homes. This could be
considered in the development of prototypes.
• Although a video audit and a telephone audit were both offered, the vast majority
of participants opted for the phone audit,
• It should be noted going forward that the UP population was in general not amenable to
remote video interactions via smartphone
© CLEAResult. All rights reserved. 21Conclusions
• The survey did not ask about a secondary heat source. This may have
contributed to the alleged lack of wood heat among the sampled homes.
• Any subsequent effort would benefit from the inclusion of a survey question on secondary
heat sources.
• In terms of recruitment success, the mailers achieved a 1.3% response rate for
single-family (including manufactured who responded) and 0.4% for multifamily.
• Any future efforts in the region can use estimated response rates around 1% for the
purposes of planning and budgeting (higher for single-family, lower for multi-family).
• Recruitment of multi-family was more difficult and necessitated repeated mailers to the
same addresses.
© CLEAResult. All rights reserved. 22You can also read