Mortality in Switzerland 2020-2021 - Serval
←
→
Page content transcription
If your browser does not render page correctly, please read the page content below

Mortality in Switzerland 2020-2021
Isabella Locatelli & Valentin Rousson

Center for Primary Care and Public Health (Unisanté), University of Lausanne, Switzerland
Département de Formation, Recherche et Innovation – DFRI, Secteur Recherche Quantitative (Biostatistique)

September 2021

Abstract
In this report, we update previously published results on all- Introduction
cause mortality in Switzerland in 2020 and extend them to the
first half of 2021. Whereas mortality in Switzerland increased
 The year 2020 was marked by the global spread of the
by 9.2% in 2020 compared with 2019 as a result of the first two COVID-19 pandemic caused by severe acute respiratory
waves of COVID-19, it decreased by about 10.8 % in the first syndrome coronavirus 2 (SARS-CoV-2). The impact of the
half of 2021 compared with 2020, bringing the level of mortality pandemic on all-cause mortality has begun to be studied
in 2021 below that of 2019. In terms of life expectancy, we have worldwide [1-5], with the difficulty that it usually takes
gained about 3.1 months so far in 2021 in Switzerland several months (or years) to obtain complete and
compared to 2019, 6.0 months for women and 0.3 months for consolidated statistics on deaths in a country.
men. By mid-2021, women have therefore more than
recovered the secular downward trend in mortality, i.e. an An early assessment of excess mortality in Switzerland in
increase in life expectancy of about 2 months each year, while 2020 can be found in Locatelli and Rousson [6] (fully
men are still slightly behind. A look at the weekly mortality published on June 17, 2021). Based on provisional data
data reveals that mortality levels in 2021 were consistently collected until May 19, 2021 from the Swiss FSO (Federal
lower than those observed in previous years, with the
 Statistical Office), they estimated in 2020 an increase in
exception of the first 4-6 weeks of 2021, corresponding to the
end of the second wave of COVID-19. Notably, 2021 is the standardized mortality rates of 8.8% compared with 2019,
second consecutive year without a visible impact of influenza with significant excess mortality (only) for men over 70 and
on mortality in Switzerland, and there was no third wave of for women over 75. The estimated decrease in life
mortality related to COVID-19. Therefore, 2021 is so far the expectancy at birth in 2020 was 0.7%, with a loss of 9.7
best year ever regarding mortality in Switzerland. months for men and 5.3 months for women with respect to
 the previous year.
Résumé A few months later, these results can be updated using the
 completed death data now available for 2020, and
Dans ce rapport, nous mettons à jour les résultats précédemment
publiés sur la mortalité toutes causes confondues en Suisse en 2020 extended using the (provisional) death data for the first half
et les étendons au premier semestre 2021. Alors que la mortalité en of 2021. The purpose of this report is therefore two-fold.
Suisse a augmenté de 9,2 % en 2020 par rapport à 2019 suite aux First, to update the results published in [6]. Second, to
deux premières vagues de COVID-19, elle a diminué d'environ 10,8 provide an early analysis of the mortality in Switzerland in
% au premier semestre 2021 par rapport à 2020, ramenant le niveau the first half of 2021. While recognizing that semiannual
de mortalité en 2021 en dessous de celui de 2019. En termes analyses are not common in demography, and that death
d'espérance de vie, nous avons gagné en Suisse environ 3,1 mois statistics for the first half of the current year are still
jusqu'à présent en 2021 par rapport à 2019, 6,0 mois pour les provisional (because some deaths are reported with delay),
femmes et 0,3 mois pour les hommes. À la mi-2021, les femmes ont
 we believe that such an early analysis is interesting and
donc plus que récupéré la tendance séculaire à la baisse de la
mortalité, soit une augmentation de l'espérance de vie d'environ 2 useful to judge and follow the situation during the ongoing
mois chaque année, alors que les hommes sont encore légèrement pandemic.
en retard. Une analyse des données hebdomadaires de mortalité
révèle que les niveaux de mortalité en 2021 étaient
systématiquement inférieurs à ceux observés les années
précédentes, à l'exception des 4 à 6 premières semaines de 2021,
 Data
correspondant à la fin de la deuxième vague de COVID-19. En
 We used official data on deaths in Switzerland published by
particulier, 2021 est la deuxième année consécutive sans impact
 the Swiss FSO for 2000-2020 and the first six months (26
visible de la grippe sur la mortalité en Suisse, et nous n’avons pas
observé de troisième vague de mortalité liée au COVID-19. Par weeks) of 2021 (last access September 28, 2021). The
conséquent, 2021 est jusqu'à présent la meilleure année jamais annual number of deaths, separately for men and women,
enregistrée en matière de mortalité en Suisse. was available by 1-year age groups (with a last open class of

 Les Essentiels 35 1

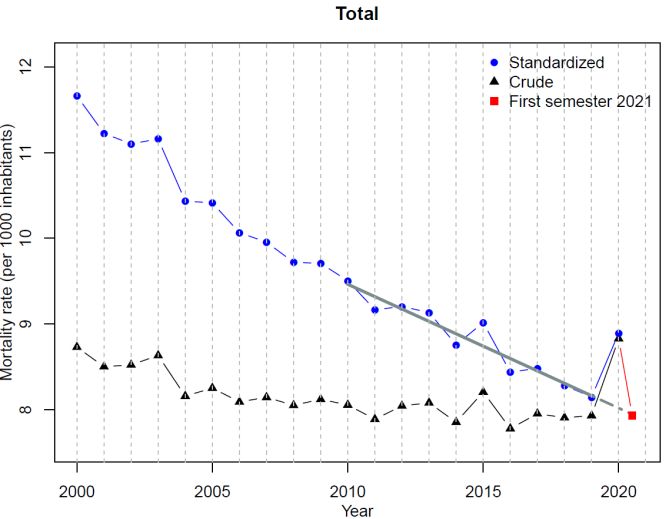
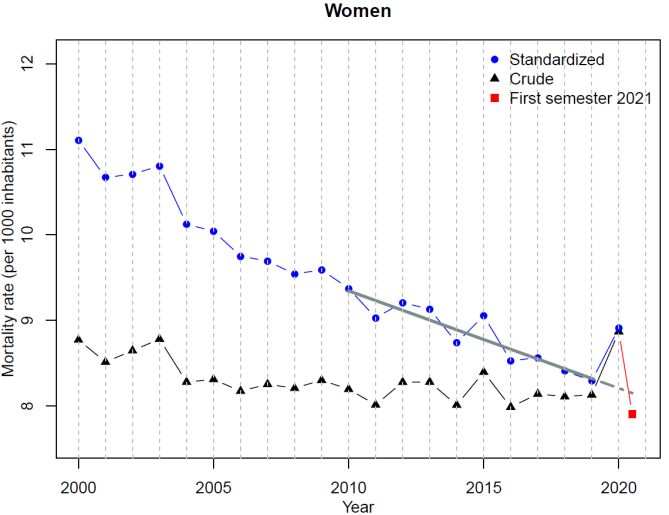
Figure 1. Standardized Weekly Deaths 2015-2021 (data: FSO)

110+) until year 2020a. On the other hand, it was available first one “replacing” the usual wave of influenza, the second
by 5-years age groups (with a last open class of 90+) for one (much higher and broader than the first) ending during
each of the first 26 weeks of 2021b. To facilitate the first 4-6 weeks of 2021. With the exception of these
comparisons, we excluded 1/366 of deaths in the case of initial weeks, the first half of 2021 was characterized by
leap years (including 2020). Weekly death data were also lower levels of mortality than in the corresponding period
available for years 2015-2020 with a partition in 5 large age of the 6 previous years. In particular, neither an episode of
classes (0-19, 20-39, 40-64, 65-79, 80+)c. flu nor a third wave of COVID-19 was observed.

The size of the Swiss population as of January 1, 2011-2021, Figure 2 shows the Standardized Mortality Rates (SMR, see
stratified by sex and one-year age groups (with a last open Methodological Appendix) in Switzerland calculated for the
class of 105+) was found in the FSO databased. The size of years 2000-2020 and for the first half of 2021 (overall and
the Swiss population as of January 1, 2000-2019, stratified stratified by sex). Crude mortality rates (number of deaths
by sex and one-year age groups (with a last open class of divided by the total population in a given year) are plotted
110+), was (also) found in the Human Mortality Database for comparison. We also added to each graph an estimated
(HMD)e. Since the difference for the overlapping years were trend based on the SMR of the pre-pandemic decade 2010-
negligible, we used HMD source for the years 2000-2010 2019, as explained in the Methodological Appendix. As
and FSO source for the years 2011-2021. Life expectancy already discussed in [6], and contrary to the crude mortality
for both sexes was also available in the HMD database for rates, the standardized mortality rates declined sharply
the period 1900-2018. over the past 20 years. In 2020, the SMR for both sexes was
 higher than in previous years, returning to the level of
 about 5 years earlier. However, and this is a new result, the
Results SMR in the first half of 2021 was lower than in 2020 and all
 previous years (including 2019), falling just below the
Figure 1 shows the Standardized Weekly Deaths (SWD, see projected trend for mid-2021. Similar conclusions can be
Methodological Appendix) for the years 2015-2020 and for drawn by analyzing men and women separately, although
the first 26 weeks of the year 2021, reflecting the weekly the SMR for men was still above the trend in the first half of
deaths that would have occurred each year if the weekly 2021, whereas it was below the trend for women.
age-specific rates observed in that year were applied to the
 Table 1 shows the relative changes in SMR, comparing
size and age distribution of a reference population
 2021, 2020 and 2019. Mortality in 2020 increased by 9.2%
(reference = January 1, 2021). We recognize the waves due
 compared with 2019, this relative difference being greater
to influenza each year until 2019 (except 2016, a year
 for men (11.0%) than for women (7.4%). On the other hand,
spared by the flu) and the two COVID-19 waves of 2020, the
 the SMR for the first half of 2021 decreased by 10.8%

 Les Essentiels 35 2

(10.3% for men and 11.3% for women) compared with the SMR
SMR for 2020, being thus 2.7% lower than in 2019, and just Total Men Women
below the projected trend for mid-2021 (-0.2%).
 % % %
Consistently with Figure 2, the relative difference from the
 2020 vs 2019 +9.2 +11.0 +7.4
trend was positive for men (+2.9%) and negative for
women (-3.0%). mid-2021 vs 2019 -2.7 -0.5 -4.7
 mid-2021 vs 2020 -10.8 -10.3 -11.3
 mid-2021 vs trend -0.2 +2.9 -3.0

 Table 1: Relative changes in Standardized Mortality Rates (SMR)

 Figure 3 shows life expectancy at birth in Switzerland for
 the years 1900-2020 and the first half of 2021, separately
 for men and women (see Methodological Appendix). We
 retrieve the spectacular increase in life expectancy during
 period 1900-2019 (from 46 to 81.9 years for men and from
 49 to 85.6 years for women) with the impressive drop due
 to the Spanish flu in 1918, a loss of life expectancy of more
 than 8 years for women and more than 10 years for men.
 Considering the decade 2010-2019, we estimated an
 increasing linear trend of around 2.5 months per year for
 men and 1.6 months per year for women.

 Table 2 shows the relative changes in life expectancy,
 comparing 2021, 2020 and 2019. Compared to 2019, life
 expectancy decreased in 2020 by 1% (10.1 months) for men
 and 0.6% (5.8 months) for women. However, as for
 standardized mortality rates, life expectancy resumed its
 upward trend in the first half of 2021, remaining stilly below
 the trend for men (-0.3%, -3.0 months) but appearing
 above the trend for women (+0.3%, +3.6 months).

 Discussion
 In this report, we updated the results obtained in Locatelli
 and Rousson [6], "A first analysis of excess mortality in
 Switzerland in 2020", using the consolidated FSO death
 data. We estimate now the excess mortality in 2020
 compared to 2019 at +9.2% (instead of +8.8%), +11.0% for
 men and +7.4% for women, and the loss in life expectancy
 between 2019 and 2020 at -7.9 months (instead of -7.5
 months), -10.1 months for men and -5.8 months for
 women. All these results remain close to what has been
 published in [6].

 As we now dispose of provisional data on deaths for the
 first six months (first 26 weeks) of 2021, we could also
 estimate the semiannual standardized mortality rate and
 the corresponding life expectancy at birth for the first half
 of 2021. These data could be compared with the
 standardized mortality rates and life expectancies of 2020,
 2019, and with the projected trends for mid-2021.

 According to our estimates, the SMR of mid-2021 has
 decreased by 10.8% and life expectancy at birth have
 increased by 1.1% (11.2 months) compared to 2020. As a
 result, both seem to have already recovered the pre-
 pandemic trend lost in 2020. When stratifying by sex, we
 found that women have actually more than retrieved the
Figure 2: Mortality rates 2000-21 overall and by sex (data: FSO)
 previous tendency, while men are still slightly below. These
 results are at least partly due to the fact that, apart from

 Les Essentiels 35 3
the first 4-6 weeks of the year, characterized by the ending pandemic situation, our estimates of the standardized
of the second wave of COVID-19, the first half of 2021 has mortality rate and life expectancy at mid-2021 are not
been free of influenza. However, the standardized weekly intended to be a prediction of what will be observed at the
deaths for the first semester 2021 appear uniformly lower end of the year. This analysis is just a useful indication that
than those of previous years, also after the winter, outside 2021 has so far been a good year (in fact the best year ever)
the usual periods of influenza. Furthermore, contrary to the for mortality in Switzerland, perfectly in line with the
first and second waves, the third wave of COVID-19 cases continuous progress of humanity in this regard.
registered in Switzerland during the months of March and
April 2021 had no visible impact on all-cause mortality.

This analysis is still a preliminary one and requires some
caution and clarifications. First, the deaths reported up to
week 26 of 2021 are provisional, as part of the deaths are
recorded with delay. However, three months after the last
week considered (the 26th), the number of deaths recorded
up to this week is not far from having stabilized, as we could
verify by repeating the analysis for the last weeks. Second,
when we compare the standardized mortality rate and the
life expectancy of the first semester 2021 with that of
previous years and with the projected trend, we implicitly
rely on the fact that a “typical” first semester contains
around half of the year's deaths. This assumption is
however in line with what has been observed during the last
few years, where consistently slightly more deaths
occurred in the first than in the second semester, which
makes our comparison with the trend slightly conservative.
The single exception was of course 2020, where more
deaths occurred during the second part of the year due to
the second wave of COVID-19. Therefore, in an ongoing Figure 3: Life expectancy at birth 1900-2021 (data: SFO/HMD)

 Life Expectancy
 Total Men Women
 % Months % Months % Months
 2020 vs 2019 -0.8 -7.9 -1.0 -10.1 -0.6 -5.8
 mid-2021 vs 2019 +0.3 +3.1 +0.0 +0.3 +0.6 +6.0
 mid-2021 vs 2020 +1.1 +11.2 +1.1 +10.4 +1.2 +11.8
 mid-2021 vs trend +0.0 +0.3 -0.3 -3.0 +0.3 +3.6

Table 2: Relative changes in life expectancy at birth

 deaths 2021, = ∑5 =1 2021, that year, that is ̇ 2021, =
Methodological Appendix 2021, ( = 1,…,26).
In order to compare the number of weekly deaths across years
 To compare mortality in the first half of 2021 with that of previous
while accounting for the increase and aging of the population,
 years we used (one-year of) age and sex Standardized Mortality
weekly deaths series for years 2015-2020 and first half of 2021
 Rates (SMR), considering population as of January 1, 2021 as the
were standardized using the 5 available age classes (0-19, 20-39,
 , standard. The SMRs for years ( =2000,…,2020), , are
40-64, 65-79, 80+). Standardized Weekly Deaths (SWD) ̇ ( =
 obtained as follows:
2015,…,2020 ; = 1,…,52) are obtained as:
 100+ 2
 5 ,

 , = ∑ ∑
 ̇ = ∑ ∙
 =0 =1
 =1

 , In this formula and are annual deaths and population size
In this formula represents the number of observed deaths for
year ( = 2015-2020), week ( = 1,…,52) and age class ( = (as of January 1) in year ( = 2000,…,2020) for age ( =

1, … ,5), is the population of age class as of January 1 of year 0,1,…99,100+) and sex ( =1 for men and =2 for women), while
 is the population of age and sex as of January 1 of the
 , and is the reference year. Of note, by choosing the year 2021
as the reference year ( =2021), the standardized weekly deaths reference year ( =2021), and the total population as of
for (the first 26 weeks of) 2021 coincide with the observed weekly January 1 of the same year: = ∑100+ 2
 =0 ∑ =1 .

 Les Essentiels 35 4
The SMR for the first half of the reference year =2021 expectancies at birth 0 ( = 1,2) for years = 2010-2019 via linear
corresponds to the crude mortality rate for the same period, i.e: regression:
 −2021
 0 = + = 2010, … ,2019 ; = 1,2
 −2021 =
 0.5 ∙
 We then compared (via a relative and absolute difference) the
In this formula −2021 represents the number of deaths −2021
 estimated life expectancies of the first half 2021, 0 ( =
observed during the first 26 weeks of 2021. As usual for a crude
 1,2) , with the ones predicted according to the trend for the
mortality rate, the denominator is expressed in person-years.
Since only six months are considered here, the size of the
 − 2021
 middle of 2021: ̂0 = ̂ + ̂ ∙ 2020.5, = 1,2.
population in the denominator had thus to be multiplied by 0.5.
Note that we are updating the results of [6] with a slightly
different standardization, using 2021 instead of 2020 as the References
reference year, in order to be able to include the year 2021 for
which we have broader age classes. This had however almost no 1. Woolf S, Chapman D, Salbo R, Weinberger D, Hill L (2021). Excess
impact on the results, as such comparisons do not depend much deaths from COVID-19 and other causes in the US, March 1, 2020,
of the reference year chosen [7]. to January 2, 2021. JAMA. Epub ahead of print.
 2. Ahmad F, Cisewski J, Minino A, Anderson R (2021). Provisional
In order to update results of [6], we compared 2020 with 2019 mortality data – United States, 2020. Morbidity and Mortality
via a relative change in SMR (expressed in %) calculated as Weekly Report, 70, 519-522.
100( 2020 − 2019 )/ 2019 . We did the same comparison for
 3. Andrasafay T & Goldman N (2021). Reduction in 2020 US life
the first half of 2021 using 100( −2021 − )/ and = expectancy due to COVID-19 and the disproportionate impact on
2019, 2020. In addition, to account for the expected reduction of the Black and Latino populations. PNAS, 118, e2014746118.
mortality along the years, which reflects the undeniable and
remarkable human progress in this regard, we estimated a linear 4. Heuveline P & Tzen M (2021). Beyond deaths per capita:
 comparative COVID-19 mortality indicators. BMJ Open, 11,
trend on the standardized mortality rates based on 10 years
 e042934.
before pandemic = 2010-2019 using linear regression:
 5. Aburto JM, Schöley J, Kashnitsky I, Zhang L, Rahal C, Missov TI,

 = + = 2010, … ,2019 Mills MC, Dowd JB, Kashyap R (2021). Quantifying impacts of the
 COVID-19 pandemic through life-expectancy losses: a population-
We then compared the observed SMR for the first half of 2021 level study of 29 countries. International Journal of Epidemiology.
with the one predicted according to this trend for the middle of doi: 10.1093/ije/dyab207. Epub ahead of print.
2021, ̂ −2021 = ̂ + ̂ ∙ 2020.5, via the relative difference: 6. Locatelli I & Rousson V (2021). A first analysis of excess mortality
100( −2021
 − ̂ −2021 ( ̂ and ̂ are estimated
 ̂ −2021 )/ in Switzerland in 2020. Plos One.
regression parameters). Predicting the SMR for the middle of a https://doi.org/10.1371/journal.pone.0253505
year, in our case 2021, from data on previous annual SMRs can be 7. Spiegelman M & Marks HH (1966). Empirical testing of standards
justified by the fact that the number of deaths in the first half of a for the age adjustment of death rates by the direct method.
year roughly corresponds (on average) to the number of deaths in Human Biology, 38, 280-292
the second half of the year. For example, considering the years
 8. Friedman M (1982). Piecewise exponential models for survival data
2015 to 2019, the percentage of annual deaths observed in the
 with covariates. Annals of Statistics, 10, 101-113.
first half of the year ranged from 50.2% in 2016 to 52.9% in 2015
(while it was 47.6% in 2020 due to the second wave of COVID-19).
This means that our predicted SMR for the first half of 2021 might
be indeed slightly too optimistic, our analysis being conservative
on this point. Data references
In order to give more weight to the deaths of young people ahttps://www.bfs.admin.ch/bfs/fr/home/statistiques/population/naissanc

compared to the deaths of older people (while not needing to es-deces/deces.assetdetail.17444232.html
define a reference year), an alternative way to express mortality bhttps://www.bfs.admin.ch/bfs/fr/home/statistiques/population/naissanc

in a given year and for a given sex is to calculate the Life es-deces/deces.assetdetail.19104012.html

expectancy at birth 0 obtained from the age and sex specific chttps://www.bfs.admin.ch/bfs/fr/home/statistiques/population/naissanc

mortality rates observed in that year. Using the same method [8] es-deces/deces.assetdetail.19104010.html
detailed in [6], and based on age stratification into 5-years age dhttps://www.bfs.admin.ch/bfs/fr/home/statistiques/population/effectif-

classes (last open class 90+), the one for which deaths were evolution/age-etat-civil-nationalite.assetdetail.18344199.html
available for 2021, we updated the calculation of life expectancy e https://www.mortality.org/cgi-bin/hmd/country.php?cntr=CHE&level=1
 2020
for 2020, 0 ( = 1 for men and 2 for women) published in [6].
We could similarly calculate men and women life expectancy for
 −2021
the first half of 2021, 0 . Other estimations of life
 Suggested citation
expectancies are taken from [6] for 1970 - 2019 and from the HMD
database for 1900 - 1969. As in [6] and with the same aim of Locatelli I, Rousson V. Mortality in Switzerland 2020-2021. Center for
 2020 2019
updating their results, we compared 0 with 0 either via a Primary Care and Public Health (Unisanté), University of Lausanne,
 2020 2019 2019 Lausanne, 2021 (Raisons de Santé: Les Essentiels 35)
relative change (expressed in %), 100( 0 − 0 )/ 0 , or
 2020
via an absolute change (expressed in months), 12( 0 − 0 ). 2019 https://doi.org/10.16908/rds-essentiels/35
A similar comparison was performed for the first half of 2021 via
 − 2021 − 2021
100( 0 − 0 )/ 0 and 12( 0 − 0 ) with =
2019, 2020. As for the SMRs, and using a similar justification, we
also estimated a linear trend by fitting the men and women life

 Les Essentiels 35 5
You can also read