MYMATHLAB EFFECTIVENESS IN COLLEGE ALGEBRA
←
→
Page content transcription
If your browser does not render page correctly, please read the page content below
Academic Forum 30 2012-13

Systems Management. Currently, he teaches Radio and Television production courses at
Henderson State University and completed an M.F.A. in Digital Filmmaking from the
University of Central Arkansas in 2011. He has produced several documentaries for the Hot
Springs Documentary Film Festival and directed a short narrative, “On My Trail”, about blues
musician Robert Johnson.

                   MyMathLab Effectiveness in College Algebra
                                   Michael Lloyd, Ph.D.
                     Professor of Mathematics and Computer Science

Abstract

A study from the fall of 2012 at Henderson State University provided evidence that students
using MyMathLab in College Algebra did slightly better, on average, than those who did not.
Also, the conversion of all the sections to MyMathLab for subsequent semesters will be
discussed.

Introduction

Approximately 55% of Henderson State University (HSU) students who enroll in College
Algebra finish with a grade of A, B, or C [1], which is within the range of success rates
nationwide, typically 40-60%. [2] The HSU mathematics and computer science department
adheres to state and national standards for College Algebra. This course is challenging because
we adhere to the Arkansas Higher Education Coordinating Board policies, [4] which requires
that the following topics must be covered in College Algebra:

1. Quadratic equations and inequalities with applications.
2. Polynomial rational, exponential, logarithmic functions, graphing functions, combining
   functions, inverse functions solving problems whose mathematical models are polynomial,
   exponential and logarithmic functions. Finding zeros of polynomial and rational functions
   including the use of methods of approximation.
3. Solving systems of linear equations, including solution by matrix methods and
   determinants. Systems of linear inequalities; applications of both systems of equations and
   systems of linear inequalities. Systems of non-linear equations. [4]

We teach row-reduction, in College Algebra, instead of determinants, because it allows the
student to write the parametric form when a system has an infinite number of solutions and has
other applications in subsequent courses. Some of the College Algebra instructors may not have
time to cover linear inequalities, especially linear programming, and systems of nonlinear
equations. The coordinating board recommends the following topics, however we decided to
put them in the courses Discrete Mathematics I or Pre-Calculus Mathematics instead:

                                              57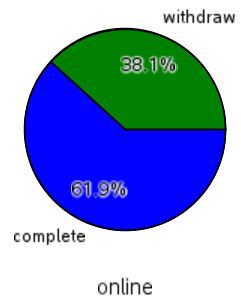
Academic Forum 30 2012-13
Mathematical induction, Binomial Theorem, arithmetic and geometric sequences and
series, counting techniques and probability. [4]
While maintaining high standards for College Algebra, HSU has several tutoring programs in
place, namely, mathematics-departmental tutors, Student Support Services, the First Year
Experience Program, and the Supplemental Instructional Program. We also have the alternative
course, Mathematics for the Liberal Arts, which is as sophisticated as College Algebra, but
avoids symbolic manipulation. We believe that students underutilize these programs and the
alternative course.
Design and Results
Near the beginning of the Fall 2012 semester, Pearson Publishing offered to supply free
MyMathLab (MML) [3] codes for three sections of College Algebra; the value for the ninety
affected students was about $7000. (MML is an online learning system.) In return, the author
agreed to send Pearson the final exams grades indicating whether the students used, or did not
use, MML. HSU’s Institutional Review Board [5] granted permission to gather this data,email
it Pearson, present this paper at the regional Mathematics Association of America meeting, and
publish it in the Academic Form. To ensure the privacy of both students and instructors, all of
their names were removed from the data and the students’ scores were sorted in increasing
order.
There was one online class already using MML, and two of the instructors, who were familiar
with MML, enthusiastically volunteered to use it as a supplement while the remaining
instructors taught the course traditionally. All College Algebra students took a common final
exam; their scores on this exam and the course completion rates were compared for the three
teaching methods. Here is a summary of the counts for the teaching methods versus how the
student completed the course:
Took final
Enrolled, but missed final exam W, WP, WF Sample size
exam
Hybrid 53 10 27 90
Online 13 0 8 21
traditional 121 25 68 214
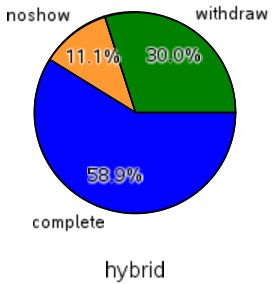
There were no no-shows for the online course because that instructor dropped all students who
stopped participating after a few weeks. Hence, when comparing the three teaching methods,
the no-show and dropped students were combined. As the following circle graphs illustrate, the
course completion rate does not appear to depend on the teaching method. In fact, a 2-way chi-
squared test of association confirmed this (p = 0.9, df = 2).
58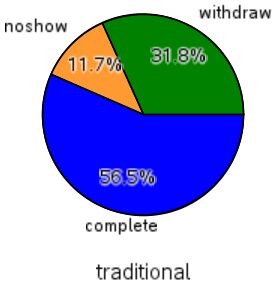
Academic Forum 30 2012-13

The rest of the analysis will focus on comparing the mean performance on the final
examination for those students who stayed with the course. A summary of their performances is
as follows:

               Sample size      Mean          Median
                  (n)           (%)            (%)
Hybrid            53            46.2            50
Online            13            44.4            43
Traditional       121           40.7            43

We interpreted applications and mathematical models in the state board policies as story
problems, a topic most students struggle with. The common final examination was a bit lengthy
at 26 questions and had 8 required application problems and 2 extra credit problems. The
emphasis on word problems contributed to the students tending to score worse than expected,
but they were not significantly lower on average than the Spring-2011 semester. Some of the
hybrid sections were added later to the schedule and probably contained weaker students, so it
is encouraging that they appeared to do better on average than the traditionally taught courses.
The instructors graded their own final exams, but since each problem was worth very few
points, it was assumed that this would have little influence on the final exam scores. The pass
rates were not examined because the instructors’ grading assessment and grading policy could
have affected that variable. Here is an ANOVA summary table for the final examination score
responding to the three teaching methods:

                  Factor                 SS           df    MS    F stat   P-val
                  Teaching methods       1,155          2   577   1.14     0.32
                  Error                92,838         184   505
                  Total                93,992         186

                                                 59
Academic Forum 30 2012-13
Hence, there was not a significant dependence of the final exam means on the three teaching
methods. It may have been inappropriate to include the online course with the other courses,
especially since the number of students taking the online course was small. It was nearly
significant that the hybrid classes scored higher on average than the traditional classes (p-val =
0.08, df = 94.1).
Power Analysis
The mean difference between the hybrid and traditional classes was 5.6%, but only a mean
difference of 9.5% can be detected with 80% power. This computation was done assuming that
Normally distributed ( = ̅ − ̅ ~ , ). The population standard deviation for this
the difference between the sample hybrid and traditional sample mean final exam scores was
statistic was estimated using the sample-standard deviations:
23.5 22.1
≈ + = + = 3.80%
53 121
This was a right-tail test, and the
because
≥ 6.26%| = 0 = 0.05
boundary of critical region was 6.26%
assuming a significance level of 5%. In
this context, the power function is
power =
≥ 6.26%| . The
defined by
detectable difference of 9.5% at 80%
power was found by locating the
intersection of this curve with 0.8 as
shown in the accompanying graph.
Epilogue
Because of the encouraging Fall-2012 results, all of the sections started using MML in the
spring of 2013. All of the instructors of the traditionally taught courses in the spring of 2013
verified that twenty percent of the students’ course grades were to come from MML
assessments. (83% of the course grade is from MML assessments for the online algebra
students.) We plan to do an internal study on the students’ performance on the final exam in the
spring of 2013, but it cannot be revealed outside our department because permission was not
requested from the HSU internal review board. I suspect that the efficacy of MML will depend
on how comfortable the instructor is with this learning system. We also plan to try MML again
in the fall of 2013 to allow the instructors to learn the system better and then do another internal
study of its effectiveness.
60Academic Forum 30 2012-13
References
• [1] Fred Worth, Statistics of success rates for mathematics service courses at Henderson
State University since Spring 2000
• [2] Don Small, An Urgent Call to Improve Traditional College Algebra Programs, MAA
Focus, May/June 2002
• [3] MyMathLab, http://www.mymathlab.com/
• [4] Arkansas Higher Education Coordinating Board Policies, 2011,
http://www.adhe.edu/Pages/home.aspx
• [5] Henderson State University Internal Review Board, http://www.Henderson State
University .edu/irb/
Biographical Sketch
Michael Lloyd received his B.S in Chemical Engineering in 1984 and accepted a position at
Henderson State University in 1993 shortly after earning his Ph.D. in Mathematics from
Kansas State University. He has presented papers at meetings of the Academy of Economics
and Finance, the American Mathematical Society, the Arkansas Conference on Teaching, the
Mathematical Association of America, and the Southwest Arkansas Council of Teachers of
Mathematics. He has also done mathematical and statistical consulting, and has been an
Advanced Placement statistics consultant since 2002.
61You can also read