Natural Fertility and Metals Contents in Soils of Rio Grande do Sul (Brazil)
←
→
Page content transcription
If your browser does not render page correctly, please read the page content below
Rev Bras Cienc Solo 2018;42:e0160418                                                                                                                     Article

                                               Division - Soil Use and Management | Commission - Soil Pollution, Remediation and Reclamation of Degraded Areas

                                               Natural Fertility and Metals Contents
                                               in Soils of Rio Grande do Sul (Brazil)
                                               Daiana Althaus(1)*, Clesio Gianello(1), Marino José Tedesco(1), Kelly Justin da Silva(2),
                                               Carlos Alberto Bissani(1) and Regina Felisberto(3)
                                               (1)
                                                   Universidade Federal do Rio Grande do Sul, Departamento de Solos, Porto Alegre, Rio Grande do Sul, Brasil.
                                               (2)
                                                   Universidade Federal do Paraná, Departamento de Genética, Curitiba, Paraná, Brasil.
                                               (3)
                                                   Instituto Federal de Educação, Ciência e Tecnologia do Rio Grande do Sul, Campus Porto Alegre, Porto Alegre,
                                                   Rio Grande do Sul, Brasil.

                                               ABSTRACT: The parent geological materials and formation factors influence the chemical,
                                               physical, and mineralogical properties and composition of the soil. Therefore, the aims
                                               of this study were to determine the chemical and some physical and mineralogical
                                               properties of the soil useful for agricultural practice; to determine the natural contents
                                               of the semitotal metals in soils of the state of Rio Grande do Sul (Brazil); and to suggest
                                               use of the quality reference values (QRVs) in accordance with Resolution 420/2009 of the
                                               National Commission for the Environment (Conama). To determine some soil properties
                                               useful for agricultural, 254 surface soil samples from areas without known human
                                               influence (native grasslands or forests) were analyzed according to the methodology
                                               used by the soil testing laboratories of the state of Rio Grande do Sul. In addition, the
                                               semitotal heavy metal (Cd, Co, Cr, Cu, Ni, Pb, V, and Zn) contents of the soil were
                                               determined by the Usepa 3050B method and Hg was determined through an adaptation
                                               of the Usepa 7471 method. The results were studied in five soil groups from the state
* Corresponding author:
                                               of Rio Grande do Sul according to soil parent materials: (1) basalt (volcanic rocks)
E-mail: daiana_althaus@
yahoo.com.br                                   of the Plateau region, (2) crystalline rocks (granite, schists, etc.) of the Southern Shield,
                                               (3) pelitic rocks (siltstones, mudstones, etc.) of the Peripheral Depression, (4) sandstones
Received: September 19, 2016
                                               (sedimentary) of the Central Plains, and (5) sediments (unconsolidated) of the Coastal
Approved: August 15, 2017
                                               Plains. The properties for agricultural use of these soils were compared using the criteria
How to cite: Althaus D,                        adopted by the current fertilizer recommendations for the state. Multivariate analysis
Gianello C, Tedesco MJ, Silva KJ,              was used to study metals contents. Average values of available P contents were low in
Bissani CA, Felisberto R. Natural
fertility and metals contents                  all soil groups; however, average values were high in several soil groups for available
in soils of Rio Grande do Sul                  K. Averages of total acidity and cation exchange capacity were higher in Group 1 soils.
(Brazil). Rev Bras Cienc Solo.
2018;42:e0160418.                              The average values of extractable Zn, Cu, and S were high in all soils. Averages of Fe
https://doi.org/10.1590/18069657rbcs20160418   oxides were higher in the soils formed over basalt than in the other soils. Average metal
Copyright: This is an open-access
                                               (Cd, Co, Cr, Cu, Ni, Pb, V, and Zn) contents were higher in Group 1 soils than in the other
article distributed under the                  soil groups (2 to 5). For Hg, however, average values were similar for all soil groups. The
terms of the Creative Commons
Attribution License, which permits
                                               Spearman correlation coefficients were positive and highest among the metals (except
unrestricted use, distribution,                for Cd and Hg) and the clay, Fed, and extractable Cu soil properties. Another high positive
and reproduction in any medium,
provided that the original author
                                               correlation coefficient was found between semitotal Cu and Zn contents and organic
and source are credited.                       carbon. The QRVs for Cd, Co, Cr, Cu, Hg, Ni, Pb, V, and Zn, determined according to
                                               Conama Resolution 420/2009, followed the same trend as the average metals contents.
                                               Keywords: native soils, chemical properties, heavy metals, quality reference values.

                                                                                                https://doi.org/10.1590/18069657rbcs20160418                  1
Althaus et al. Natural fertility and metals contents in soils of Rio Grande do Sul (Brazil)
INTRODUCTION
Soils develop over geological parent materials as a result of several factors, such as
climate, position in the landscape, and biotic activity over long periods of time. In the
southernmost state of Brazil (Rio Grande do Sul - RS) are very ancient crystalline rocks (such
as granites, schists, etc.), sedimentary rocks (siltstones, claystones, sandstones), more
recent volcanic rocks (basalt), and late unconsolidated deposited materials (sediments).
These materials influence the soils properties and the content of elements such as heavy
metals. Knowledge of the origin and distribution of geological materials contributes to a
better understanding of the occurrence of various types of soils in RS. The geological parent
materials are distributed according to the geomorphological provinces of RS, which are the
Southern Shield, Peripheral Depression, Plateau, and Coastal Plains (Streck et al., 2008).
The first comprehensive description, classification, and mapping of RS soils was presented
by Lemos et al. (1973) and revised according to the Brazilian Soil Classification System
by Streck et al. (2008). In those studies, 74 soil mapping units were presented, along
with several intermixed formations.
The first characterization of undisturbed soil (with no anthropogenic influence) for agricultural
purposes was that presented by Lemos et al. (1973). Several soil surveys were conducted
after that, starting with the study of Porto (1970), using data from the soil testing laboratories
that operated as a support for the RS program that started in 1966, which aimed to increase
crop yield (mainly wheat, corn, and soybeans). The latest state soil survey, published by
Rheinheimer et al. (2001), included the results of 168,000 soil samples taken throughout the
state. In these surveys, the data of pH(H2O), available P and K, total acidity (SMP method),
organic matter, and clay content were studied. The methods described by Mielniczuk et al.
(1969) reviewed by Tedesco et al. (1995) were used for soil testing. The surveys conducted
by Porto (1970) and Rheinheimer et al. (2001) mostly used samples of soils under cultivation.
Up to 1983, available Ca and Mg were not routinely determined in the soil testing
laboratories of RS since most of the soils had high total acidity and therefore required
liming, which increased these contents.
In 1982 and 1983, more detailed soil sampling was conducted in RS to characterize soil
fertility in order to establish the soil samples collection of the Soil Science Department of the
School of Agronomy at the Federal University of Rio Grande do Sul (UFRGS). These samples
were described by location, mapping unit, vegetation, land use, soil depth, and chemical
analysis for crop production (routine determinations) and summarized in a report to the
sponsors of this research [UFRGS and the Studies and Projects Funding Agency (Finep)] by
Volkweiss et al. (1983). Approximately one thousand samples were taken. Of these, about
one quarter were collected from areas without known human influence (native grasslands
or forests). These samples were used to characterize the native state of the soils of RS,
in general and by physiographic region, from the standpoint of agricultural practice (plant
macro- and micronutrients), heavy metals contents, or for other purposes.
Increasing ecological concerns over soil quality and soil use for disposal of residues (domestic
and industrial), starting in the 1980s, led several Brazilian state agencies to study and
propose soil quality standards, such as contents of heavy metals or other substances in
soils. In RS, maximun levels of tannery residues (containing Cr) were established (Rodrigues
et al., 1993). In the state of São Paulo, the Environmental Agency of the State of São Paulo
(Cetesb) presented guidelines for soil and groundwater quality (Cetesb, 2001, 2005), which
were later adopted by the National Environment Commission (Conama) (Conama, 2009).
The semitotal contents of some metals (Cd, Co, Cr, Cu, Hg, Ni, Pb, V, and Zn) from the
samples of undisturbed surface soils of RS in the UFRGS Soil Bank were presented by
Althaus et al. (2014). The State Environmental Protection Foundation (Fepam) later
adopted the QRVs with some adaptations that were required by the different properties
of the soils of the state of RS (Fepam, 2014).
Rev Bras Cienc Solo 2018;42:e0160418 2Althaus et al. Natural fertility and metals contents in soils of Rio Grande do Sul (Brazil)
The aims of this study were to determine the chemical and some physical and mineralogical
properties of the soil useful for agricultural practice; to determine the natural contents
of the semitotal metals Cd, Co, Cr, Cu, Hg, Ni, Pb, V, and Zn in soils of the state of Rio
Grande do Sul; and to suggest use of the quality reference values (QRVs) in accordance
with Resolution 420/2009 of the Conama.
MATERIALS AND METHODS
Soil samples
At the end of 1983, a soil sample collection was established at the Federal University of
Rio Grande do Sul through collection of approximately 1,000 samples representing the
74 soil mapping units described by Lemos et al. (1973) in the five geomorphological
regions of the state (Streck et al., 2008).
Each sample was characterized by location, soil mapping unit, vegetation, slope, parent
material, and soil use. The samples taken from the top layer (0.00-0.20 m depth) were air
dried, ground to pass through a 2 mm sieve (ABNT 10), and kept in tightly closed PVC jars.
In this soil collection, 254 samples were collected in areas without previous apparent
human activity (native grassland or forests), and they were used in this study. The soil
samples were classified into five soil groups, according to their parent materials (Table 1).
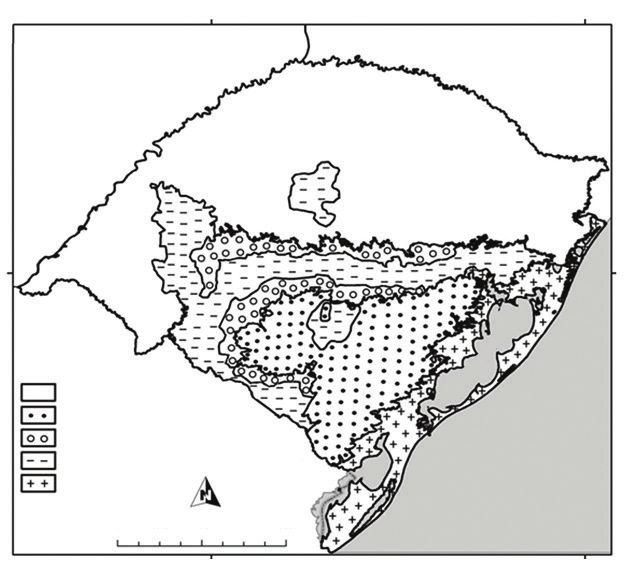
The location of the soil groups in the state is shown in figure 1.
Chemical, physical, and mineralogical characterization of the soils for
agricultural use
In the soil samples, particle size, pH(H2O), total acidity (H+Al), available P and K,
extractable S, total nitrogen, and organic matter were determined. The results were
summarized by Volkweiss et al. (1983). Subsequently, in this study, the values for available
P and K, exchangeable Ca, Mg, Al, Mn, and Na, and extractable Cu, Zn, and B were
determined in the same samples using an inductively coupled plasma optical emission
spectrometer (ICP - OES/Perkin-Elmer Optima 7300 DV). The analytical methodology
is summarized in table 2.
The analytical values of the soil iron oxides of low (Feo) and high (Fed) crystallinity were
reported by Felisberto (2009).
Semitotal metals contents
The semitotal metal contents (Cd, Co, Cr, Cu, Ni, Pb, V, and Zn) were determined by the
Usepa 3050B methodology (Usepa, 1996) from 2008 to 2012 using an ICP-OES.
Table 1. Soil groups with their parent materials, distribution in the state of Rio Grande do Sul (Brazil), and the number of samples
used in this study
Distribution
Soil groups(1) Parent materials No. of samples(3)
Region of the state Age of formation(2)
1 Basalt (volcanic) Plateau 140-130 108
2 Crystalline (granite, schist) Southern Shield >299 32
3 Pelitic (siltstones, mudstones) Peripheral Depression 299-145 39
4 Sandstone (Botucatu formation) Central Plains 145-66 51
5 Sediment (unconsolidated) Coastal PlainsAlthaus et al. Natural fertility and metals contents in soils of Rio Grande do Sul (Brazil)
55o 0’ 00” O 50o 0’ 00” O
ST
AT
E OF
SA
NT
AC
NA
N TI ATA
R
E INA
ARG
30o 0’ 00” S
A S
Soil Groups GO TO
LA PA
O S
D
1 - Basalt (43 %)
2 - Crystaline (13 %) N
UR EA
3 - Pelitic (15 %) UG OC
UA IC
Y NT
4 - Sandstone (20 %) A
GO M LA
LA IRI AT
5 - Sediments (9 %) M
0 62.5 125 250 km
Figure 1. Map of soil groups of the state of Rio Grande do Sul (Brazil) according to soil parent
material, based on the geological map (CPRM, 2006) and on the geomorphological province map
(Streck et al., 2008). Source: Adapted from Fepam (2014).
Table 2. Chemical, physical, and mineralogical properties of the soil determined in the soil groups
according to table 1 and analytical methodology used
Property(1) Extractant (method)
pH(H2O) soil:water ratio of 1:1 v/v
Total acidity (H+Al)(2) SMP index
Available P Mehlich-1 method
Available K Mehlich-1 method
Exchangeable Na Mehlich-1 method
Exchangeable Ca 1 mol L-1 KCl
Exchangeable Mg 1 mol L-1 KCl
Exchangeable Al 1 mol L-1 KCl
Exchangeable Mn 1 mol L-1 KCl
CEC Ca + Mg + K + Na + (H+Al)
Base saturation of the CEC (V) (Ca + Mg + K + Na) × 100/CEC
Extractable Cu 0.1 mol L-1 HCl
Extractable Zn 0.1 mol L-1 HCl
Extractable S Ca(H2PO4) (500 mg L-1 P)
Extractable B Hot water
Iron oxides of low crystallinity (Feo) NH4 oxalate (pH 3.0)
Iron oxides of high crystallinity (Fed) Citrate/dithionite - bicarbonate(3)
Organic carbon K2Cr2O7 (Walkley and Black, 1934)
Semitotal metal(4) 3050B (Usepa)
Hg(5) 7471 (Usepa)
Particle size NaOH dispersion (densimeter)
(1) (2)
According to the procedures described by Tedesco et al. (1995) or otherwise referred to. Calculated by the
(10.665 - 1.1483 × SMP) (3)
equation: (H+Al) = [e ]/10 (SBCS/NRS, 2004, 2016). According to the Mehra and Jackson (1960)
(4)
methodology, adapted by Inda Junior and Kampf (2003). According to the Usepa 3050B method (Usepa, 1996)
(5)
(for Cd, Co, Cr, Cu, Ni, Pb, V, and Zn). Adapted from the Usepa 7471 method (Usepa, 1998) by Felisberto (2009).
Rev Bras Cienc Solo 2018;42:e0160418 4Althaus et al. Natural fertility and metals contents in soils of Rio Grande do Sul (Brazil) Mercury was also determined in 146 samples (selected from the 254) extracted by an HNO3 + H2SO4 + KMnO4 solution at 110 °C [adapted from the Usepa 7471 methodology (Usepa, 1998) by Felisberto (2009)] with cold vapor - atomic absorption spectrometry (CV-AAS). Analytical quality control for Cd, Co, Cr, Cu, Ni, Pb, V, and Zn was verified by alternating determination of contents with use of the certified reference material BCR-142 R (IRMM, 2007) and a control soil sample from the Soil Testing Lab/UFRGS. The results from the certified material were presented by Althaus (2017). For Hg, analytical quality control is presented by Felisberto (2009). Statistical analysis of the data for soil agricultural use The results were statistically analyzed in the soil groups by average values. The soil properties used for lime and fertilizer recommendations for the crops were classified according to their reference value in the plant cultivation practice (CQFS-RS/SC, 2004, 2016). Spearman correlation coefficients (rs) were used to compare the soil properties. Statistical significance of the correlation coefficients was calculated for the 5 % probability level (p
Althaus et al. Natural fertility and metals contents in soils of Rio Grande do Sul (Brazil)

                                RESULTS AND DISCUSSION
Soil fertility evaluation

The soil properties used for liming and macronutrient (NPK) fertilization of agricultural
crops are shown in table 3. Since the average pH in all soil groups is low (60; 2: 41-60; 3: 21-40; 4: ≤20) (SBCS/NRS, 2004, 2016). Fertilization according to the
                                                                                         (5)
soil texture class, crop response groups, and soil management system (SBCS/NRS, 2016). Fertilization according
                                                                                     (6)
to the crop response groups and cation exchange capacity (CEC) (SBCS/NRS, 2016). Organic carbon according
                                                                                          (7)
to organic matter in % (low: ≤2.5; medium: 2.6-5.0; high: >5.0 (SBCS/NRS, 2004, 2016). CEC according to the
                                 -3
SBCS/NRS (2016) in mmolc dm (low: ≤75; medium: 76-150; high: 151-300; very high: >300).

                                                                Rev Bras Cienc Solo 2018;42:e0160418                     6
Althaus et al. Natural fertility and metals contents in soils of Rio Grande do Sul (Brazil)
75 H 30 400
62 H H
H H
60 22 298
53 H 21 300
Mg (mmolc dm-3)
Ca (mmolc dm-3)
H
Mn (mg dm-3)
M 20 17
45 M 15 H H
29 33 M 200 H 165 169
H
30 L 9 131
10 112
15
100
15
0 0 0
5 5 H 1.0 H
H 3.9 0.7
4 3.5 4
Cu (mg dm-3)
Zn (mg dm-3)
B (mg dm-3)
3 H H 3 H H M
1.9 H H 2.1 H 0.5 0.4 0.4 0.3
2 1.4 1.3 2 H H H 1.6 M
0.9 0.8 0.8 0.2
1 1
0 0 0
30 60 6
H
25 22 50 47.2 5 4.5
H 3.7
20 17 H 40 4
S (mg dm-3)
Feo (g kg-1)
2.9
Fed (g kg-1)
H H 13
15 30 3 2.0
11 10
10 20 2 1.1
8.3 7.1 9.2 8.2
5 10 1
0 0 0
1 2 3 4 5 1 2 3 4 5 1 2 3 4 5
Soil groups
Figure 2. Average contents of exchangeable Ca, Mg, and Mn; extractable Zn, Cu, B, and S; and Fe oxides of high (Fed) and low
(Feo) crystallinity in the soil groups according to table 1. L = low; M = medium; H = high, according to the SBCS/NRS (2004, 2016).
Analytical methodology used according to table 2.
Semitotal metals contents
The averages and the standard deviation values obtained for the semitotal contents of
the metals in the soils of the five soil groups are shown in figure 3. For the metals Cd,
Co, Cr, Cu, Ni, Pb, V, and Zn, the highest average values were determined in soil group
1 (developed over basalt). The highest average value was found for V (278 mg kg-1) and
the lowest for Cd (0.41 mg kg-1). The average values in the other soil groups decreased
in the order: Cu > Zn > Cr > Co > Pb > Ni.
Mercury, however, showed a different trend - the semitotal values are much lower than
those for the other metals (an average of 0.05 mg kg-1 for soil group 1). But the average
value for soil group 5 was similar to this. This is probably due to some anthropic influence,
since the samples were taken from recent sedimentary deposits.
For statistical study of the data, principal component analysis (PCA) was used, with
analysis of variance by randomization tests and Spearman correlation between metals
contents and soil properties.
Based on statistical analysis, quality reference values (QRVs) for the soils of the state
of Rio Grande do Sul were suggested and compared with others adopted by several
Brazilian states/regions and by the Conama.
Rev Bras Cienc Solo 2018;42:e0160418 7Althaus et al. Natural fertility and metals contents in soils of Rio Grande do Sul (Brazil)
1.0 80 a 120
a
0.8 100
60
a 80
Cd (mg kg-1)
Co (mg kg-1)
Cr (mg kg-1)
0.6
40 60 b
b b b b
0.4 bc b bc bc
40 c
20 c c
0.2 20
0.0 0 0
200 a 0.12 50 a
a
0.10 40
150
0.08 ab
Hg (mg kg-1)
Cu (mg kg-1)
Ni (mg kg-1)
30
100 0.06
b b
bc b 20
0.04 b
50 b c
10 c
bc c bc 0.02
0 0.00 0
40 a 600 a 140
a
500 120
30 100
bc 400
Zn (mg kg-1)
Pb (mg kg-1)
V (mg kg-1)
b b 80
20 c 300 b
60
200 b b b b
10 40
100 bc c bc
20
0 0 0
1 2 3 4 5 1 2 3 4 5 1 2 3 4 5
Soil groups
Figure 3. Average contents of semitotal Cd, Co, Cr, Cu, Hg, Ni, Pb, V, and Zn in the soil groups according to table 1. Averages with
the same letters are not statistically different in the randomization test from Euclidean distance (pAlthaus et al. Natural fertility and metals contents in soils of Rio Grande do Sul (Brazil) other parent materials (soil groups 2 to 5). In the study of Burak et al. (2010), the PCA method was also performed to better quantify the relationships among the variables and to identify groups of geochemically similar samples. As for the sample units, the metals, represented by vectors in the ordination diagram (Figure 4), were also more concentrated along axis 1, with the highest percentage of explanation of the distribution of sample units, since the highest correlation coefficient for the metals (with the exception of Cd) obtained by PCA are on axis 1. Mercury, although with a higher correlation coefficient related to axis 1 than axis 2, showed low correlations for both axes (Table 4). The proximity of the metals projected in the ordination diagram obtained by PCA analysis indicates the similarity among them. This is also shown by calculating the Spearman correlation coefficients (rs) for these same metals (Althaus, 2017), where high positive values (rs ≥0.65; p
Althaus et al. Natural fertility and metals contents in soils of Rio Grande do Sul (Brazil)

Analysis of variance by randomization tests

The randomization test to compare soil groups for metals, using the similarity measure of
the Euclidean distance type, showed the existence of contrasts by summing the squares
at the significance level of 5 % probability (p
Althaus et al. Natural fertility and metals contents in soils of Rio Grande do Sul (Brazil)

                                        The complete list of the Spearman correlation coefficients (rs) between the soil properties
                                        is presented by Althaus (2017).

                                        Quality reference values (QRVs)

                                        According to Conama Resolution 420/2009, the soil QRVs can be established considering
                                        the 75th or 90th percentiles (Conama, 2009). These values are presented by Althaus
                                        (2017) for the five soil groups of RS, as already mentioned (Althaus et al., 2014), for the
                                        metals Cd, Co, Cr, Cu, Hg, Ni, Pb, V, and Zn in soils. These values were adopted, with
                                        some adaptions, by the 85/2014 Fepam Ordinance (Fepam, 2014).

                                        Considering the large areas of the groups and the geomorphological and pedogenetic
                                        diversities in every state, and even more so in the country, the establishment of soil
                                        QRVs for smaller areas is justified, with technical and statistical support. Furthermore,
                                        each soil residues disposal project should include “blank” areas for reference as the
                                        operations proceed and for the decision-making to occur safely.

                                        The QRVs for native metals contents in the soils of RS at the 90th percentile are presented
                                        in two categories (Table 7): one for soils developed over basalt and the other as the
                                        averages of the remaining soils (soil groups 2 to 5, table 1).

Table 6. Spearman correlation coefficients (rs) between soil properties and metals. Correlation coefficients >0.65 are in bold
                                                                                            Metal
    Soil property
                            Cd             Co               Cr            Cu                 Hg             Ni            Pb               V               Zn
    Clay                   0.57*          0.75*            0.70*         0.84*              0.44*          0.75*         0.82*           0.82*            0.84*
    pH(H2O)                0.00           0.28*            0.25*         0.15*              0.15           0.26*         0.00            0.16*            0.17*
    H+Al                   0.33*          0.24*            0.21*         0.37*              0.21*          0.27*         0.47*           0.33*            0.36*
    Exchangeable Ca        0.22*          0.53*            0.51*         0.41*              0.32*          0.56*         0.30*           0.40*            0.46*
    Exchangeable Mg        0.32*          0.62*            0.62*         0.53*              0.34*          0.69*         0.40*           0.52*            0.59*
    CEC                    0.43*          0.59*            0.48*         0.64*              0.46*          0.60*         0.62*           0.57*            0.65*
    Extractable Cu         0.45*          0.80*            0.69*         0.86*              0.39*          0.77*         0.66*           0.83*            0.78*
    Extractable Zn         0.24*          0.49*            0.34*         0.44*              0.46*          0.41*         0.35*           0.42*            0.51*
    Exchangeable Mn        0.24*          0.69*            0.53*         0.55*              0.26*          0.57*         0.42*           0.55*            0.54*
    Fed                    0.64*          0.84*            0.79*         0.89*              0.51*          0.81*         0.80*           0.92*            0.89*
    Feo                    0.37*          0.66*            0.52*         0.67*              0.47*          0.61*         0.60*           0.61*            0.64*
    Extractable B          0.49*          0.64*            0.58*         0.68*              0.54*          0.63*         0.66*           0.66*            0.69*
    Organic carbon         0.52*          0.61*            0.45*         0.66*              0.47*          0.58*         0.64*           0.59*            0.67*
*
: significant correlation at a significance level of 5 % (p
Althaus et al. Natural fertility and metals contents in soils of Rio Grande do Sul (Brazil)
Soil mapping units, or even soil classes, were not considered in this study. Mello and
Abrahão (2013) pointed out that the soil classification system criteria mainly considers
soil genesis and not semitotal heavy metals contents.
Several Brazilian states, such as São Paulo (Cetesb, 2014), Minas Gerais (Copam, 2011),
Mato Grosso (Santos, 2011), Rondônia, Rio Grande do Norte (Preston et al., 2014), and
the Archipelago of Fernando de Noronha (Fabricio Neta, 2012), have adopted the 75th
percentile, which is more restrictive. However, other states, including RS, have adopted
the 90th percentile.
The 75th percentile is more restrictive to soil use, since it assumes that 25 % of the
soils are “naturally contaminated” and cannot be used, even for food production.
This leads to a paradoxical situation: on the one hand, agencies concerned about
the environment forbid use of the soil, and, on the other hand, there is a shortage of
areas for cultivation and, consequently, lower food production. For that reason, some
authors (Melo Junior, 2008; Paye et al., 2010) point out that, even with use of the 90th
percentile, there are at least 10 % “naturally contaminated” soils. For that reason, use
of the 90th percentile is more commonly accepted by government agencies in the
European Community and the USA.
In our study (a population of 254 soil samples), 2.5 % of them were excluded as outliers.
With use of the 90 percentile, we would have 12.5 % of the soil “naturally contaminated”,
which seems very strange, to say the least.
However, if the proposal of Conama Resolution 420/2009 for prevention values (PV)
and investigation values (IV) (Althaus, 2017) is accepted, more strange situations will
be observed for soil group 1: (1) the QRV for Co, Cr, Cu, and Ni are higher than their
prevention values (PV); (2) the QRV for Co is higher than the agricultural and residential
investigation value (IV). Moreover, for soil groups 2 to 5, the maximum variation of the
QRV for Co is higher than the proposed PV. It can be seen, therefore, that 43 % of the soils
of RS (developed over basalt) are “naturally contaminated” by some metal or another.
The situation of the Archipelago of Fernando de Noronha, a supposedly non-contaminated
environment, is at least as strange, since some QRVs for metals are higher than the
Conama PV and IV values (Fabricio Neta, 2012).
In Minas Gerais, the QRV for Cr was also observed to be higher than the PV (Mello and
Abrahão, 2013). This State Environmental Agency therefore decided to use the PV
(proposed by the Cetesb) as the QRV.
The whole strange situation comes from Conama’s decision to adopt the data obtained by
the Cetesb for the whole country; the Cetesb used few soil samples with small diversity
(Cetesb, 2001, 2005, 2014), similar to the parent materials of RS soil groups 3 (pelitic)
and 4 (sandstones).
Therefore, we suggest that due to the large diversity of the parent materials and
pedogeomorphological and pedogeoclimatic conditions, each state or region should propose
and use its own QRV based on standardized sampling and an analytical methodology,
as well as a suitable statistical basis.
Furthermore, the use of the QRVs as proposed by Conama Resolution 420/2009 does not
consider the agricultural use of organic residues generated by food production (poultry,
swine, and cattle raising) or industrial (tanneries) and urban (sewage sludge and organic
compost) activities. That means that a different approach must be used for disposal of
such residues in the soil, a practice highly recommended for several thousands of years in
organic agriculture. The interactions between soil properties, residue composition, plant
uptake, and effects of metals on living beings (animal and human) must be considered,
as suggested earlier (Quadro, 2008; Giasson and Tedesco, 2010).
Rev Bras Cienc Solo 2018;42:e0160418 12Althaus et al. Natural fertility and metals contents in soils of Rio Grande do Sul (Brazil)
CONCLUSIONS
Average values of available P contents are low in all soil groups, but are high in several
soil groups for available K. Averages of total acidity and cation exchange capacity are
higher in the soils developed over basalt (soil group 1). The average values of extractable
Zn, Cu, and S are high in all soils. Averages of Fe oxides are higher in the soils formed
over basalt than in the other soils.
Average metal (Cd, Co, Cr, Cu, Ni, Pb, V, and Zn) contents were higher in Group 1 soils
than in the other soil groups (2 to 5). For Hg, however, average values are similar for
all soil groups.
The Spearman correlation coefficients are positive and highest between the metals
(except for Cd and Hg) and the clay, Fed, and extractable Cu soil properties. Another
high positive correlation coefficient was found between semitotal Cu and Zn contents
and organic carbon.
The quality reference values (QRVs) for Cd, Co, Cr, Cu, Hg, Ni, Pb, V, and Zn, determined
according to the National Commission for the Environment (Conama Resolution 420/2009),
followed the same trend as the average metals contents.
REFERENCES
Althaus D, Silva KJ, Felisberto R, Tedesco MJ, Bissani CA, Gianello C. Teores naturais de metais
pesados em solos do Estado do Rio Grande do Sul. In: Anais do XXXIV Congresso Brasileiro de
Ciência do Solo; 2013; Florianópolis. Florianópolis: Epagri, SBCS; 2014. p. 5264-6.
Althaus D. Teores naturais e efeitos da adição de metais pesados em solos do estado do Rio
Grande do Sul [tese]. Porto Alegre: Universidade Federal do Rio Grande do Sul; 2017.
Biondi CM, Nascimento CWA, Fabricio Neta AB, Ribeiro MR. Teores de Fe, Mn, Zn, Cu,
Ni e Co em solos de referência de Pernambuco. Rev Bras Cienc Solo. 2011;35:1057-66.
https://doi.org/10.1590/S0100-06832011000300039
Burak DL, Fontes MPF, Santos NT, Monteiro LVS, Martins ES, Becquer T. Geochemistry and
spatial distribution of heavy metals in Oxisols in a mineralized region of the Brazilian Central
Plateau. Geoderma. 2010;160:131-42. https://doi.org/10.1016/j.geoderma.2010.08.007
Comissão de Química e Fertilidade do Solo - CQFS-RS/SC. Manual de adubação e de calagem
para os estados do Rio Grande do Sul e de Santa Catarina. 10. ed. Porto Alegre: Sociedade
Brasileira de Ciência do Solo - Núcleo Regional Sul; 2004.
Comissão de Química e Fertilidade do Solo - CQFS-RS/SC. Manual de calagem e adubação para
os Estados do Rio Grande do Sul e de Santa Catarina. 11. ed. Porto Alegre: Sociedade Brasileira
de Ciência do Solo - Núcleo Regional Sul; 2016.
Companhia de Tecnologia de Saneamento Ambiental - Cetesb. Relatório de estabelecimento de
valores orientadores para solos e águas subterrâneas no estado de São Paulo. (Série relatórios
ambientais). São Paulo: Cetesb; 2001 [acesso em 18 jan. 2016]. Disponível em: http://sites.usp.
br/sef/wp-content/uploads/sites/52/2015/03/46-CETESB2001_Valores_Orientadores_solo_agua.pdf.
Companhia de Tecnologia de Saneamento Ambiental - Cetesb. Decisão de Diretoria No. 195-2005- E,
de 23 de novembro de 2005. Dispõe sobre a aprovação dos Valores Orientadores para Solos e
Águas Subterrâneas no Estado de São Paulo - 2005, em substituição aos Valores Orientadores de
2001, e dá outras providências. São Paulo: Diário Oficial Estado de São Paulo; 2005 [acesso em 18
jan. 2016]. Disponível em: http://www.bvsde.paho.org/bvsacd/cd56/tabela-valores.pdf.
Companhia de Tecnologia de Saneamento Ambiental - Cetesb. Decisão de Diretoria
045/2014/E/C/I, de 20-02-2014. Dispõe sobre a aprovação dos Valores Orientadores para Solos
e Águas Subterrâneas no Estado de São Paulo - 2014, em substituição aos Valores Orientadores
de 2005 e dá outras providências. São Paulo: Diário Oficial Estado de São Paulo; 2014
[acesso em 18 jan. 2016]. Disponível em: http://www.Cetesb.sp.gov.br/wp-content/uploads/
sites/11/2013/11/DD-045-2014-P53.pdf.
Rev Bras Cienc Solo 2018;42:e0160418 13Althaus et al. Natural fertility and metals contents in soils of Rio Grande do Sul (Brazil)
Conselho Nacional do Meio Ambiente - Conama. Resolução No. 420, de 28 de dezembro de 2009.
Dispõe sobre critérios e valores orientadores de qualidade do solo quanto à presença de substâncias
químicas e estabelece diretrizes para o gerenciamento ambiental de áreas contaminadas por essas
substâncias em decorrência de atividades antrópicas. Brasília, DF; 2009 [acesso em 18 jan. 2016].
Disponível em: http://www.mma.gov.br/port/conama/legiabre.cfm?codlegi=620.
Conselho Estadual de Política Ambiental - Copam. Deliberação Normativa COPAM n° 166, de
29 de junho de 2011. Altera o Anexo I da Deliberação Normativa Conjunta COPAM CERH no 2
de 6 de setembro de 2010, estabelecendo os Valores de Referência de Qualidade dos Solos.
Belo Horizonte; 2011 [acesso em 18 jan. 2016]. Disponível em: http://www.siam.mg.gov.br/sla/
download.pdf?idNorma=18414.
Companhia de Pesquisa de Recursos Minerais - CPRM. Mapa geológico do Estado do Rio Grande
do Sul. Escala 1:750.000. Porto Alegre: Serviço Geológico do Brasil; 2006.
Fabricio Neta AB. Teores naturais de metais pesados em solos da Ilha de Fernando de Noronha
[dissertação]. Recife: Universidade Federal Rural de Pernambuco; 2012.
Fadigas FS, Amaral-Sobrinho NMB, Mazur N, Anjos LHC, Freixo AA. Concentrações naturais
de metais pesados em algumas classes de solos brasileiros. Bragantia. 2002;61:151-9.
https://doi.org/10.1590/S0006-87052002000200008
Felisberto R. Teor de mercúrio em solos do Rio Grande do Sul [dissertação]. Porto Alegre:
Universidade Federal do Rio Grande do Sul; 2009.
Fundação Estadual de Proteção Ambiental Henrique Luiz Roessler/RS - Fepam. Portaria Fepam
n° 85/2014. Dispõe sobre o estabelecimento de Valores de Referência de Qualidade (VRQ) dos
solos para 09 (nove) elementos químicos naturalmente presentes nas diferentes províncias
geomorfológicas/geológicas do Estado do Rio Grande do Sul. Porto Alegre; 2014 [acesso em 29
mai 2016]. Disponível em: http://www.fepam.rs.gov.br/legislacao/arq/Portaria085-2014.pdf.
Giasson E, Tedesco MJ. Classificação das terras e quantidades máximas de metais pesados a
adicionar por lodo de esgoto. In: Coscione AR, Nogueira TAR, Pires AMM, editores. Uso agrícola de
lodo de esgoto: avaliação após a Resolução n° 375 do Conama. Botucatu: Fepaf; 2010. p. 171-96.
Hammer Ø, Harper DAT, Ryan PD. PAST: Paleontological statistics software package for
education and data analysis. Palaeontol Electron. 2001;PE4.1.4A.
Holz M. Do mar ao deserto: a evolução do Rio Grande do Sul no tempo geológico. Porto Alegre:
Editora UFRGS; 1999.
Inda Junior AV, Kämpf N. Avaliação de procedimentos de extração dos óxidos de ferro
pedogênicos com ditionito-citrato-bicarbonato de sódio. Rev Bras Cienc Solo. 2003;27:1139-47.
https://doi.org/10.1590/S0100-06832003000600018
Institute for Reference Materials and Measurements - IRMM. Certified reference material BCR -
142R. Geel; 2007 [accessed on 18 Jan. 2016]. Available at: http://www.lgcstandards.com/medias/
sys_master/pdfs/pdfs/ha6/hc4/9208111169566/BCR-142R-ST-WB-CERT-1515931-1-1-1.pdf.
Kabata-Pendias A. Trace elements in soils and plants. 4th ed. Boca Raton: CRC Press; 2011.
Lemos RC, Azolim MAD, Abrão PUR, Santos MCL. Levantamento de reconhecimento dos solos do
estado do Rio Grande do Sul. Recife: Ministério da Agricultura; 1973. (Boletim técnico, 30).
Mehra OP, Jackson ML. Iron oxide removal from soils and clays by a dithionite-citrate system buffered
with sodium bicarbonate. In: Swineford A, editor. Clays and Clay Minerals: Proceedings of the seventh
national conference on clays and clay minerals. London: Pergamon Press; 1960. p. 317-27.
Mello JWV, Abrahão WAP. Valores de referência de qualidade para elementos traço nos solos de
Minas Gerais e Espírito Santo: os bastidores de uma experiência. Bol Inf Soc Bras Cienc Solo.
2013;38:12-7.
Melo EEC, Nascimento CWA, Santos ACQ, Silva AS. Disponibilidade e fracionamento de Cd, Pb,
Cu e Zn em função do pH e tempo de incubação com o solo. Cienc Agrotec. 2008;32:776-84.
https://doi.org/10.1590/S1413-70542008000300011
Melo Junior G. Argumentos em favor do percentil 90 na atual proposta de Resolução do Conama.
Natal: Universidade Federal do Rio Grande do Norte; 2008 [acesso em 18 jan. 2016]. Disponível
em: http://www.mma.gov.br/port/conama/processos/FE4582B1/CONAMA_11-12-2008-UFRN1.pdf.
Rev Bras Cienc Solo 2018;42:e0160418 14Althaus et al. Natural fertility and metals contents in soils of Rio Grande do Sul (Brazil)
Mielniczuk J, Ludwick A, Bohnen H. Recomendações de adubo e calcário para os solos e culturas
do Rio Grande do Sul. Porto Alegre: Universidade Federal do Rio Grande do Sul; 1969. (Boletim
técnico, 2).
Paye HS, Mello JWV, Abrahão WAP, Fernandes Filho EI, Dias LCP, Castro MLO, Melo SB, França MM.
Valores de referência de qualidade para metais pesados em solos no estado do Espírito Santo.
Rev Bras Cienc Solo. 2010;34:2041-51. https://doi.org/10.1590/S0100-06832010000600028
Paye HS, Mello JWV, Melo SB. Métodos de análise multivariada no estabelecimento de valores de
referência de qualidade para elementos-traço em solos. Rev Bras Cienc Solo. 2012;36:1031-41.
https://doi.org/10.1590/S0100-06832012000300033
Pillar VDP. Multivariate exploratory analysis and randomization testing with MULTIV. Coenoses.
1997;12:145-8.
Porto MDM. Levantamento da fertilidade e necessidade de fertilizantes e corretivos dos solos do
Rio Grande do Sul [dissertação]. Porto Alegre: Universidade Federal do Rio Grande do Sul; 1970.
Preston W, Nascimento CWA, Biondi CM, Souza Junior VS, Silva WR, Ferreira HA. Valores de
referência de qualidade para metais pesados em solos do Rio Grande do Norte. Rev Bras Cienc
Solo. 2014;38:1028-37. https://doi.org/10.1590/S0100-06832014000300035
Quadro MS. Crescimento de plantas e modificações de propriedades do solo após várias
aplicações de resíduos de curtume e carbonífero [tese]. Porto Alegre: Universidade Federal do
Rio Grande do Sul; 2008.
Rheinheimer DS, Gatiboni LC, Kaminski J, Robaina AD, Anghinoni I, Flores JPC, Horn D. Situação
da fertilidade dos solos no Estado do Rio Grande do Sul. Santa Maria: Universidade Federal de
Santa Maria; 2001. (Boletim técnico, 2).
Rodrigues AM, Anghinoni MCM, Tedesco MJ, Gianello C. Technical criteria for soil disposal of
tannery solid wastes. In: Anais do 12th Congress of the International Union of Chemists and
Technicians of the Leather Industry; 1993; Porto Alegre. Porto Alegre: International Union of
Chemists and Technicians of the Leather Industry; 1993.
Santos SN. Valores de referência de metais pesados em solos de Mato Grosso e Rondônia
[dissertação]. Piracicaba: Escola Superior de Agricultura Luiz de Queiroz; 2011.
Streck EV, Kämpf N, Dalmolin RSD, Klamt E, Nascimento PC, Schneider P, Giasson E, Pinto LFS.
Solos do Rio Grande do Sul. 2. ed rev ampl. Porto Alegre: Emater/RS; 2008.
Tedesco MJ, Gianello C, Bissani CA, Bohnen H, Volkweiss SJ. Análises de solo, plantas e outros
materiais. 2. ed rev ampl. Porto Alegre: Universidade Federal do Rio Grande do Sul; 1995.
(Boletim técnico, 5).
United States Environmental Protection Agency - Usepa. Method 3050B: acid digestion of
sediments, sludges, and soils, revision 2. Washington, DC; 1996.
United Stated Environmental Protection Agency - Usepa. Method 7471B: mercury in solid or
semisolid waste (Manual cold-vapor technique), revision 2. Washington, DC; 1998.
Volkweiss SJ, Tedesco MJ, Bohnen H, Bissani CA, Gutterres JF, Klamt E, Schneider P, Kampf
N. Levantamento dos teores de nutrientes das plantas em solos do Rio Grande do Sul. Porto
Alegre: Universidade Federal do Rio Grande do Sul; 1983. (Relatório de Pesquisa).
Walkley A, Black IA. An examination of the Degtjareff method for determining soil organic matter,
and a proposed modification of the chromic acid titration method. Soil Sci. 1934;37:29-38.
http://dx.doi.org/10.1097/00010694-193401000-00003
Rev Bras Cienc Solo 2018;42:e0160418 15You can also read