New Zealand Lighting Industry Product Stewardship Scheme - PHASE 1 Assessment and Review
←
→
Page content transcription
If your browser does not render page correctly, please read the page content below
New Zealand Lighting Industry Product
        Stewardship Scheme

                PHASE 1
         Assessment and Review

                  January 2008

               Report prepared by:

                       for

           Lighting Council New Zealand
                           &
             The Electricity Commission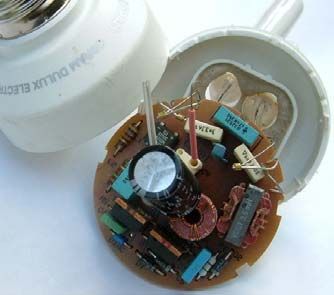
New Zealand Lighting Stewardship Phase 1 Report 3 January 2008

                                                CONTENTS

1   EXECUTIVE SUMMARY.............................................................................. 5
GLOSSARY ........................................................................................................ 7
2 INTRODUCTION....................................................................................... 9
3 LIGHTING TECHNOLOGY ........................................................................ 10
  3.1    What is Lighting? ..................................................................................10
  3.2    Lamps................................................................................................... 11
  3.3    Luminaires/fittings.................................................................................13
  3.4    Control Gear ........................................................................................13
  3.5    Material Composition...........................................................................14
4 THE NEW ZEALAND LIGHTING MARKET................................................. 17
  4.1    Lighting by End Use ..............................................................................17
  4.2    Volumes Sold .......................................................................................19
  4.3    Market Share ........................................................................................21
  4.4    Countries of Origin...............................................................................21
  4.5    Future Technology Trends ................................................................... 22
  4.6    How the Market Works....................................................................... 25
  4.7    Product Flows ..................................................................................... 30
  4.8    Membership of Industry Associations ................................................... 35
5 LIGHTING WASTE ................................................................................... 37
  5.1    Waste Model Assumptions................................................................... 37
  5.2    Waste Arising Model ........................................................................... 38
  5.3    Waste Composition ............................................................................. 40
  5.4    Mercury Arising ................................................................................... 42
6 END-OF-LIFE PATHWAYS ........................................................................ 45
  6.1    Council Recycling Facilities .................................................................. 45
  6.2    Building Demolition ............................................................................ 46
  6.3    Business-to-Business Recycling .............................................................. 47
  6.4    New Zealand Markets for Recycled Materials ...................................... 48
  6.5    Landfill ................................................................................................ 50
  6.6    End-of-Life Summary ........................................................................... 50
7 REGULATORY AND NON REGULATORY DRIVERS FOR CHANGE ........... 51
  7.1    Current and Proposed Regulation of Lighting in New Zealand ..............51
    7.1.1 Minimum Energy Performance Standards (MEPS) ..............................51
    7.1.2     Building Code and Associated Standards ........................................51
    7.1.3     Waste Minimisation (Solids) Bill.................................................... 52
  7.2    Non Regulatory Drivers for Change..................................................... 52
    7.2.1     Government Procurement Guidelines ........................................... 52
    7.2.2     Efficient Lighting Strategy.............................................................. 53

                                                       -2-                              www.stewardship.co.nz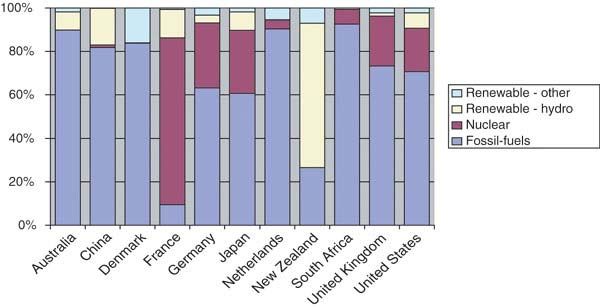
New Zealand Lighting Stewardship Phase 1 Report 3 January 2008

     7.2.3     New Zealand Emissions Trading Scheme (NZETS) ......................... 53
     7.2.4     Environmental Policies for Key Account Customers ....................... 54
     7.2.5     New Zealand Green Building Council ........................................... 54
     7.2.6     Public Concern ............................................................................. 55
     7.2.7     International Best Practice............................................................. 55
8 ENVIRONMENTAL AND HUMAN HEALTH ASSESSMENT........................ 56
   8.1    The Life cycle Impacts of Lighting......................................................... 56
   8.2    Mercury in Lighting ............................................................................. 57
   8.3    Pathways into the Environment ........................................................... 59
   8.4    Lighting Impacts on Human Health...................................................... 60
9 PUBLIC INFORMATION ........................................................................... 61
10     INTERNATIONAL APPROACHES TO LIGHTING STEWARDSHIP........... 65
   10.1 EU WEEE Directive .............................................................................. 65
   10.2 EU RoHS Directive .............................................................................. 66
   10.3 EU Energy Using Products Directive ..................................................... 66
   10.4 EU Stewardship Schemes...................................................................... 67
   10.5 Ireland .................................................................................................71
   10.6 USA..................................................................................................... 73
11 ASSESSMENT MATRIX.............................................................................. 74
12     OBSERVATIONS & RECOMMENDATIONS ........................................... 77
13     CONTACTS .......................................................................................... 82

                                                      -3-                              www.stewardship.co.nz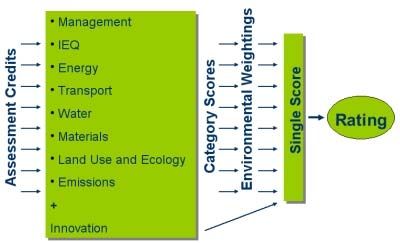
New Zealand Lighting Stewardship Phase 1 Report 3 January 2008
FIGURES
Figure 1. Examples of typical light fittings: Recessed fluorescent ceiling trough (left); fluorescent
batten (centre) and high-bay HID (right). Photos from Thorn Lighting www.thornlight.co.nz ..... 13
Figure 2. Examples of lighting control gear. Left: the electronic control gear inside an integrated
CFL (source: www.wikipedia.com); Right: an electromagnetic ballast........................................... 14
Figure 3. Composition of each different gas discharge lamp technology........................................ 16
Figure 4. Self-Reported Shares of Major Lighting Technologies in Commercial Buildings, from
KEMA (2007) ............................................................................................................................... 17
Figure 5. Distribution of Lamp Types in New Zealand residential buildings Source: KEMA (2007),
data from BRANZ (2006) ............................................................................................................. 18
Figure 6. Street lighting technology in use in New Zealand (EECA 2001)....................................... 18
Figure 7. Imports of lamps to New Zealand 1997-2006. Categories are limited to the categories
used by NZ Customs. Source: Statistics NZ .................................................................................... 19
Figure 8. Market share (by number of lamps) of the top 8 importers of gas discharge lamps to New
Zealand ........................................................................................................................................ 21
Figure 9. 1997 and 2006 Gas discharge lamp imports by Country of Origin. Data from Statistics
New Zealand. .............................................................................................................................. 22
Figure 10. Key stages in the life cycle of lighting in New Zealand, and the stakeholders involved in
those stages .................................................................................................................................. 31
Figure 11. Key stages in the life cycle of linear fluorescent lamps in New Zealand, and the
stakeholders involved in those stages ........................................................................................... 32
Figure 12. Key stages in the life cycle of compact fluorescent lamps (integrated control gear) in
New Zealand, and the stakeholders involved in those stages ....................................................... 33
Figure 13. Key stages in the life cycle of high intensity discharge lamps in New Zealand, and the
stakeholders involved in those stages ........................................................................................... 34
Figure 14. Imports of mercury-containing lamps to New Zealand. Based on Customs data and a
lighting industry survey ................................................................................................................ 38
Figure 15. Tonnes of gas discharge lamps arising as waste ............................................................ 39
Figure 16. 2007 overall estimated waste composition for gas discharge lamps in NZ .................. 40
Figure 17. Materials arising from waste discharge lamps between 2000 and 2012 ......................... 41
Figure 18. Mercury arising from gas discharge lamps .................................................................... 42
Figure 19. Scenario 1: 15-year predicted mercury arisings based on CFLs completely replacing GLS
lamps following MEPS in 2009 .................................................................................................... 43
Figure 20. Scenario 2: 15-year predicted mercury arisings based on CFLs completely replacing GLS
lamps following MEPS in 2009, followed by the gradual replacement of CFLs with an alternative
technology such as LED or high efficiency incandescent lamps after 5 years.................................. 44
Figure 21. Scenario 3: 15-year predicted mercury arisings based on a mix of lighting technologies
replacing GLS lamps following MEPS in 2009. ............................................................................. 44
Figure 22. Estimated composition of waste gas discharge lamps in NZ ......................................... 49
Figure 23. The Green Star NZ eight environmental categories and weighting............................... 55
Figure 24. Comparison of electricity generation sources in 11 countries. (Source: CIA World
Factbook, 2002)…………………………………………………………………………………………..57
Figure 25 Average mercury content of a T8 fluorescent lamp in the USA. Units are milligrams of
mercury per lamp (Source: Goonan, 2006; using data from NEMA)............................................ 58
Figure 26. Global mercury consumption in 2003 (from Maxson, 2005) ...................................... 58
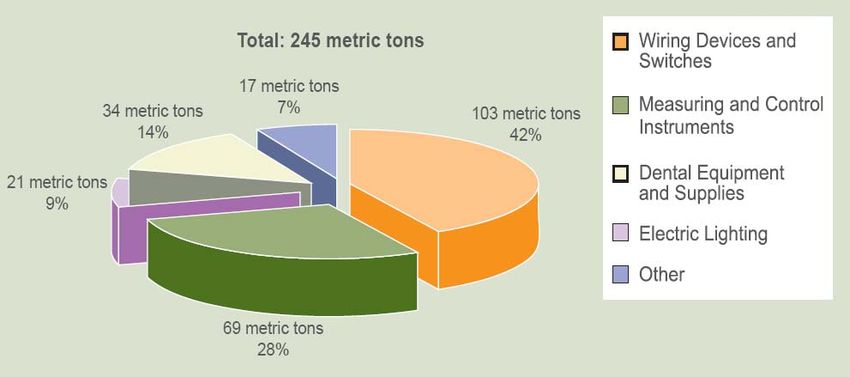
Figure 27. Total 2001 United States Mercury Use in Products (US EPA, 2006) ............................. 59
Figure 28. Kilograms per inhabitant of lighting waste collected by different European product
stewardship schemes. Source: WEEE Forum, pers. comm. (October 2007).................................. 69
Figure 29. A breakdown of costs per kilogram of lighting equipment handled by EU product
stewardship schemes. Source: WEEE Forum pers. comm. (October 2007) ................................... 70
-4- www.stewardship.co.nz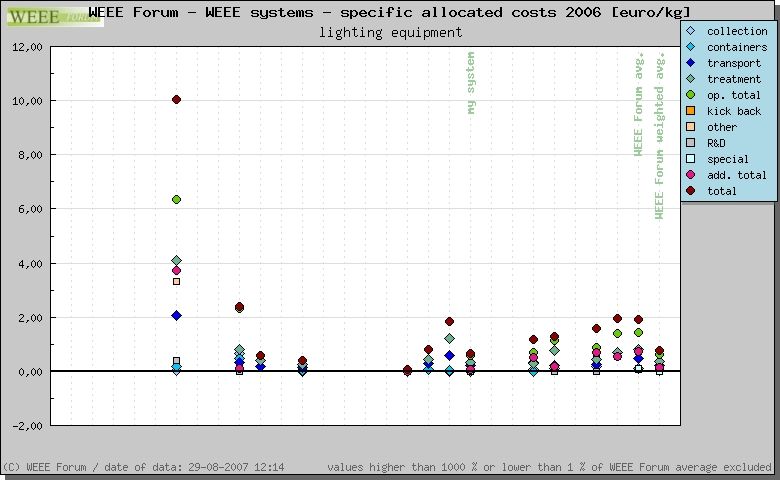
New Zealand Lighting Stewardship Phase 1 Report 3 January 2008

1   EXECUTIVE SUMMARY

There were 32 million lamps imported into New Zealand in 2006. 8.7 million of
these were mercury-containing lamps.

The lighting market is complex, with different technologies and a wide range of
end users. There have also been government interventions in the market that have
or will change the technology in use in New Zealand. These include the Electricity
Commission subsidising compact fluorescent lamps and EECA introducing
Minimum Energy Performance Standards (MEPS) for linear fluorescent lamps and
incandescent lamps (proposed).

The use of mercury helps to make lighting more efficient. A mercury-containing
compact fluorescent lamp is up to 80% more efficient than a standard
incandescent lamp for example. The majority of environmental impacts from
lighting occur during the use of a lamp, through the consumption of electricity.
Therefore, while mercury is a potentially dangerous substance it offers
environmental benefits that outweigh its impacts. This is the ‘mercury dilemma’ of
lighting.

This study has estimated that in 2007 approximately 5.6 million lamps entered the
waste stream in New Zealand, equating to 717 tonnes. Of these 5.6 million
lamps, just 500,000 were collected and recycled, meaning 91% of lamps were
disposed of to landfill.

Lighting represents a small portion of solid waste generation in New Zealand –
just 0.02%. Lighting is a relatively minor source of mercury arising from products.
The total load of mercury from gas discharge lamps [linear fluorescents, compact
fluorescents and high intensity discharge] is currently (2007) estimated to be
45kgs. It is expected to almost double in the next 5 years. This increase will result
from the compact fluorescent lamps already in use.

Lighting is highly visible to consumers and therefore becoming of increasing public
concern. Lighting is seen as a readily controllable source of mercury in our
environment and the industry has come under closer scrutiny from customers and
government to take action to address mercury-containing lamp waste.

There are no mercury-containing lamps manufactured in New Zealand and there
are a limited number of importers – 8 importers represent 93% of the gas
discharge lamp market. This market dynamic offers good opportunities for the

                                        -5-                       www.stewardship.co.nz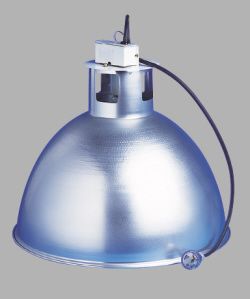
New Zealand Lighting Stewardship Phase 1 Report 3 January 2008

development of a simple product stewardship solution with reduced opportunity
for freeriders.

Our key recommendation is that the 8 companies that represent 93% of gas
discharge lamps imported into New Zealand begin a process to develop a
voluntary product stewardship scheme for their products. This scheme needs to
incorporate labelling, a commitment to reducing mercury content, public
education and raising awareness about the safe handling of mercury-containing
lamps. It also needs to involve ongoing collection of industry information on all
lamps.

We have also recommended that the mercury flows of New Zealand are
researched and that the lighting technology scenarios are re-modelled once the
Electricity Commission announces the successful proposals from the Efficient
Lighting Programme.

                                       -6-                       www.stewardship.co.nz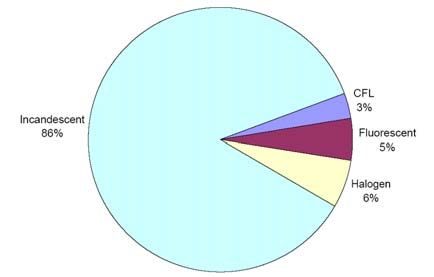
New Zealand Lighting Stewardship Phase 1 Report 3 January 2008

GLOSSARY

Ballast – A component of conventional control gear. It controls the current
through the lamp, and is used with discharge lighting, including fluorescent,
sodium, mercury and metal halide lamps. The term is sometimes used loosely to
mean control gear. Also called a choke.

CFL – compact fluorescent lamp

CFL-e – CFL with non-integrated, or external, ballast

CFL-i – CFL with integrated ballast

Colour Rendering (Ra) is the ability of lamps to render colours faithfully. It is
measured on the Ra index. The index runs from zero (0) (indicative of severe
colour distortion) until 100 (no colour distortion).

Colour temperature – Light sources are assigned a colour temperature, measured
in degrees Kelvin (K). This gives an indication of the warmth or coolness of the
colour appearance of the light source.

Control gear – A ‘package’ of electrical or electronic components including ballast,
power factor correction capacitor and starter. High frequency electronic control
gear may include other components to allow dimming etc.

Discharge lamp – A lamp that produces illumination via electric discharge through
a gas, a metal vapour or a mixture of gases and vapours.

EC – Electricity Commission

EECA – Energy Efficiency and Conservation Authority

Efficacy – the effectiveness of the lamp

e-waste – electronic/electrical waste, used interchangeably with WEEE.

Filament lamp – A lamp which produces illumination by heating a filament until it
glows

Gas discharge lamps – the family of lamps that include fluorescent and high
intensity discharge lamps

                                           -7-                     www.stewardship.co.nz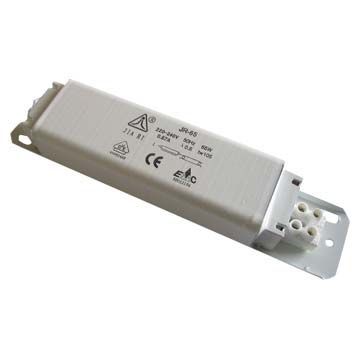
New Zealand Lighting Stewardship Phase 1 Report 3 January 2008

GLS – general lighting service (an incandescent lamp)

HID – high intensity discharge lamp

HPS – high pressure sodium lamp

LCA – life cycle analysis or assessment

LCNZ – Lighting Council New Zealand

LED – light emitting diode

LFL – linear fluorescent lamp

LPS – low pressure sodium lamp

Lumen output (lm/W) is the amount of light emitted by a lamp. It is measured in
lumen (lm) for each Watt (W) of power consumed. The efficacy is the key
indicator for efficient power consumption.

Lumen – is the metric/measure for the amount if light emitted from a light source.

Luminaire – A light fitting and lamp including all components for fixing and
protecting the lamps, as well as connecting them to the supply.

Lux – is the illuminance, equal to one lumen per square metre.

MED – Ministry of Economic Development

MEPS – minimum energy performance standards

MfE – Ministry for the Environment

MH - metal halide lamp

MV – mercury vapour lamp

WEEE – waste electronic and electrical equipment

                                          -8-                       www.stewardship.co.nz
New Zealand Lighting Stewardship Phase 1 Report 3 January 2008
2 INTRODUCTION
This report is the output of phase one in the development of a product
stewardship approach for lighting in New Zealand. This report has been
commissioned by the Lighting Council and the Electricity Commission, with
project support from the Ministry for the Environment. It fills a current gap in
coherent information available on lighting, its impact on the environment, and
the need for a lighting stewardship strategy to be developed in New Zealand.
Information for this report has been gathered from a wide range of sources,
including:
• Interviews with key stakeholders
• Market information from the New Zealand lighting industry
• Lighting Industry workshop on 5 November 2007
• Interviews and emails with international lighting organisations
• Literature review
• Desktop research
We believe that the contents of this report will inform the development of policy
in New Zealand and assist in the planning of a product stewardship programme
for lighting, if this is the route taken by the sector.
The lighting industry in New Zealand is complex because there are:
• a range of technologies on the market
• constant changes in that technology, including complete product
shifts (e.g. incandescents to compact fluorescents)
• a full spectrum of end users of lighting
• a number of different ways in which lighting is installed in the
marketplace
• a number of different pieces of legislation and policy that impact
on the sector
Because of these complexities we have tried to illustrate data and information
through diagrams and matrices wherever possible. Matrices allow for easier
analysis of complicated, inter-related variables.
-9- www.stewardship.co.nzNew Zealand Lighting Stewardship Phase 1 Report 3 January 2008
3 LIGHTING TECHNOLOGY
There is a wide variety of lighting technology available on the market. This
variety of technology means that some lighting products have impacts on the
environment in different ways to others. For example, a standard incandescent
lamp contains no mercury, but is considerably less energy efficient than a
fluorescent equivalent that does contain mercury.
Also, some types of lighting are suited to a particular use. It is not just a simple
matter of replacing one type of lamp with a more efficient technology.
Consideration must be given to the way in which that lamp is going to be used, as
well as the suitability of the fitting in which that lamp will sit.
3.1 What is Lighting?
It seems like a simple question. However, it is important to define what we mean
by lighting in the context of this report.
This report has not considered lamps that are integrated into other products. For
example lamps in fridges, lamps that backlight LCD screens, and lamps in
projectors, have been excluded from the analysis in this study. Some of these
lamps do contain mercury and their end-of-life management needs to be
considered. However, their management is being dealt with elsewhere through
product stewardship for electronic products.
Lighting is not just about the lamp. A luminaire is a term used to encompass a
light fitting and all its components. A luminaire is made up of the lamp, the lamp
housing (reflectors) and the associated control gear.
- 10 - www.stewardship.co.nzNew Zealand Lighting Stewardship Phase 1 Report 3 January 2008
3.2 Lamps
The table below summarises the lamp technology considered by this study.
Lamp family Lamp type Diagram 1 Main uses Brief description
Incandescent General Residential Electric current is passed through a coiled tungsten filament contained in a
Service Lamps glass envelope that is filled with an inert gas. The filament is heated by the
(GLS) 2 electric current and consequently emits electro magnetic radiation.
Tungsten Residential Halogen lamps are also filament lamps. Halogen is added to the fill gas to
halogen Commercial prevent evaporated tungsten from the filament condensing on the inside of
the lamp envelope. This feature means higher filament temperatures can be
reached and the size of the lamp envelope can be significantly reduced.
Fluorescent Linear Commercial Uses electricity to excite mercury vapour in argon or neon gas, resulting in a
fluorescent Industrial plasma that produces short-wave ultraviolet light. This light then causes a
lamp (LFL) phosphor to fluoresce, producing visible light. The blend of phosphors
controls the colour of the light, and along with the bulb's glass, prevents the
harmful UV light from escaping.
Compact CFLe Operate on the same principles as linear fluorescent, above. A compact
fluorescent Commercial fluorescent lamp may have a conventional ballast located in the fitting
lamp CFL (CFLi) or they may have a ballast integrated in the lamp, allowing them to
(external be used in fittings normally used for incandescent lamps.
ballast and
integral Residential
ballast) CFL- i
High High pressure Public lighting Uses sodium in an excited state to produce light. An amalgam of metallic
Intensity sodium (HPS) Industrial sodium and mercury lies at the coolest part of the lamp and provides the
Discharge sodium and mercury vapour in which the arc is drawn. Because of the
(HID) extremely high chemical activity of the high pressure sodium arc, the arc
tube is typically made of translucent aluminium oxide (alumina).
1 Images taken from Greenlight Australia (2004) Discussion Paper for Improving the Efficiency of Lighting in Australia 2005-2015
2 For this report incandescent reflectors(ICRs) are included in this category as they have a similar build and use profile
- 11 - www.stewardship.co.nzNew Zealand Lighting Stewardship Phase 1 Report 3 January 2008
Lamp family Lamp type Diagram 1 Main uses Brief description
Metal Halide Industrial An electric arc is passed through a mixture of gases. The compact arc tube
(MH) contains a high-pressure mixture of argon, mercury, and a variety of metal
halides. The mixture of halides affects the nature of light produced,
influencing the correlated colour temperature and intensity.
Mercury Industrial The arc discharge is generally confined to a small fused quartz arc tube
Vapour (MV) mounted within a larger borosilicate glass bulb. The outer bulb may be clear
or coated with a phosphor; in either case, the outer bulb provides thermal
insulation, protection from ultraviolet radiation, and a convenient mounting
for the fused quartz arc tube.
LED Light emitting A solid-state semiconductor device that converts electrical energy directly
diode (LED) into light.
- 12 - www.stewardship.co.nzNew Zealand Lighting Stewardship Phase 1 Report 3 January 2008
3.3 Luminaires/fittings
An important part of a lighting system is the fitting, or housing, in which the lamps
sit. The fitting is critical to the performance of the lamps contained within it. The
matching of appropriate fittings to particular types of lamps is something often
overlooked when the lamp is changed to gain energy efficiency. The fitting must
be suited to the lamp in order to ensure the lamp delivers effective lighting to the
end user.
Figure 1. Examples of typical light fittings: Recessed fluorescent ceiling trough (left); fluorescent
batten (centre) and high-bay HID (right). Photos from Thorn Lighting www.thornlight.co.nz
The materials used in luminaires vary widely, but are usually a mix of plastic, glass
and metal.
The metal types used in luminaires and enclosures are selected for application and
suitability of purpose. They can be made of light gauge steel or of commercial
grade aluminium.
3.4 Control Gear
Gas discharge lamps (fluorescent lamps and HID lamps) require control gear to
regulate current.
The simplest sort of ballast is generally referred to as a magnetic, or
electromagnetic, ballast. A basic inductor consists of a coil of wire in a circuit,
which may be wound around a piece of metal.
- 13 - www.stewardship.co.nzNew Zealand Lighting Stewardship Phase 1 Report 3 January 2008
Figure 2. Examples of lighting control gear. Left: the electronic control gear inside an integrated
CFL (source: www.wikipedia.com); Right: an electromagnetic ballast
Magnetic ballasts modulate electrical current at a relatively low cycle rate of mains
frequency 50Hz, which can cause a noticeable flicker. Magnetic ballasts may also
vibrate at a low frequency and can cause the audible humming sound people
associate with fluorescent lamps.
Modern ballast designs use advanced electronics to more precisely regulate the
current flowing through the electrical circuit. Since they use a higher cycle rate of
30 KHz, you don't generally notice a flicker or humming noise coming from an
electronic ballast.
The lighting industry estimates that about 80-90% of control gear currently sold
in New Zealand is electromagnetic and only 10-20% is electronic.
3.5 Material Composition
Identifying a standard composition for lighting products is extremely difficult.
There is a wide variety of lamps and luminaires available on the market each with
a different mix of materials. We have made some assumptions on average
composition based on similar studies conducted overseas, as well as information
supplied by the New Zealand lighting industry.
The materials used in lamps are related to the physical and chemical requirements
for efficient light production.
- 14 - www.stewardship.co.nzNew Zealand Lighting Stewardship Phase 1 Report 3 January 2008
Components used in lamp construction can be divided into three main categories:
Lamp structure (lamp envelope, metal support parts, cap)
Metal-electrical parts (electrodes, filaments, wiring, ballast)
Lamp envelope additives (inert gas, getter, emitter, mercury, sodium,
metal-halides, fluorescent powder).
Filament Lamps are typically made of:
Glass
Filament (often tungsten)
Inert gas
Gas discharge lamps are typically made of a selection of the following basic
materials:
Glass
Quartz
Ceramics
Electrodes
Mercury
Sodium
Metal-halide
Using an average material composition of lamps is problematic because of the
wide variety of designs and technologies available. Some example compositions
are presented in the table below 3 . Within the HID lamps group there are many
different lamp types and only two have been given as examples below (MHL =
metal halide; HPS = high pressure sodium).
Lamp Group Example Weight [g]
Total Glass Metals Electronics Plastics Rest
GLS 60W 33 30 3 -- -- 0.01
Halogen 35W 2.5 2 0.5 -- -- 0.01
Fluorescent 36W 120 115 3 -- -- 2
CFL-integral 11W 120 65 4 25 25 1
CFL-non-integral 13W 55 40 3 -- 10 2
HID MHL400W 240 195 42 -- -- 3
HPS150W 150 105 44.5 -- --
Source: European Lamp Companies Federation (www.elcfed.org)
3 European Lamp Companies Federation (www.elcfed.org)
- 15 - www.stewardship.co.nzNew Zealand Lighting Stewardship Phase 1 Report 3 January 2008
Mercury
Other Mercury Other
0.008%
4% 0.002% 0.8%
Plastic Plastic
18% 21%
Metal
5% CFL-e CFL-i
Glass
54%
Electronics
21%
Glass
73%
Metal
3.3%
COMPOSITION CFL-E COMPOSITION CFL-I
Mercury
0.004%
Mercury Other
Other Metal
0.02% 1.5%
1% 2.5%
Metal
24%
HID LFL
Glass
75% Glass
96.0%
COMPOSITION HID COMPOSITION LFL
Figure 3. Composition of each different gas discharge lamp technology
- 16 - www.stewardship.co.nzNew Zealand Lighting Stewardship Phase 1 Report 3 January 2008
4 THE NEW ZEALAND LIGHTING MARKET
Information on the nature of the New Zealand lighting market has been gathered
from sources including government statistics, research, and interviews with key
market players.
4.1 Lighting by End Use
There are four main categories of lighting end use and each uses a unique mix of
lighting technologies. The main use categories are: commercial, industrial,
residential and public lighting.
a. Commercial
Linear fluorescent lamps (LFLs) dominate the lighting in commercial
buildings, accounting for two-thirds of lighting technology in this sector
overall 4 . Incandescent lamps account for a further 20%.
Figure 4. Self-Reported Shares of Major Lighting Technologies in Commercial Buildings, from KEMA
(2007)
4 KEMA (2007) New Zealand Electric Energy-Efficiency Potential Study for the Electricity
Commission. Published 28 September 2007
- 17 - www.stewardship.co.nzNew Zealand Lighting Stewardship Phase 1 Report 3 January 2008
b. Industrial
We are unaware of information that characterises the lighting technology
mix for industrial facilities. However, interviews with lighting companies
and experience suggests that industrial lighting is dominated by HID lamps
and fittings, with some use of linear fluorescent lamps (LFLs). New CFL
lamps are beginning to be introduced onto the market as replacements for
HID lamps in some industrial uses.
c. Residential
Figure 5 shows that in residential
buildings, incandescent lamps are
still the most dominant lighting
technology, representing 86% of
lamps in households 5 . Growth in
sales of CFLs in recent years is likely
to have shifted this mix somewhat,
although there are varied Figure 5. Distribution of Lamp Types in New Zealand
opinions on how great this shift residential buildings Source: KEMA (2007), data from
BRANZ (2006)
has been to-date.
Low Pressure
Sodium Fluorescent
d. Public lighting 8,046 39,747
20%
Public lighting is dominated by 4%
HID technology. A study of
Incandescent
street lighting was conducted 2,379
by EECA in 2001 6 . The study 1%
surveyed New Zealand local
councils (Territorial Local
High Pressure Mercury Vapour
Authorities, or TLAs). As Sodium 39,525
Figure 6 shows, that 95% of 112,238 20%
street light technology is high 55% Metal Halide
Quartz Halogen 383
pressure sodium, fluorescent 54 0.2%
and mercury vapour lamps. 0.03%
Figure 6. Street lighting technology in use in New Zealand
(EECA 2001)
5 KEMA (2007) op. cit.
6 Energy & Technical Services Ltd (2001) EECA Street Lighting Energy Efficiency Study. Published by
the Energy Efficiency and Conservation Authority (EECA)
- 18 - www.stewardship.co.nzNew Zealand Lighting Stewardship Phase 1 Report 3 January 2008
4.2 Volumes Sold
For the purposes of this study we have relied on two sources of information to
estimate sales of lighting in New Zealand: a survey of members of the Lighting
Council of New Zealand in November 2007 and import statistics collected by
Customs. There is no manufacture of lamps in New Zealand so import data
should translate directly into sales.
Customs Import data
Import statistics are gathered using the New Zealand Harmonised System
Classification (NZHSC) 7 . Data is supplied to the New Zealand Customs Service by
exporters and importers, or their agents, and then on to Statistics New Zealand.
This harmonised system is designed to ensure that New Zealand’s data is
comparable worldwide.
22,000,000
20,000,000
18,000,000
Incand escent
16,000,000
Number of lamps
14,000,000
12,000,000
10,000,000
8,000,000
F l uo r escent
6,000,000
4,000,000 Incand escent Halo g en
Incand escent " Ot her "
2,000,000
HI D " o t her
HI D mer cur y o r so d i um
0
1997 1998 1999 2000 2001 2002 2003 2004 2005 2006
Figure 7. Imports of lamps to New Zealand 1997-2006. Categories are limited to the categories used
by NZ Customs. Source: Statistics NZ
The data from Customs has two limitations:
1. it is reliant on the accuracy of reporting by companies and import agents
2. the categories may not give sufficient levels of detail
7 Statistics New Zealand www.statistics.govt.nz
- 19 - www.stewardship.co.nzNew Zealand Lighting Stewardship Phase 1 Report 3 January 2008
Due to uncertainties over the robustness of the customs import data, the Lighting
Council of New Zealand conducted a survey of its members to establish import
levels.
Industry Survey
Members of the Lighting Council of New Zealand completed a confidential
market share survey in November 2007. The survey covered all types of gas
discharge lamps. Returns on the survey were limited to members of the Lighting
Council. The Lighting Council estimates that its membership represents 60-70% of
the lighting market in New Zealand. We have used data supplied by lighting
companies outside the LCNZ membership base, together with market knowledge
to extrapolate a total lamp market size.
In addition to lamps, we have estimated volumes of luminaires and control gear
based on information supplied by key companies in the sector.
Category Estimated total Percentage of
annual market size 8 market size
represented by
LCNZ members 9
LFL 3,500,000 93%
CFL-i 4,000,000 46%
CFL-e 700,000 96%
HID 475,000 95%
TOTAL mercury-containing lamps 8,675,000
Incandescent GLS 17,700,000
Incandescent halogen 3,300,000
TOTAL incandescent lamps 21,000,000
Luminaires approx 1,000,000
Control gear approx 1,000,000
8 Based on discussions with non-members of LCNZ and industry estimates
9 Based on 2007 LCNZ survey response.
- 20 - www.stewardship.co.nzNew Zealand Lighting Stewardship Phase 1 Report 3 January 2008
4.3 Market Share
Potential for companies to freeride
Others
an industry-wide product stewardship 7%
solution is an important issue when
considering how a product
stewardship scheme might work in
New Zealand. The potential to
freeride is largely driven by the size
of the market that is not “round the
table”, or is unable to be identified.
The New Zealand gas discharge lamp
market is dominated by a handful of
key players. Figure 8 shows that the
top 8 importers of gas discharge
lamps represent 93% of the market 8 companies
93%
in New Zealand. All but two of
these companies are members of the
Lighting Council of New Zealand. Figure 8. Market share (by number of lamps) of
the top 8 importers of gas discharge lamps to
New Zealand
4.4 Countries of Origin
The source of lamps being imported into New Zealand has changed significantly
over the last decade. The increased dominance of Chinese and South East Asian
manufacturing means that gas discharge lamps made in China and Thailand now
represent 75% of imported product.
- 21 - www.stewardship.co.nzNew Zealand Lighting Stewardship Phase 1 Report 3 January 2008
Other Australia Others
12% Taiwan 9%
15%
2%
France Hungary
6% 3%
Thailand
8%
1997 Thailand 2006 China, People's
Hong Kong 22% Republic of
9% 53%
Germany
32%
Netherlands
14% Germany
Japan 11%
4%
Figure 9. 1997 and 2006 Gas discharge lamp imports by Country of Origin.
Data from Statistics New Zealand
4.5 Future Technology Trends
Lighting technology is constantly changing. Determining the environmental
impact of lighting, and therefore the appropriate stewardship response, needs to
consider any future lighting technology changes. The discussion below on
potential technology changes is based on literature research and discussions with
key players in the New Zealand lighting industry.
Linear fluorescent lamps (LFLs) are likely to be an enduring technology. LFLs
dominate lighting in commercial buildings. Changes are being made in the design
of LFLs that impact on their environmental footprint. Firstly, the mercury content
of LFLs is being steadily reduced. Average mercury content 20 years ago was
around 50mg. Now the levels of mercury in each lamp is below 5mg.
Secondly, there is a gradual move away from T8 fluorescent lamps to smaller,
more efficient, T5 lamps. This process will be gradual because new T5 lamps
- 22 - www.stewardship.co.nzNew Zealand Lighting Stewardship Phase 1 Report 3 January 2008
cannot be retrofitted to T8 fittings 10 , they require new fittings. The shift to T5
lamps delivers environmental benefits because they are more efficient than T8
lamps and they use less material in their manufacture. However, T5 lamps do
contain slightly more mercury than T8s (around 1mg per lamp more).
A major discussion point in the lighting market revolves around the potential
phase-out of incandescent lamps. The New Zealand government has signalled
that it will follow the lead of Australia to mandate minimum energy performance
standards for incandescent lamps. This will effectively ban the sale of GLS
incandescent lamps (in their current form) from 2009. This gives rise to the
question: what will replace GLS incandescent lamps?
Since 2004 there has been a major push on householders to change GLS
incandescent lamps for compact fluorescent lamps (CFLs). The sale of CFLs has
been subsidised by the Electricity Commission.
There is uncertainty over what will replace GLS incandescent lighting after MEPS in
2009. One scenario is that CFLs will completely replace them and then continue
to dominate the home lighting market. However, recent technology
developments could see two or three alternative technologies become available in
the next 5 to 10 years. These are light emitting diodes (LEDs), higher efficiency
halogen lamps and high efficiency incandescent lamps. LEDs use only one-eighth
of the power of traditional bulbs and less than half that for CFLs. They also last a
very long time – up to 50,000 hours, and therefore offer an attractive potential
future lighting solution.
Both LEDs and high efficiency incandescent lamps are technologies under
development and not yet available as viable alternatives to household GLS lamps.
Considerable research and development is being undertaken on higher efficiency
halogen lamps that may provide an alternative to CFL-i technology. None of
these technologies under development contain mercury.
There is a good potential that future lighting for households will be made up of a
mix of all these types of technology – CFL, LED, higher efficiency halogen and
high efficiency incandescent.
10 New ”adaptor” technologies do exist that allow T5 lamps to be retrofittted to T8 fittings, but
this adaptor technology is new and the benchmarks for quantifying the energy savings in the
promotional material has been questioned.
- 23 - www.stewardship.co.nzNew Zealand Lighting Stewardship Phase 1 Report 3 January 2008
Table 1. Summary of technology trends and their potential environmental implications
Market Changes Market change Implications
drivers
Mature Gradual shift from T8 to T5 Material reduction
LFL
lamps
Strong growth Scenario 1: complete MEPS Scenario 1: increased
replacement of GLS with Govt market mercury waste
CFL intervention Scenario 2: temporary
Scenario 2: complete mercury increase,
replacement of GLS with historical waste issue
CFL for 5 years then gradual for product
CFL-i replacement with LED/high stewardship
efficiency incandescent Scenario 3: slight
Scenario 3: complete increase in mercury
replacement of GLS with waste
mixed
CFL/halogen/LED/high
efficiency incandescent
CFL-e Growth MEPS
Historically Possible shift away from Government 1) High-bay
mature HID to procurement fluorescent systems –
1) High-bay fluorescent guidelines decrease in mercury
systems 2) Streetlighting –
2) Streetlighting metal reduced mercury
HID
halide replace mercury waste
vapour 3) Shopfit – increased
3) Shopfit compact low mercury waste
watt metal halide displace
halogen
Potential Complete phase out from MEPS
GLS complete 2009
replacement
Possible high Replacement for GLS MEPS Reduction in overall
Halogen growth High wattage changing to mercury waste
low wattage
Possible high Replacement for GLS MEPS Reduction in overall
LED growth Technology mercury waste
development
High Possible high Replacement for GLS MEPS Reduction in overall
efficiency growth Technology mercury waste
incandescent development
- 24 - www.stewardship.co.nzNew Zealand Lighting Stewardship Phase 1 Report 3 January 2008
4.6 How the Market Works
The lighting market has changed significantly over the last decade. Ten years ago
the market was predominantly a cost driven commodity market, dominated by a
small number of key players. These players influenced and effectively provided
financial packages to the lighting market. At this time specialist lighting companies
made up approximately 10% of the lighting market.
In 2007 the market make-up is estimated to be 60% commodity and 40%
specialist lighting. This has resulted in more purpose designed lighting and less
“crashing of the specs” to reduce the upfront costs of installing lighting in new
buildings. Key influences for this change have been the introduction of the energy
saving lighting standard NZS 4243 11 in 2007, MEPS and the Greenstar rating
system (refer Section 7). “Crashing the specs” refers to the situation where the
initial upfront cost of the lighting is significantly reduced by using less expensive
gear than in the specifications. There are flow on effects, such as the lower
performance than the originally specified equipment and reduced energy
efficiency over the whole of life.
In 2005 the Electricity Commission and Energy Trusts entered and heavily
influenced the market by subsidising compact fluorescent lamps. This brought
new lamp importers/brand-owners into the market and helped to set minimum
standards for the mercury content in compact fluorescent lamps.
Figure 10 shows the six distinct stages of the lighting life cycle in New Zealand.
1 Import and manufacture
Overseas Manufacturers - lamps only
Role in market: Since the closure of the Osram/Philips lamp manufacturing plant
in 2000 all lamps are imported predominantly from China, Thailand and
Germany.
Number of companies: 7 main brand owners
Key brands: Philips, Osram, Sylvania, General Electric, Radium, EnergyMad, e-lite.
NZ Manufacturer - luminaries and control gear
11 New Zealand Standard NZS 4243: Energy efficiency – large buildings. Part 2: 2007 Lighting
This Standard sets lighting power density limits for different building uses, and provides an
alternative method to calculate limits for individual spaces within a building. NZS 4243 has been
updated to reflect current good design practices and the use of modern lighting technology that is
readily available.
- 25 - www.stewardship.co.nzNew Zealand Lighting Stewardship Phase 1 Report 3 January 2008
Role in market: OEMs or original equipment manufacturers assemble luminaries,
lamps and control gear from a combination of imported and NZ-made
components.
Number of companies: 4
Importers/distributors
Role in market: This mix of importers and distributors is dominated by the lamp
brand owners who import and distribute and the importers of luminaries already
fitted with lamps. In the market map importers and distributors are in both the
import & manufacturer and distribution & sale phases of the market. From a
product stewardship perspective this is the narrowest point in terms of the
numbers of companies active in this part of the supply chain.
Number of companies: 8
2 Distribution and sale
The distribution and sale stage is dominated by the electrical wholesalers who
handle the bulk of the lighting market. Significant volumes of lamps and
luminaries are sold through supermarkets, lighting stores and the big format DIY
chains (Warehouse, Bunnings, Placemakers, Mitre 10 etc.). An increasing volume
of lamps, luminaries and control gear is now imported directly by developers and
through the internet. These two channels have dotted lines because they are
emerging and need to be watched as potential high growth sources of lighting.
Electrical wholesalers
Role in market: The electrical wholesalers are dominated by three main groups
which are an amalgamation of a number of companies over the years. The
significant growth in outlets over the last 10 years has increased competition.
Number of companies: Three major general electrical wholesalers groups with 240
outlets throughout NZ plus an estimated 20 totally independent wholesalers
giving 250 to 260 outlets 12 . Of the 438 electrical distributors listed in the Yellow
Pages around 50% are specialists.
Key players:
Crane Distribution Group
MasterTrade Electrical Supplies – 49 outlets
Corys Electrical Supplies – 21 outlets
Redeal Group
Ideal Electrical Supplies – 47 outlets
Rexel Electrical Supplies – 26 outlets
12 Pers comm. Richard Ponting, CEO Lighting Council of NZ
- 26 - www.stewardship.co.nzNew Zealand Lighting Stewardship Phase 1 Report 3 January 2008
Powerbase Group
11 independent companies with a common buying policy - total 97 outlets
e.g. J A Russell, Stewarts Powerbase, Simpson Powerbase
Independent wholesalers
e.g. Trade Electrical Supplies Ltd, Cetnaj Electrical Supplies Ltd
Retail
Role in market: Retail shops provide an outlet for the householder and DIY as
well as small commercial buildings. Electrical wholesalers and in some cases
importers/distributors provide the point of sale for electrical contractors, in-house
electricians and maintenance contractors.
A number of the DIY companies have trialled take-back systems for fluorescent
lamps as part of the Electricity Commission funded projects. Many of the DIY
companies and the supermarket chains are members of the New Zealand Retailers
Association.
Number of companies: Six major retailers dominate the market followed by a
number of specialist lighting shops.
Key players by product purchased:
Lamps only – Progressive Enterprises, Foodstuffs supermarkets, petrol stations
Lamps and luminaries and controls
Household/ DIY/small commercial – Bunnings, Placemakers. Mitre 10, The
Warehouse, retail lighting (e.g. Lighting Direct), electrical wholesalers
Contactors – purchase from electrical wholesaler and/or from
importers/distributors
3 Installation – who installs the lamps, luminaries and control gear
Five major groups install lighting. The first two are the householder/DIY and the
small commercial office/business where the owner or staff will change the lamps.
This sector of the lighting industry is dominated by three distinct groups of
electricians:
Electrical contractors
Role in market: it is estimated by the Electrical Contractors of New Zealand that
there are 1600 electrical contractors. They undertake the majority of installation
and there are a number of large companies with 50 to >300 staff. These
companies tend to specialise in one part of the sector (e.g. streetlighting) or one
part of New Zealand (e.g. Auckland). One national chain has 9 branches plus key
national accounts (e.g. banks, malls) with relamping programmes that will
generate a significant proportion of their annual lamp sales.
- 27 - www.stewardship.co.nzNew Zealand Lighting Stewardship Phase 1 Report 3 January 2008
Many contractors are supplied by the electrical wholesaler “rep” who brings the
lighting hardware to the contractor.
In-house electricians
Role in market: In-house electricians are a distinct group who undertake their
work for a council, manufacturing plant or commercial building complex. They
have been identified separately because they handle a significant volume of gas
discharge lamps with mercury content and decide how the lamps and lighting
equipment are treated at the end of their life.
Maintenance contractors
Role in market: This is another significant group of electrical contractors who
contract to maintain lighting in a range of commercial and industrial settings as
well as public lighting. This group includes the Facilities Managers (FM) such as
Spotless Services, PAE and United Gooder that handle significant volumes of gas
discharge lamps on behalf of their Key Account Customers or Holders.
4 Use – where the lighting is installed
The widest part of the supply chain is found in the use phase. There are numerous
uses from residential and small commercial buildings to specialist lighting that
includes garden, architectural and horticultural lighting. By far the biggest use
covers the Key Account Customers.
Key Accounts Customers
Role in market: These companies and organisations directly purchase significant
quantities of lamps, luminaries and control gear either from importers and
distributors or electrical wholesalers who keep up their inventory. In this use
category there are retail buildings, office buildings, public buildings (including
hospitals, libraries, prisons, schools and institutions), industrial buildings and public
lighting. Public lighting includes city and street lighting as well as sports grounds,
airports etc.
Number of companies: numerous
Key players: Government Stores Board; Facilities Managers, banks, malls
5 De- installation
This is the same group as described in installation with the addition of a new
player, the demolition contractor, who frequently reuses or recycles the scrap
metal content of the luminaries and sends the lamps to landfill.
- 28 - www.stewardship.co.nzNew Zealand Lighting Stewardship Phase 1 Report 3 January 2008
6 End-of-life
As the lighting life cycle comes to an end there are three options available. The
first is recycling where the householder, DIY and small commercial operator are
able to take their used lamps to a council transfer station for recycling. The
second is commercial recycling where businesses, councils, electrical wholesalers
pay a commercial recycler to recycle lamps. The third option is to landfill as
described in Section 6.5
7 Lighting designers and specifiers
Lighting designers are key players in the market. While they do not appear in the
product flow diagram they are a key influencer sharing this role with the lamp
importers, electrical wholesalers and the electrical contractors. They specify the
type of lighting and are increasingly taking the whole of life impacts of the lighting
into account.
Each major lighting company has in-house lighting designers and provide this as a
free service for their customers. A number of the specialist lighting companies also
have in-house lighting designers and it is these companies that are increasingly
“pushing the envelope” and implementing best practice lighting design. The more
expensive the lamps and hardware, the more likely a lighting designer is involved.
Working against the lighting designers specifications are cost conscious developers
who downgrade the specification, often referred to by the industry as “crashing
the specs”, without thought to the downstream impacts of these decisions.
Engineering and architectural firms also influence lighting design and the importers
and distributors seek to influence their decisions, particularly for specialist lighting.
The electrical wholesalers also have a large influence on specifications depending
on the lamps, luminaries and control gear they chose to stock. The electrical
contractors and wholesalers we interviewed were particularly loyal to specific
lamp and hardware brands. This is, in part, due to the financial and/or travel
incentives for attaining specific sales targets with the particular supplier.
In terms of introducing new technology the street lighting and public lighting
sector were concerned about the reliability of the technology. Changing a lamp in
these situations takes considerably more resources than replacing a bulb at home.
For this reason they sought out proven rather than leading edge technology.
- 29 - www.stewardship.co.nzNew Zealand Lighting Stewardship Phase 1 Report 3 January 2008
4.7 Product Flows
Figure 11 to Figure 13 show the flow of lamps through their New Zealand life
cycle. These diagrams attempt to illustrate, approximately, the major flows of
lamps onto and off the lighting market. No diagram has been completed for CFL-
e lamps as these follow very similar pathways to LFLs as their dominant use is in
commercial buildings.
These diagrams do not show every pathway for lighting on the market, as this
would over-complicate things. For example, demolition contractors de-install
lamps from every part of the market so we have not shown product flows
through this channel. Instead, the diagrams are intended to show dominant routes
for lamps onto and off the lighting market.
Linear Fluorescent Lamps
Figure 11 shows that LFLs are imported into New Zealand and follow three major
routes to their end use:
1. direct to electrical contractors
2. through electrical wholesalers
3. via OEM manufacturers/assemblers of luminaires
Major end uses of LFLs are in: office buildings, public buildings and to a lesser
extent retail and industrial buildings. LFLs become waste through relamping
procedures and are predominantly handled by electrical contractors, maintenance
contractors and in-house electricians. More recycling of LFLs is taking place than
for other lamp types, although the majority are still being landfilled.
Compact Fluorescent Lamps
Figure 12 shows that market route for CFL-i lamps is much simpler, as they are
predominantly sold into the residential sector. Lamps are imported and sold to
consumers through a wide variety of retailers. CFL-i lamps are fitted by
householders and removed by householders at the end-of-life. Almost all lamps
are currently being disposed of to landfill.
High Intensity Discharge Lamps
Figure 13 shows that HID lamps flow onto the market in a similar way to LFLs –
either directly to contractors or via wholesalers and OEMs. Lamps are put in
place by in-house electricians, maintenance contractors and electrical contractors.
Major users are industrial buildings and public lighting, with some also used in
large retail. Lamps are taken out by the same contractors and in-house electricians
and are largely disposed of to landfill.
- 30 - www.stewardship.co.nzNew Zealand Lighting Stewardship Phase 1 Report 3 January 2008
ALL LAMPS & LUMINAIRES
Overseas manufacture NZ manufacture of
1. IMPORT & of lamps and luminaires luminaires (OEMs)
MANUFACTURE
Importer/ distributor
2. DISTRIBUTION Developers Retail Electrical wholesalers Internet sales
& SALE
Ho useho lder/ Small Maintenance In-house
3. INSTALLATION Electrical contracto rs
DIYer commercial contracto rs electricians
Key Account Custo mers
Retail Office Public Industrial Public
Residential Small Specialist
4. USE buildings buildings buildings2 buildings lighting3
buildings commercial lighting1
Small Demolition contractors Electrical contracto rs Maintenance In-house
Ho useholders
5. DE-INSTALLATION commercial contracto rs electricians
Recycling public Recycling co mmercial
6. END-OF-LIFE
Landfill
1 includes garden, architectural, horticultural,
2 includes hospitals, libraries, prisons, schools, in stitutes
3 includes street lighting and park lighting
Figure 10. Key stages in the life cycle of lighting in New Zealand, and the stakeholders involved in those stages
- 31 - www.stewardship.co.nzYou can also read