Norway spruce production and static stability in IUFRO thinning experiments in the Czech Republic
←
→
Page content transcription
If your browser does not render page correctly, please read the page content below
Journal of Forest Science, 67, 2021 (4): 185–194                                                          Original Paper

https://doi.org/10.17221/188/2020-JFS

Norway spruce production and static stability in IUFRO
thinning experiments in the Czech Republic
David Dušek*, Jiří Novák, Dušan Kacálek, Marian Slodičák

Forestry and Game Management Research Institute, Research Station at Opočno,
 Opočno, Czech Republic
*Corresponding author: dusek@vulhmop.cz

Citation: Dušek D., Novák J., Kacálek D., Slodičák M. (2021): Norway spruce production and static stability in IUFRO thinning
experiment. J. For. Sci., 67: 185–194.

Abstract: Despite recent issues, Norway spruce remains the most important commercial tree species which might be
demanded henceforth for its broadly utilizable wood. Even before foresters faced both the bark beetle outbreaks and
spruce decline, spruce monospecific stands were known to be prone also to other damage due to snow and wind. On
this basis, measures that help prevent such failures were looked for, which resulted in the establishment of internatio-
nal IUFRO experimental series focused on impacts of different thinning regimes on stability and production of spruce
stands. The thinning treatments differed in numbers of trees removed and retained on the site when dominant height
of crop trees was reached or allowable cut in non-crop trees was accumulated. Also effects of different width of skid
trails were tested. The study summarizes the results from the two IUFRO experiments in the Czech Republic. Effects of
thinning regimes on spruce were found positive though thinning reduced the total volume production of wood while
improving crop-tree stability which enhanced production safety. Different widths of skid trails had no effect on wood
increment. Early thinning of spruce can be used to prevent their damage. No such measure, however, can alleviate the
spruce decline.

Keywords: Picea abies; early thinning; stand stability; slenderness ratio; total volume production

  Thinning of forest stands is accounted a silvicul-               There were 14 European countries which estab-
tural measure that helps establish and maintain the             lished totally 29 IUFRO thinning experimental se-
most important stand properties such as perfor-                 ries at the beginning of the 1970s. The objective of
mance of tree individuals and production charac-                the experiments was to get the knowledge of rela-
teristics. Norway spruce (Picea abies /L./ Karst.) is           tionships between different thinning regimes and
still the most important commercial tree species                forest stand productivity, wood quality and static
that grows in many site conditions ranging from                 stability at both the stand and individual tree lev-
floodplain to mountainous spruce types of forest                els. In 2005, only 11 experiments were maintained
in the Czech Republic. Considerable damage to                   without discontinuation of the stand measurement.
monospecific spruce stands due to both snow and                    In the Czech Republic, three experimental thin-
wind forced foresters and researchers to revise a               ning series were established in accordance with the
currently applied thinning approach focusing on                 IUFRO international project focusing on spruce
both volume and quality of production; the inno-                production and stability that were expected to be
vative measures should also improve production                  affected by silvicultural measures (Abetz 1977).
safety and maintain other services of forest. Be-               Long-term observations, however, were carried out
sides effects of thinning, also the impact of initial           only in two of them, Machov (IUFRO 14) in eastern
density and spacing of plants was studied (Korpeľ,              Bohemia (Chroust 1981) and Vítkov (IUFRO 13) in
Saniga 1995).                                                   northern Moravia (Pařez 1981). Both were mea-
                                                                                                                        185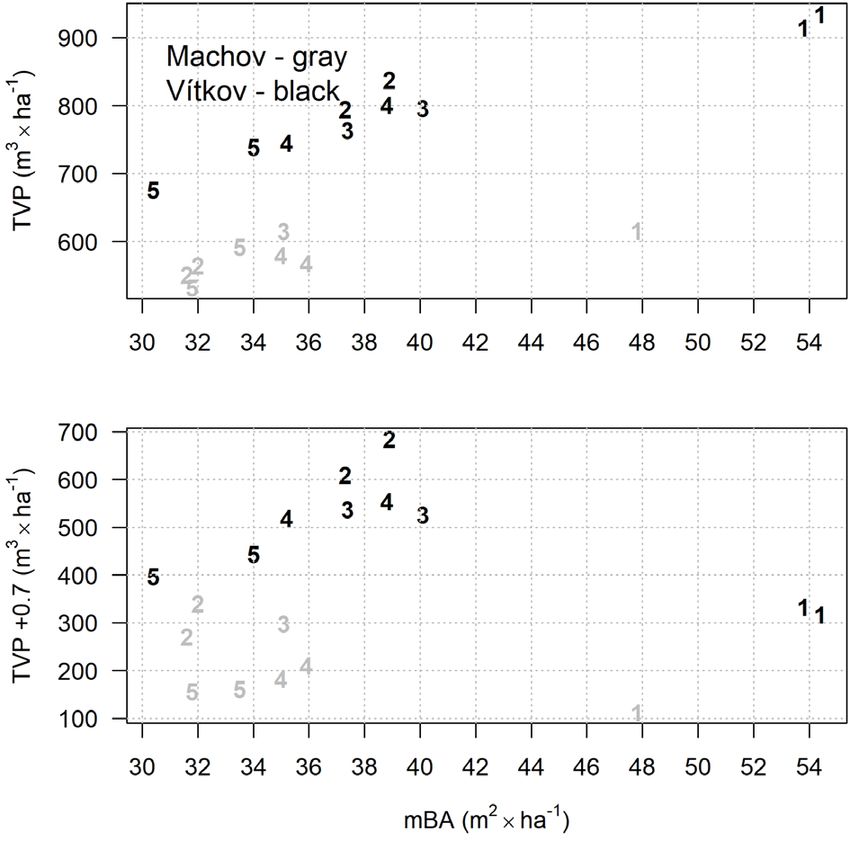
Original Paper Journal of Forest Science, 67, 2021 (4): 185–194
https://doi.org/10.17221/188/2020-JFS
sured annually until 2010 (IUFRO 13) and 2011 The Machov experiment was established as a
(IUFRO 14). In 2013–2014, both experimental ob- completely randomized design with five treat-
servations were terminated due to salvage cutting ments and two replications per treatment. One
by private owners. Some preliminary results from plot of control treatment and one plot of treatment
these experiments were published (Slodičák et al. 3 were excluded from the analysis due to different
2005, Slodičák, Novák 2006, 2007; Horák, Novák and possibly inappropriate manner of their estab-
2009; Dušek et al. 2015). lishment. The last thinning according to IUFRO
The objective of this study is to add a final analysis prescriptions was conducted in the stand reaching
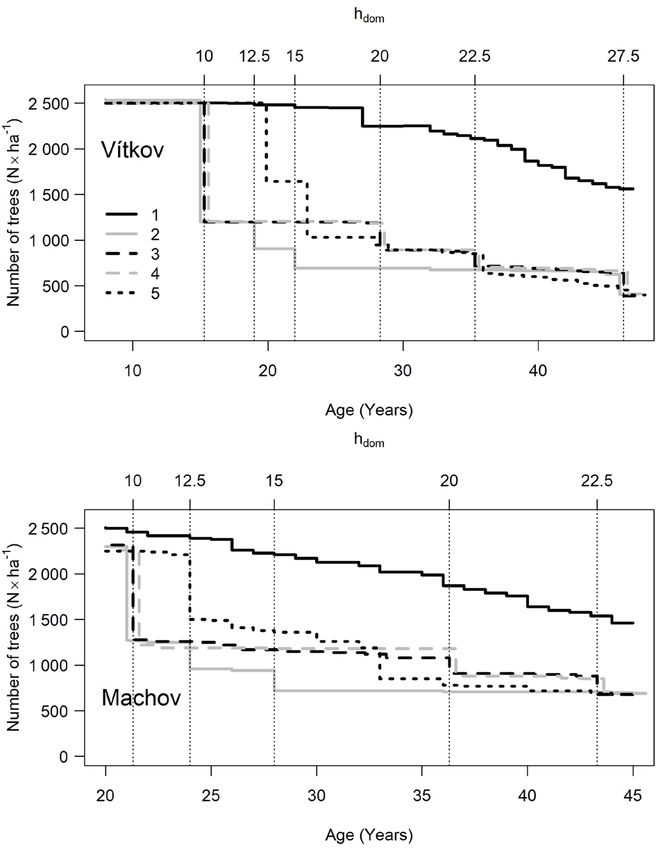
of data and also summarize the results from both a dominant height of 22.5 m in 2008 (Figure 1).
IUFRO experimental series with thinning expected Both experiments consisted of these treatments:
to influence spruce stand stability and production. 1 – Control without thinning, only wind-thrown and
Considering a working hypothesis, we supposed dry trees were removed.
an improved safety of production, which includes 2 – E arly heavy thinning from below when the
lower threat of snow load and wind, when heavy dominant heights of 10 m (1 200 trees·ha–1 were
thinning is conducted in young spruce stands. left), 12.5 m (900 trees·ha–1 were left) and 15 m
(700 trees·ha–1 were left) were reached. The last
MATERIAL AND METHODS thinning was conducted when dominant height
reached 27.5 m and 400 trees·ha–1 were left on
Study sites. The experimental site IUFRO 13-Vít- the site.
kov (Pařez 1981) was established in 8-year-old mono- 3 – The second and third thinning from below
specific Norway spruce stand with dominant height were delayed so as to obtain merchantable
of 3.5 m in 1971. The stands were planted regularly wood assortments from the stand with 20-me-
on afforested agricultural land with the initial density ter and 22.5-meter dominant height (900 and
of 2 500 plants per hectare. The site classification unit
was beech with fir [Abieto-Fagetum fraxinosum hu- hdom
(A)
midum according to Viewegh et al. (2003)] on moist-
to-wet gleyic Cambisol with dominant Athyrium
Number of trees (N × ha–1)
filix-femina at an altitude of 600 m a.s.l.
The experimental site IUFRO 14-Machov
(Chroust 1981) was established in 6-year-old mono-
specific Norway spruce stand with dominant height
of 1.2 m. The stand density was initially more than
three times higher (7 700 plants·ha–1) compared to
IUFRO 13. Prior to the research plot establishment,
the density was, therefore, reduced to comparable Age (Years)
2 500 plants·ha–1. The site classification unit was
hdom
beech with spruce [Piceeto-Fagetum illimerosum (B)
acidophilum according to Viewegh et al. (2003)]
Number of trees (N × ha–1)
on compacted acid gleyic Luvisol at an altitude of
700 m a.s.l. Some trees suffered from bark-stripping
damage by deer in the 1980s (15 years old stand).
Experimental and treatment design. The ex-
periments were established and measured accord-
ing to IUFRO methods (Abetz 1977; Herbstritt et
al. 2006). The Vítkov experiment was established
as a completely randomized block design with two
Age (Years)
blocks, five treatments and one replication of a
treatment per block. The area of a particular plot Figure 1. Density of trees and thinning prescriptions when
was 0.10 ha. The last thinning according to IUFRO the height of dominant trees (hdom) according to IUFRO
prescriptions was conducted in the stand reaching methodology was reached in the treatments (see Material
a dominant height of 27.5 m in 2008. and Methods)
186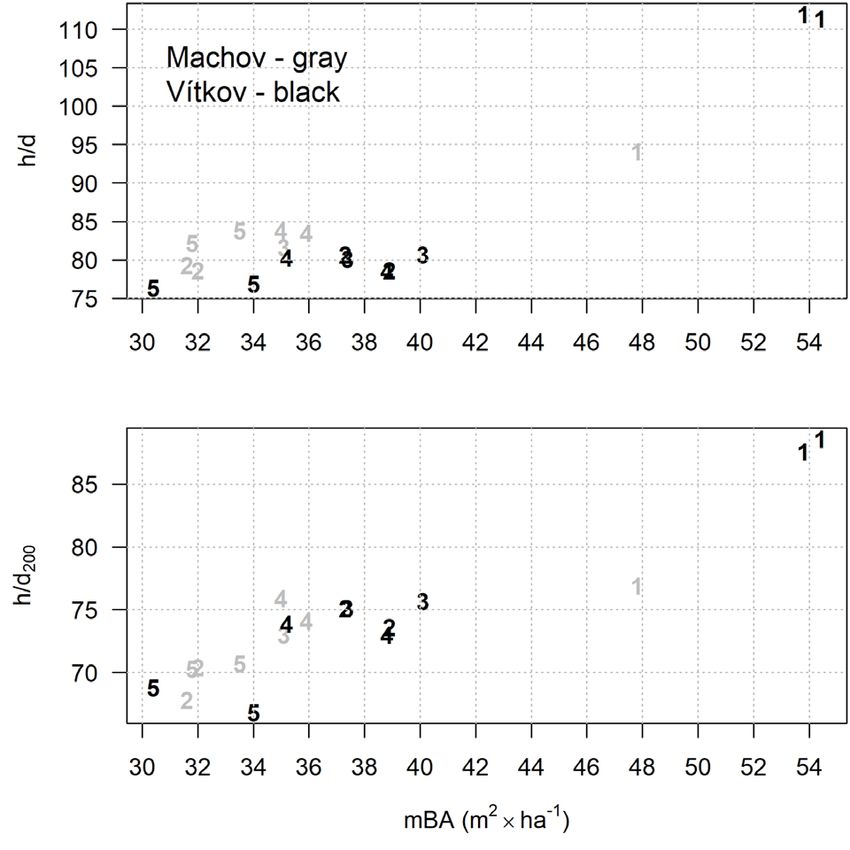
Journal of Forest Science, 67, 2021 (4): 185–194 Original Paper
https://doi.org/10.17221/188/2020-JFS
700 trees·ha–1 were left, respectively). The last for 200 thickest trees per ha (i.e. 20 trees per plot)
thinning was conducted when dominant height were calculated. Mean periodical basal area (mBA)
was 27.5 m and 400 trees·ha–1 were left on the as the thinning intensity (Pretzsch 2009) was calcu-
site. The treatment included a 3.5-meter skid trail. lated according to Formula (3):
4 – The same thinning prescription as in item 3 but pBA1 kBA1 pBA kBA2 pBAn kBAn
per1 per2 pern
a 5-meter skid trail was used. The wider the trail, mBA 2 2 2
(3)
per1 per2 pern
the less damage to trees left can be expected.
where:
5 – T he treatment called “commercial” where
pBA– initial basal area at the beginning of inventory period;
the thinning schedule is no longer based on
kBA – the basal area at the end of inventory period;
dominant heights. The thinning from above was
per – years in particular periods between the inventories.
conducted if 60 m3·ha–1 of available wood accu-
mulated in non-crop trees with DBH (diameter Both standing volume and total volume produc-
at breast height) exceeding 12 cm; these could be tion of inside-bark wood below the 7-cm sawlog top
removed while all crop trees were left on the site. diameter (e.g. see Domke et al. 2013) were estimated
Data collection. The experiments were mea- according to Korsuň (1961). The volume produc-
sured annually until 2010 (Vítkov) and 2011 (Ma- tion of the inside-bark sawlog was also calculated for
chov). Stem diameters of all trees were measured trees with volumes exceeding 0.7 and 0.5 m3. Both
using a calliper. Tree heights of 30 trees per plot planned cuttings and salvage cuttings were included
(represented the whole range of stem diameters) in the calculation of total volume production.
were measured using a Blume-Leiss hypsometer To verify the influence of experimental thinning
(Carl Leiss, Germany). In Vítkov experiment, the on particular mensurational and production char-
last mensuration was conducted at the age of 47 acteristics, ANOVA model (Formula (4)) for block
years in 2010; the dominant height was 28–29 m. design was used:
Four years later, the experiment was terminated
due to salvage cutting. y α treatment β1 block β2 ε N 0,σ (4)
The Machov experiment was terminated after
where:
being harvested by a new private owner at the age
y – dependent variable;
of 48 years in 2013. The last mensuration was con-
α – absolute term;
ducted two years earlier as the stand dominant
treatment – experimental treatment;
height reached ca. 24–25 m.
β1 – parameter for experimental treatment;
Data analysis. The mean DBH was expressed as
block – locality;
the mean quadratic diameter related to stem with
β2 – parameter for block;
mean basal area (dg) according to Formula (1):
ε – normally distributed errors;
d i2 (1) σ – variance.
dg
n The following four linear orthogonal (i.e. mutu-
where:
ally independent) contrasts were formulated:
di – DBH;
L1 – test of difference between the control and the
n – number of trees.
mean of all thinned treatments;
Based on the measured heights and DBHs, re- L2 – test of difference between the mean of treat-
gression parameters of height curves were calcu- ments 2, 3 and 4 (where a crucial parameter
lated using Formula (2) (Näslund 1937): for thinning was the reached dominant height)
d2 and the “commercial thinning” in treatment 5;
h 1.3 (2) L3 – test of difference between treatment 2 (with
α + β d
2
early thinning) and the mean of treatments 3
where: and 4 where thinning was delayed;
h – height
L4 – test of difference between treatments 3 and 4
d – DBH;
with the same thinning prescription and skid
α, β – regression coefficients.
trails of different width.
Based on the calculated height curves, height and Due to the unbalanced experimental design, a re-
slenderness ratio of mean stem and dominant stem stricted maximum likelihood method (REML) was
187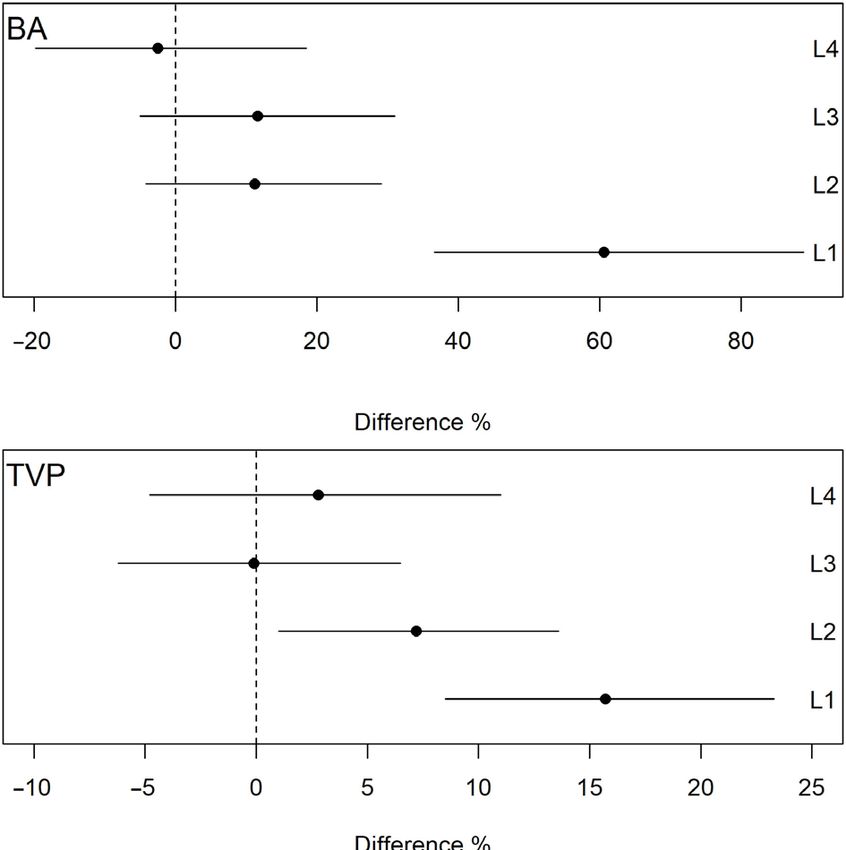
Original Paper                                                 Journal of Forest Science, 67, 2021 (4): 185–194

                                                                              https://doi.org/10.17221/188/2020-JFS

used. All dependent variables (except the slender-            ments as it showed a 13% reduction (L1, P < 0.001).
ness ratio) were logarithmically transformed, thus            The d200 of treatments 2, 3 and 4 were ca. 1% lower
the differences between the treatments (defined               compared to treatment 5 (L2, P = 0.86). Treat-
by the contrasts) can be expressed as proportion              ment 2 d200 showed ca. 6% thicker values compared
(percentage). Statistical language R (Version 3.6.3,          to treatments 3 and 4 (L3, P = 0.41). The differ-
2020) with nlme library (Pinheiro et al. 2020) was            ence between treatment 3 and 4 accounted for less
used for calculations of all tests.                           than 1% (L4, P = 0.41, Figure 2).
                                                                The mean stem slenderness ratio (h/d) showed
RESULTS                                                       less favourable, high values ranging between 94
                                                              (IUFRO 14) and 112 (IUFRO 13) in unthinned
  All results described in this section are based on 2010     control which represented the mean difference of
data from IUFRO 13 at the age of 47 years with height of      25 compared to the other thinned treatments (L1,
200 dominant trees (h200) 28–29 m and 2011 data from          P < 0.001). The differences between the thinned
IUFRO 14 at the age of 46 years with h200 24–25 m.            treatments were negligible and the ratio values
  The mean stem diameter (dg) was 28% lower in                ranged between 76 and 84. Also the dominant
unthinned control compared to thinned treat-                  stem slenderness ratio was the worst one in the un-
ments (contrast L1, P < 0.001). Treatments 2, 3 and           thinned treatment as it ranged between 77 (IUFRO
4 showed 6% thicker dg compared to the “commer-               14) and 89 (IUFRO 13). The mean difference of 12
cial” treatment 5 (L2, P = 0.02). The early thinning          was the value exceeding the mean of the thinned
increased dg as treatment 2 showed a 5% thicker               treatments (L1, P < 0.001). The differences between
value compared to delayed-thinning treatments                 the thinned treatments were negligible again (Fig-
3 and 4 (L3, P = 0.09). The differences between               ure 3, Table 1). The slenderness ratio of dominant
treatments 3 and 4 accounted for less than 2% (L4,            trees increased with the mean basal area (mBA).
P = 0.49). The unthinned dominant stem diam-                  Thinning proved a positive effect on the slender-
eter (d200) was also lower than the thinned treat-            ness ratio of dominant trees (Figure 4).

(A)                                                           (A)
dg                                                             h/d

                         Difference %                                                  Difference %
(B)                                                           (B)
 d200                                                         h/d200

                        Difference (%)                                                 Difference (%)

Figure 2. Percent differences in mean stem diameter (dg)      Figure 3. Differences in the slenderness ratio of mean stem
and stem diameter of dominant trees (d200) for particular     (h/d) and dominant trees (h/d200) for particular linear (or-
linear (orthogonal) contrasts with 95% confidence intervals   thogonal) contrasts with 95% confidence intervals
L1: treatment 1 – mean (treatments 2, 3, 4, 5); L2: mean      L1: treatment 1 – mean (treatments 2, 3, 4, 5); L2: mean
(treatments 2, 3, 4) – treatment 5; L3: treatment 2 – mean    (treatments 2, 3, 4) – treatment 5; L3: treatment 2 – mean
(treatments 3, 4); L4: treatment 3 – treatment 4              (treatments 3, 4); L4: treatment 3 – treatment 4

188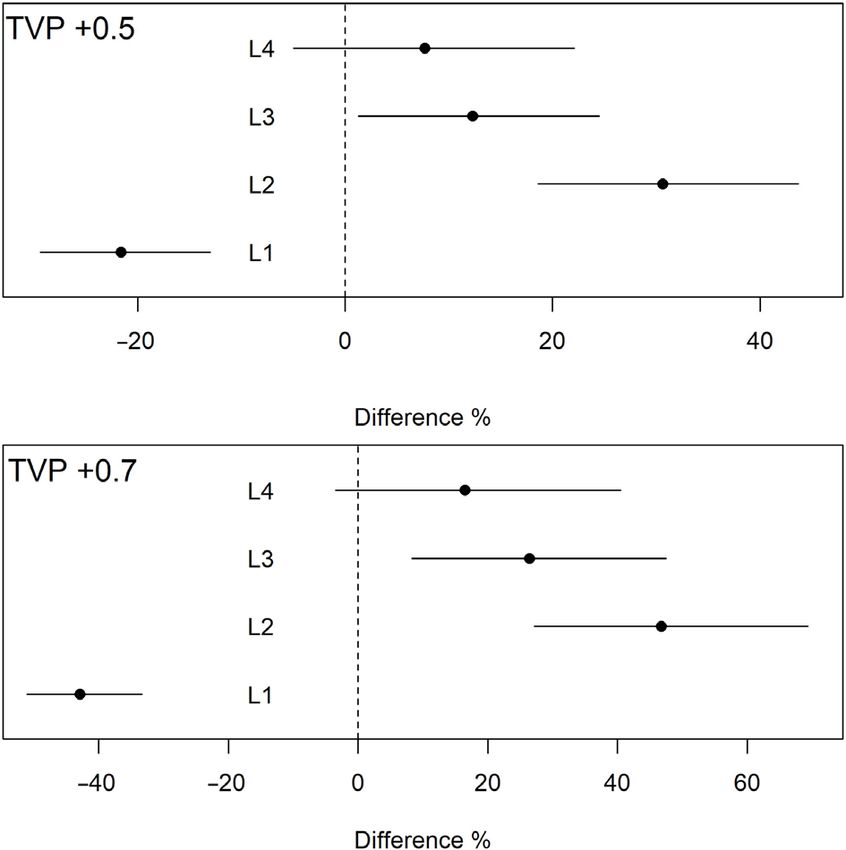
Journal of Forest Science, 67, 2021 (4): 185–194                                                           Original Paper

https://doi.org/10.17221/188/2020-JFS

Table 1. Experimental plots and treatment attributes at the end of observation period in 2010 (IUFRO 13-Vítkov,
47 years) and 2011 (IUFRO 14-Machov, 46 years)

                                                   N          dg           d200      h           h200
Locality        Block       Treatment                                                                      h/d       h/d200
                                              (trees·ha–1)          (cm)                   (m)
                                 1              1 460        22.9          31.4     21.6         24.2      94         77
                                 2                700        30.0          36.9     23.8         25.0      79         68
                                 2                700        30.4          35.2     23.9         24.8      79         70
                                 3                680        29.7          35.2     24.2         25.7      82         73
Machov            A
                                 4                710        28.5          33.9     23.8         25.1      83         74
                                 4                690        28.3          32.8     23.7         24.9      84         76
                                 5                780        27.2          34.1     22.8         24.1      84         71
                                 5                680        27.9          34.3     22.9         24.1      82         70

                                 1              1 470        23.6          32.3     26.3         28.6     111         89
                                 2                400        36.9          40.1     29.0         29.5      79         74
                  B              3                380        34.2          37.0     27.6         28.0      81         76
                                 4                420        35.2          38.3     27.7         28.0      79         73
                                 5                500        33.1          39.8     25.5         26.6      77         67
Vítkov
                                 1              1 650        23.4          32.8     26.2         28.7     112         88
                                 2                410        35.7          39.1     28.8         29.4      81         75
                  C              3                400        34.5          37.4     27.6         28.1      80         75
                                 4                400        34.3          37.8     27.5         27.9      80         74
                                 5                300        33.4          38.3     25.5         26.4      76         69

N – density of trees; d g – mean stem diameter; d200 – diameter of 200 dominant trees; h – mean height of stand; h200 – height
of 200 dominant trees; h/d – mean stem slenderness ratio; h/d200 – slenderness ratio of 200 dominant trees

(A)
                                                                     The greatest 61% higher mBA was reached in
                                                                   plots without thinning compared to the mean of
                                                                   thinned treatments (L1, P < 0.001). Basal area of
                                                                   “commercial” treatment 5 was 11% lower compared
h/d

                                                                   to treatments 2, 3 and 4 (L2, P = 0.19). Early heavy
                                                                   thinning in treatment 2 showed the 12% higher
                                                                   basal area than the mean of treatments 3 and 4
                                                                   (L3. P = 0.21). The difference between treatments
                                                                   3 and 4 accounted for less than 3% (L4, P = 0.80,
(B)
                                                                   Figure 5). The percentage differences in standing
                                                                   volumes were approximately in accordance with
                                                                   the differences in basal areas (Table 2).
h/d200

                                                                     The total volume production (TVP) in the un-
                                                                   thinned control treatment exceeded the thinned
                                                                   treatment production as it showed a 16% higher
                                                                   value (L1, P = 0.001). The “commercial” approach
                                                                   in treatment 5 reduced the TVP which was 7%
                            mBA (m2 × ha–1)
                                                                   lower compared to treatments 2–4 (L2, P = 0.04).
Figure 4. Relationship between mean basal area (mBA) and           The TVP differences between treatments 2, 3 and 4
slenderness ratio of mean stem (h/d) and dominant trees            were negligible. The TVP values increased with the
(h/d200); the letters denote the treatments                        mean basal area (Figure 6). The TVP accumulated
                                                                                                                           189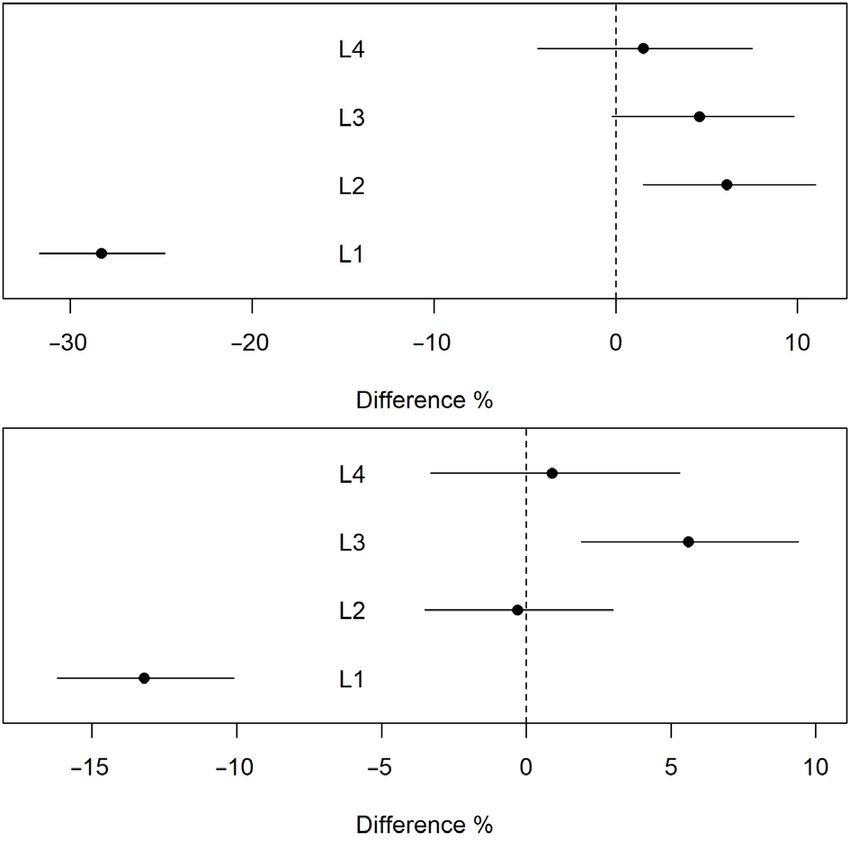
Original Paper                                                Journal of Forest Science, 67, 2021 (4): 185–194

                                                                             https://doi.org/10.17221/188/2020-JFS

(A)                                                          (A)

                       Difference %                                                  Difference %
(B)                                                          (B)

                       Difference %                                                  Difference %

Figure 5. Percent differences in basal area (BA) and total   Figure 7. Percent differences in the total volume production
volume production (TVP) for particular linear (orthogonal)   of trees whose volume exceeded 0.5 m3 (TVP+0.5) and trees
contrasts with 95% confidence intervals                      whose volume exceeded 0.7 m3 (TVP+0.7) for particular
L1: treatment 1 – mean (treatments 2,3,4,5); L2: mean        linear (orthogonal) contrasts with 95% confidence intervals
(treatments 2,3,4) – treatment 5; L3: treatment 2 – mean     L1: treatment 1 – mean (treatments 2,3,4,5); L2: mean
(treatments 3,4); L4: treatment 3 – treatment 4              (treatments 2,3,4) – treatment 5; L3: treatment 2 – mean
                                                             (treatments 3,4); L4: treatment 3 – treatment 4

(A)
                                                             in trees with the volume exceeding 0.5 m3 (TVP+0.5,
                                                             Figure 7) was the lowest in the unthinned treat-
TVP (m3 × ha–1)

                                                             ment showing a 22% lower value compared to the
                                                             thinned treatments (L1, P < 0.001). There was found
                                                             also a 31% reduction of TVP+0.5 in the “commercial”
                                                             treatment 5 compared to the other thinned treat-
                                                             ments 2, 3 and 4 (L2, P < 0.001). The early thinning
                                                             showed 12% higher TVP+0.5 than the delayed-thin-
(B)                                                          ning treatments 3 and 4 (L3, P = 0.05); the difference
                                                             between treatment 3 and 4 accounted for 8% (L4,
TVP +0.7 (m3 × ha–1)

                                                             P = 0.27). In larger trees with volumes exceeding
                                                             0.7 m3, TVP+0.7 differences were found even great-
                                                             er (L1 = –43%, P < 0.001; L2 = +47 %, P < 0.001;
                                                             L3 = +26 %, P = 0.01; L4 = +17 %, P = 0.14).

                                                             DISCUSSION
                         mBA (m2 × ha–1)
                                                               The last co-operative appraisal of all spruce thin-
                                                             ning IUFROs experiments was done at the age of
Figure 6. Relationship between mean basal area (mBA) and     30 years since the establishment of the experimen-
total volume production of all trees (TVP) and trees whose   tal series (Herbstritt et al. 2006). It was observed
volume exceeded 0.7 m3 (TVP+0.7); the letters denote the     that the stand density reduction according to the
treatments                                                   thinning prescriptions improved stand stability

190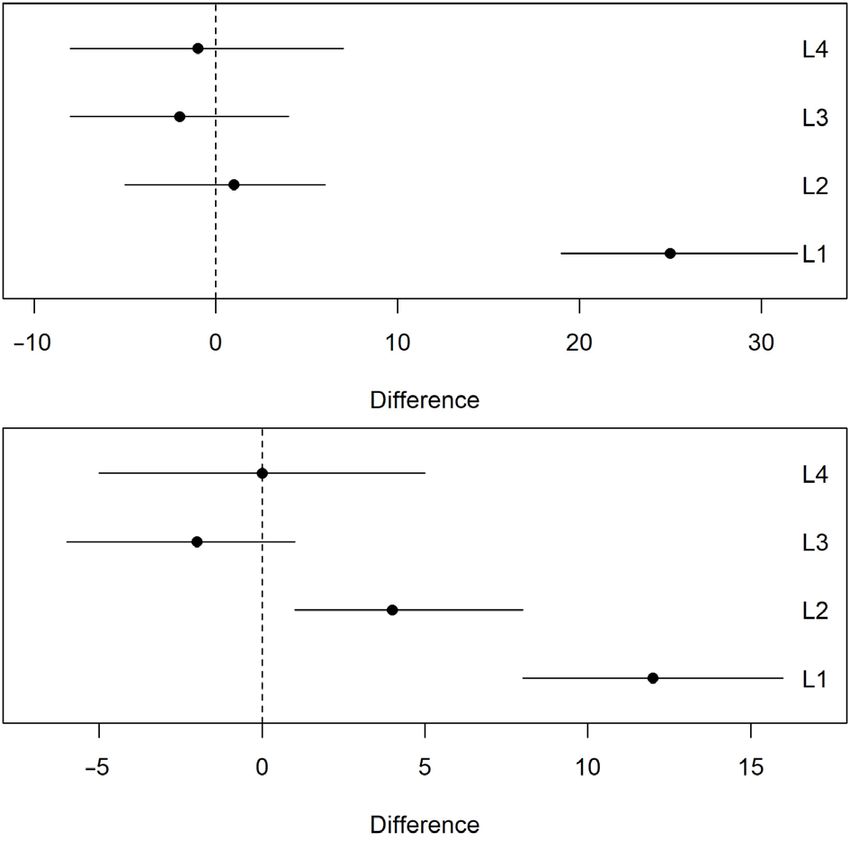
Journal of Forest Science, 67, 2021 (4): 185–194                                               Original Paper

https://doi.org/10.17221/188/2020-JFS

and accelerated diameter growth rate (Herbstritt         likely to be massively vulnerable to damage due to
et al. 2006). In studies dealing with Austrian (Neu-     snow and wind. The trees support each other until
mann, Rössler 2012) and German (Hein et al. 2008)        the canopy is broken. Thinning in our experiments
IUFROs, the same was concluded later.                    decreased the h/d ratio below the critical level,
   As for the accelerated diameter increment and         which confirmed the results from other experi-
improved stem slenderness (i.e. lower h/d ratio),        ments of IUFRO series (see Herbstritt et al. 2006,
which is a good proxy for static stability, both         Hein et al. 2008). The time when the thinning was
these characteristics were found positive in many        performed (i.e. in the young stage before the 10 m
other studies dealing with the young spruce stands.      top height) is essential for obtaining these results
Kuliešis and Saladis (1998) reported the improved        (stable stands), because postponed thinning is inef-
spruce stand stability if thinned intensively at the     fective from the stability point of view (Konôpka,
age of 9–11 years. Štefančík et al. (2012) observed      Konôpka 2017) and may, on the contrary, lead to
both higher diameter increment and improved              destabilization of stands (Wallentin, Nilsson 2014;
static stability in 21-year-old naturally regener-       Liziniewicz et al. 2016).
ated spruces thinned 4 years earlier. On the other          IUFRO 13 (Vítkov) showed the very high values
hand, results from Norway (Gizachew, Brunner             of basal area, standing volume and TVP, which was
2011) showed for spruce and pine that the basal          attributable to the soil fertility of former agricultur-
area growth increases with stand density although        al site. The production capacity exceeded the yield
slightly at higher densities. Also many other au-        table values for the site index +1, i.e. mean height of
thors (Blackburn, Petty 1988; Rollinson 1988; Mac-       36 m expected at the age of 100 years (Černý et al.
currach 1991; Pettersson 1993; Mäkinen, Isomäki          1996). Also tree dimensions after thinning achieved
2004, Gizachew et al. 2012, Katrevičs et al. 2018)       the values expected at the rotation age. Pape (1999a,
reported a negative correlation between the stand        1999b) reported that heavy thinning (before the
density and diameter increment whereas height in-        age of 30 years) removing 40% of the total basal
crement remained unaffected, which improved the          area considerably enhanced diameter development
stem slenderness thus impacting on the stand sta-        without loss in volume production or reduction in
bility positively.                                       the uniformity of wood. Also results from Pfister et
   Other benefits resulting from heavy thinning          al. (2007) suggest that appropriate combination of
were also found. For example Laurent et al. (2003)       initial wide spacing with thinning from above may
found that spruces became more resistant to              yield timber of similar quality compared to stand
drought over the six years following heavy thinning      with denser spacing where thinning from below was
of 22-year old stand. This shows an importance of        conducted. A significant reduction in wood quality
reduced competition for water and it also shows          (larger knot dimensions) was reported for hundreds
how the thinning of both water- and temperature-         of individuals after a very strong reduction of den-
stressed spruces, which is likely the result of global   sity (or with low initial planting density) (Mäkinen,
climate change (Maracchi et al. 2005; Rennenberg         Hein 2006; Katrevičs et al. 2018).
et al. 2006; Tatarinov, Cienciala 2009; Allen et al.        In our experiments, it seems, therefore, that such
2010; Lindner et al. 2010; Hlásny et al. 2011, 2014;     stand could be allowed for harvesting, which hap-
Choat et al. 2012) is needed.                            pened as the salvage cut was conducted without
   If the value of slenderness ratio exceeded 100,       important production loss in 2014. Besides, the
many authors (Milne 1995; Wang et al. 1998; Lekes,       first-generation spruces show more root and stem
Dandul 2000) reported the low stability of spruce        rot at the older age at these sites, which makes an
stands. Vicena (1964) reported 83 as critical and 79     economic income even lower if harvesting opera-
as optimal values for the fir-beech vegetation zone      tions are “postponed” until the stand reaches the
where both our study sites belong to. Konôpka et         rotation maturity. These days, however, the whole
al. (1987) and Navratil (1995) considered the h/d        Czech forestry sector faces a severe threat to large
ratio exceeding 90 as critical one indicating a threat   monospecific spruce stands due to drought and
by snow load. Both IUFRO 13 (Vítkov) and IUFRO           bark beetle outbreak, which affects the prices in the
14 (Machov) unthinned treatments showed the              market negatively as too much spruce roundwood
slenderness ratios of 100 and 90, respectively. From     is available for selling. An increase of species diver-
this point of view, the unthinned spruce stands are      sity and establishment of mixed stands are the ef-
                                                                                                            191
Original Paper Journal of Forest Science, 67, 2021 (4): 185–194
https://doi.org/10.17221/188/2020-JFS
ficient measures in the frame of adaptive strategy of and TVP. Unlike the trees with appropriate slen-
forest ecosystem management (Mason et al. 2012). derness ratio in upper story, the understory trees
Even mixed stands need thinning for the reasons were found to be labile as they broke frequently
such as species composition maintenance, growth thus increasing the need of salvage harvest.
support of particular species and trees and also The production safety was, however, still better
improved vigour and resilience against the harm- compared to the unthinned treatment.
ful agents etc. (Bauhus et al. 2017). The appropri- (vi) It can be concluded that early thinning of spruce
ately applied thinning is one of the tools helping can be used as a mitigation measure against snow
foresters to cope with climate change. To rely only and wind damage in stands of middle to higher
on natural mechanisms regulating the effects of cli- age. No such measure, however, can be expected
mate change is risky (Jandl et al. 2019). to alleviate the spruce decline due to drought,
Spruce stands stabilized by thinning might also be bark beetle and honey fungus that occurs in
well-prepared if the future conversion to mixtures forests in the Czech Republic nowadays.
in the next rotation period is needed. The change of
silvicultural management, from thinning from above REFERENCES
or below to a group selection system which shows
the highest mitigation efficiency against storm risk Abetz P. (1977): Programme of the European research in
(Müller et al. 2019), is also more feasible. stem number of spruce (Picea abies Karst.). Mitteilungen
der Forstlicher Versuchs- und Forschungsanstalt Baden-
CONCLUSION Württemberg, 80: 15–21.
Allen C.D., Macalady A.K., Chenchouni H., Bachelet D.,
(i) Thinning accelerated diameter increment and McDowell N., Vennetier M., Kitzberger T., Rigling A., Bres-
helped develop better parameters of slenderness hears D.D., Hogg E.H., Gonzales P., Fensham R., Zhang Z.,
ratio which improved the static stability of trees. Castro J., Demidova N., Lim J.H., Allard G., Running S.W.,
The differences in the slenderness ratio between Semerci A., Cobb N. (2010): A global overview of drought
the thinned treatments were found negligible. and heat-induced tree mortality reveals emerging climate
(ii) The unthinned treatment showed the largest change risk for forests. Forest Ecology and Management,
basal area, standing volume and total volume 259: 660–684.
production, whereas both mean diameter and Bauhus J., Forrester D.I., Pretzsch H., Felton A., Pyttel P.,
mean stem volume were the lowest. The inten- Benneter A. (2017): Silvicultural options for mixed-species
sive thinning, therefore, reduced the total vol- stands. In: Pretzsch H., Forrester D., Bauhus J. (eds.):
ume production (TVP), but improved its safety. Mixed-species Forests. Ecology and Management. Berlin,
(iii) The very heavy early thinning from below in Heidelberg, Springer: 433–501.
treatment 2 promoted development of the great- Blackburn P., Petty J.A. (1988): Theoretical calculations of
est standing volume and TVP in the large trees the influence of spacing on stand stability. Forestry: An
exceeding 0.5 m3. This treatment is appropriate International Journal of Forest Research, 61: 235–244.
where trees are threatened by snow load and Černý M., Pařez J., Malík Z. (1996): Růstové a taxační tabulky
wind. The trees left on the site develop as large hlavních dřevin České republiky. Jílové u Prahy, IFER: 245.
ones in a short time whereas logging and skid- Choat B., Jansen S., Brodribb T.J., Cochard H., Delzon S.,
ding operations are minimized. Bhaskar R., Bucci S.J., Feild T.S., Gleason S.M., Hacke
(iv) The delayed first thinning from below in treat- U.G., Jacobsen A.L., Lens F., Maherali H., Martinez-Vilalta
ments 3 and 4 poses the advantage of the larger J., Mayr S., Mencuccini M., Mitchell P.J., Nardini A., Pit-
mean volume of removed trees. The differences termann J., Pratt B.R., Sperry J.S., Westoby M., Wright I.J.,
between the treatments were negligible for all Zanne A.E. (2012): Global convergence in the vulnerability
parameters studied – the wider skid trails in of forests to drought. Nature, 491: 752–755.
treatment 4 did not affect wood increment nega- Chroust L. (1981): Bericht über die IUFRO – Versuchsfläche
tively. This thinning approach is appropriate for Nr. 14. In: Der Europäische Stammzahlversuch in Fichte
most sites excluding the extremely threatened (Picea abies Karst.). Freiburg i. Breisgau, IUFRO: 227–238.
sites such as water-logged ones. (in German)
(v) The “commercial” treatment 5 (thinning from Domke G.M., Oswalt C.M., Woodall C.W., Turner J.A. (2013):
above) showed both the lowest standing volume Estimation of merchantable bole volume and biomass
192Journal of Forest Science, 67, 2021 (4): 185–194 Original Paper
https://doi.org/10.17221/188/2020-JFS
above sawlog top in the National Forest Inventory of the Vedecké studie 3/1995, Zvolen, Technická univerzita vo
United States. Journal of Forestry, 111: 383–387. Zvolene: 39. (in Slovak)
Dušek D., Slodičák M., Novák J., Kacálek D. (2015): Vliv šířek Korsuň F. (1961): Hmotové tabulky pro smrk. Lesnictví, 7:
linek na produkci smrkových porostů. Zprávy lesnického 275–304. (in Czech)
výzkumu, 60: 171–176. (in Czech) Kuliešis A., Saladis J. (1998): The effect of early thinning on the
Gizachew B., Brunner A. (2011): Density-growth relation- growth of pine and spruce stands. Baltic Forestry, 4: 8–16.
ships in thinned and unthinned Norway spruce and Scots Laurent M., Antoine N., Joël G. (2003): Effects of different
pine stands in Norway. Scandinavian Journal of Forest thinning intensities on drought response in Norway spruce
Research, 26: 543–554. (Picea abies (L.) Karst.). Forest Ecology and Management,
Gizachew B., Brunner A., Øyen B-H. (2012): Stand re- 183: 47–60.
sponses to initial spacing in Norway spruce plantations Lekes V., Dandul I. (2000): Using airflow modelling and
in Norway. Scandinavian Journal of Forest Research spatial analysis for defining wind damage risk classifi-
Volume, 27: 637–648. cation (WINDARC). Forest Ecology and Management,
Hein S., Herbstritt S., Kohnle U. (2008): Auswirkung der Z- 135: 331–344.
Baum-Auslesedurchforstung auf Wachstum, Sortenertrag Lindner M., Maroschek M., Netherer S., Kremer A., Barbati
und Wertleistung im europäischen Fichten-Stammzahlver- A., Garcia-Gonzalo J., Seidl R., Delzon S., Corona P.,
such (Picea abies [L.] Karst.) in Südwestdeutschland. Allge- Kolström M., Lexer M.J., Marchetti M. (2010): Climate
meine Forst- und Jagdzeitung, 179: 192–201. (in German) change impacts, adaptive capacity, and vulnerability of
Herbstritt S., Kohnle U., Abetz P., Kenk G. (2006): The Eu- European forest ecosystems. Forest Ecology and Manage-
ropean stem number experiment in Norway spruce (Picea ment, 259: 698–709.
abies (L.) Karst.). 3. Report. Baden-Württemberg, Forstli- Liziniewicz M., Ekö P.M., Klang F. (2016): Effects of five tree-
che Versuchs- und Forschungsanstalt: 132. selection strategies when thinning spruce (Picea abies)
Hlásny T., Holuša J., Štěpánek P., Turčáni M., Polčák N. stands: a case study in a field trail in southern Sweden.
(2011): Expected impact of climate change on forests: Scandinavian Journal of Forest Research, 31: 495–506.
Czech Republic as a case study. Journal of Forest Science, Maccurrach R.S. (1991): Spacing: an option for reducing
57: 422–431. storm damage. Scottish Forestry, 45: 285–297.
Hlásny T., Mátyás C., Seidl R., Kulla L., Merganovičová K., Mäkinen H., Isomäki A. (2004): Thinning intensity and
Trombik J., Dobor L., Barcza Z., Konôpka B. (2014): Cli- growth of Norway spruce stands in Finland. Forestry: An
mate change increases the drought risk in Central European International Journal of Forest Research, 77: 349–364.
forests: What are the option for adaptation? Lesnícky Mäkinen H., Hein S. (2006): Effect of wide spacing on incre-
časopis – Forestry Journal, 60: 5–18. ment and branch properties of young Norway spruce.
Horák J., Novák J. (2009): Effect of stand segmentation on European Journal of Forest Research, 125: 239–248.
growth and development of Norway spruce stands. Journal Maracchi G., Sirotenko O., Bindi M. (2005): Impact of
of Forest Science, 55: 332–339. present and future climate variability on agriculture
Jandl J., Spathelf P., Bolte A., Prescott C.E. (2019): Forest and forestry in the temperate regions: Europe. Climate
adaptation to climate change – is non-management an Change, 70: 117–135.
option? Annals of Forest Science, 76: 1–13. Mason W.L., Petr M., Bathgate S. (2012): Silvicultural strate-
Katrevičs J., Džerina B., Neimane D., Desaine I., Bigača Z., gies for adapting planted forests to climate change: from
Jansons A. (2018): Production and profitability of low den- theory to practice. Journal of Forest Science, 58: 265–277.
sity Norway spruce (Picea abies (L.) Karst.) plantation at Müller F., Augustynczik A.L.D., Hanewinkel M. (2019):
50 years of age: case study from eastern Latvia. Agronomy Quantifying the risk mitigation efficiency of changing
Research 16: 113–121. silvicultural systems under storm risk throughout history.
Konôpka J., Konôpka B. (2017): Výchova smrekových poras- Annals of Forest Science, 76: 1–16.
tov z hľadiska statickej stability na výskumných plochách Milne R. (1995): Modelling mechanical stresses in living Sitka
IUFRO – Biely Váh (Slovensko). Zprávy lesnického výz- spruce stems. In: Coutts M.P., Grace J. (eds.): Wind and
kumu, 62: 223–233. (in Slovak) Trees. Cambridge, Cambridge University Press: 165–181.
Konôpka J., Petráš R., Toma R. (1987): Štíhlostný koeficient Näslund M. (1937): Die Durchforstungsversuche der For-
hlavných drevín a jeho význam pri statickej stabilite po- stlichen Versuchsanstalt Schwedens in Kiefernwald. In:
rastov. Lesnictví, 33: 887–904. (in Slovak) Meddelanden fran Statens Skogsförsöksanstalt. Mit-
Korpeľ Š., Saniga M. (1995): Vplyv rozdielneho počtu sadeníc teilungen aus der Forstlichen Versuchsanstalt Schwedens.
a ich sponu na rast a formovanie smrekových porastov. Stockholm, Esselte AB: 121–169. (in German)
193Original Paper Journal of Forest Science, 67, 2021 (4): 185–194
https://doi.org/10.17221/188/2020-JFS
Navratil S. (1995): Minimizing Wind Damage in Alternative Rollinson T.J.D. (1988): Respacing Sitka spruce. Forestry: An
Silviculture Systems in Boreal Mixedwoods. Canada- International Journal of Forest Research, 61: 1–22.
Alberta Partnership Agreement in Forestry Report 124. Slodičák M., Novák J. (2006): Silvicultural measures to
Edmonton, Canadian Forestry Service: 86. increase the mechanical stability of pure secondary Nor-
Neumann M., Rössler G. (2012): Die Wuchsleistung auf Dauerver- way spruce stands before conversion. Forest Ecology and
suchen: Nutzholz-Biomasse-Nährstoffe. In: Nagel J.: Deutscher Management, 224: 252–257.
Verband Forstlicher Forschungsanstalten. Sektion Ertrag- Slodičák M., Novák J. (2007): Růst, struktura a statická
skunde, Ottenstein, May 21–23, 2012: 93–101. (in German) stabilita smrkových porostů s různým režimem výchovy.
Pape R. (1999a): Effects of thinning regime on the wood Kostelec nad Černými lesy, Lesnická práce: 128.
properties and stem quality of Picea abies. Scandinavian Slodičák M., Novák J., Skovsgaard J.P. (2005): Wood produc-
Journal of Forest Research, 14: 38–50. tion, litter fall and humus accumulation in a Czech thinning
Pape R. (1999b): Influence of thinning and tree diameter experiment in Norway spruce (Picea abies (L.) Karst.).
class on the development of basic density and annual Forest Ecology and Management, 209: 157–166.
ring width in Picea abies. Scandinavian Journal of Forest Štefančík I., Strmeň S., Podrázský V., Vacek S. (2012): Growth
Research, 14: 27–37. responses of a Norway spruce (Picea abies [L.] Karst.) small
Pařez J. (1981): Internationaler europäischer IUFRO – Durch- pole-stage stand in a region exhibiting extensive decline
forstungsversuch Nr. 13 im Forstbetrieb Vítkov – ČSSR. In: of allochthonous spruce forests to differentiated thinning.
Der Europäische Stammzahlversuch in Fichte (Picea abies Folia Oecologica, 39: 77–87.
Karst.). Freiburg i. Breisgau, IUFRO: 207–225. (in German) Tatarinov F.A., Cienciala E. (2009): Long-term simulation
Pettersson N. (1993): The effect of density after precommer- of the effect of climate changes on the growth of main
cial thinning on volume and structure in Pinus sylvestris Central-European forest species. Ecological Modelling,
and Picea abies stands. Scandinavian Journal of Forest 220: 3081–3088.
Research, 8: 528–539. Viewegh J., Kusbach A., Mikeska M. (2003): Czech forest eco-
Pfister O., Wallentin C., Nilsson U., Ekö P.M. (2007): Effects system classification. Journal of Forest Science, 49: 85–93.
of wide spacing and thinning strategies on wood quality in Vicena I. (1964): Ochrana proti polomům. Praha, Státní
Norway spruce (Picea abies) stands in southern Sweden. zemědělské nakladatelství: 178.
Scandinavian Journal of Forest Research, 22: 333–343. Wallentin C., Nilsson U. (2014): Storm and snow damage in a
Pinheiro J., Bates D., DebRoy S., Sarkar D., R Core Team Norway spruce thinning experiment in southern Sweden. For-
(2020): nlme: Linear and Nonlinear Mixed Effects Models. estry: An International Journal of Forest Research, 87: 229–238.
R Package Version 3.1-150. Available at: https://cran.r- Wang Y., Titus S.J., LeMay V.M. (1998): Relationships between
project.org/package=nlme tree slenderness coefficients and tree or stand charac-
Pretzsch H. (2009): Forest dynamics, growth and yield. Berlin, teristics for major species in boreal mixedwood forests.
Heidelberg, Springer: 664. Canadian Journal of Forest Research, 28: 1171–1183.
Rennenberg H., Loreto F., Polle A., Brilli F., Fares S., Beniwal
Received: November 3, 2020
R.S., Gessler A. (2006): Physiological responses of forest
Accepted: January 25, 2021
trees to heat and drought. Plant Biology, 8: 556–571.
194You can also read