NTG Morning Comments www.nesvick.com - Monday, June 14, 2021 - Nesvick Trading Group
←
→
Page content transcription
If your browser does not render page correctly, please read the page content below
Monday, June 14, 2021
NTG Morning Comments
www.nesvick.com
Weather
The weekend weather maps followed-through on
initial hints from late last week that the deferred
outlook was building better precipitation chances for
the Corn Belt. We should see mostly dry conditions
for another couple of days, but we should start to see
rainfall chances improve by Thursday with significant
rainfall chances developing during both the 6-10 and
11-15 day period. The 7-day QPF is shown at the right
and the vast majority of that rainfall in the Corn Belt
develops in the second half of the time frame. Odds
are that coverage of rainfall in the Corn Belt is a bit
overstated, but it is possible that actual rainfall
amounts in some areas could be understated. Note
the big rains shown along the Gulf Coast on the map.
These will come with a tropical system that will make
landfall probably sometime on Saturday with the
system moving east/northeast from there.
The 8-14 day map at the right that shows odds for
widespread above normal rainfall amounts through
the Corn Belt. Another big change in the forecast over
the weekend is a cooler outlook on temps. The 8-14
day map show to the right shows mostly near normal
temps for the vast majority of the growing regions.
The 6-10 day map actually features some below
normal temps possible for extreme northern portions
of the country.
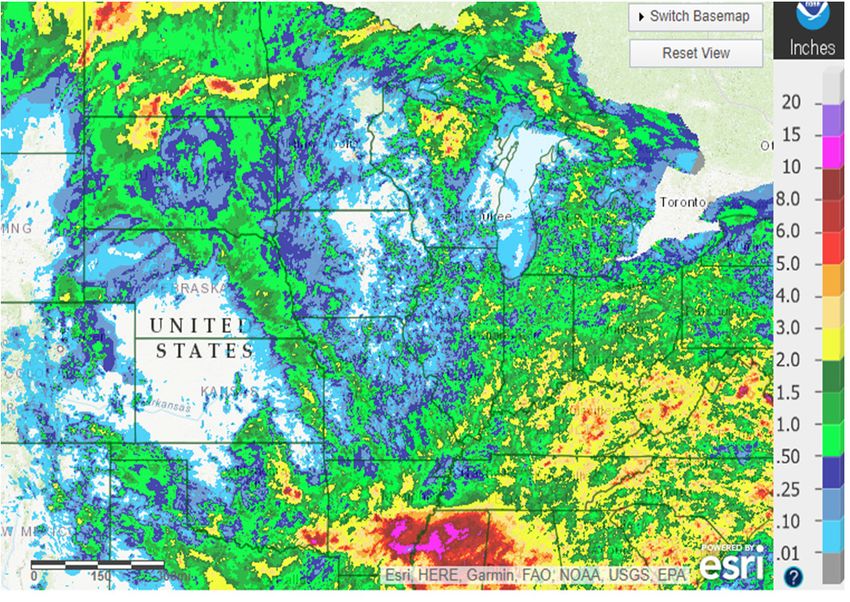
Map below shows precip over the past 7 days
1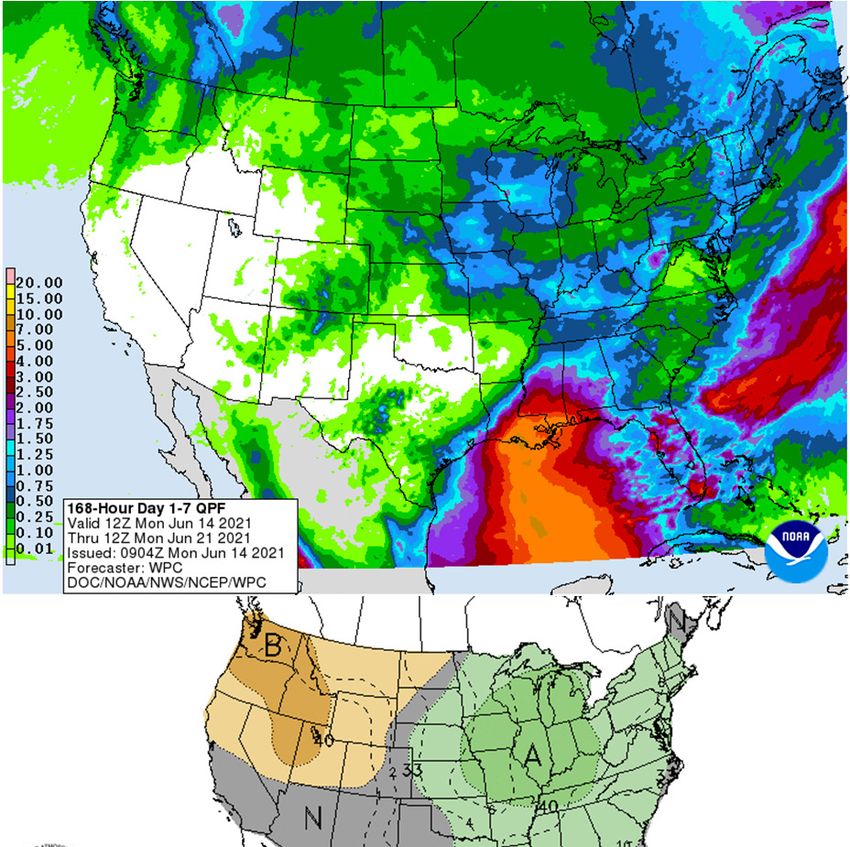
Monday, June 14, 2021
                                                                                       NTG Morning Comments
                                                                                            www.nesvick.com

Crops
Thought we’d take a quick look at 20/21 corn export potential this morning. Last week WASDE raised their corn
export projection by 75 mb to 2,850 which was widely expected. The question is whether they have more room
to increase or not. Based on the analysis below, I’d argue there is further upside to the corn export figure.

The table is simply enough. At the top we have Sep-May Census export figures. We don’t have an official
Census projection for May this year yet, so I’ve simply plugged in my best estimate based on inspections. Below
that we have a history of outstanding export sales at the beginning of June each year, followed by total JJA
exports. I then compare JJA actual exports vs the outstanding sales level.

Monthly Census Corn Exports
             10/11     11/12     12/13      13/14      14/15     15/16      16/17     17/18     18/19     19/20      20/21
Sep              174.7     121.7       92.1       80.9     159.8     132.5      245.5     138.6     208.3       80.7     149.7
Oct              135.8     125.5       68.6     130.5      144.5       93.3     142.7     107.3     222.7       90.8     145.0
Nov              141.4     159.0       60.2     138.9      103.4       75.4     159.8     102.1     199.8       97.5     150.5
Dec              159.7     172.9       54.3     138.7      117.2     103.4      155.5     140.3     170.2       99.8     181.8
Jan              112.0     139.5       53.6     118.5      128.2     106.3      182.5     151.2     183.7       98.2     228.6
Feb              131.1     131.8       55.5     135.9      158.4     130.6      199.2     148.4     142.4     154.2      248.4
Mar              171.9     134.8       68.3     206.1      154.9     171.3      267.1     255.5     187.8     181.7      372.8
Apr              172.3     137.5       60.9     222.5      190.8     201.2      211.3     303.6     215.4     199.1      334.6
May              166.0     129.0       55.7     208.9      190.2     188.4      210.9     309.8     184.6     224.4      350.0

Out. Sales       391.0     304.0      133.3     487.3     430.5      577.8     430.6     641.6      309.7     428.4     645.1

Jun              148.8     115.4       45.8     188.9     166.0      240.1     194.1     280.2      120.8     198.2
Jul              164.8      95.0       59.7     179.2     200.3      232.2     186.5     266.4      113.5     171.0
Aug              151.3      80.5       56.8     168.5     156.5      222.9     137.6     230.0      111.2     178.7
JJA Total        464.9     290.9      162.3     536.6     522.8      695.2     518.2     776.6      345.5     547.9     754.1
                 119%       96%       122%      110%      121%       120%      120%      121%       112%      128%      117%

MY Total         1,830     1,543       731      1,918     1,870      1,898     2,293     2,433      2,060     1,774     2,915

If we were to take an average level of shipments relative to sales, we could ballpark JJA exports this year at
around 755 mb. That would lead to a total export figure just above 2.9 billion bushels. So, it seems likely to me
that the export projection likely has some further upside. Thoughts appreciated.

Livestock
We haven’t looked at basis in a while so I thought it’d be worth a quick glance this morning. The first chart
below looks at June cattle basis. You can see basis is still weaker than normal, but it has at least moved into a
somewhat “acceptable” level recently.

                                                               2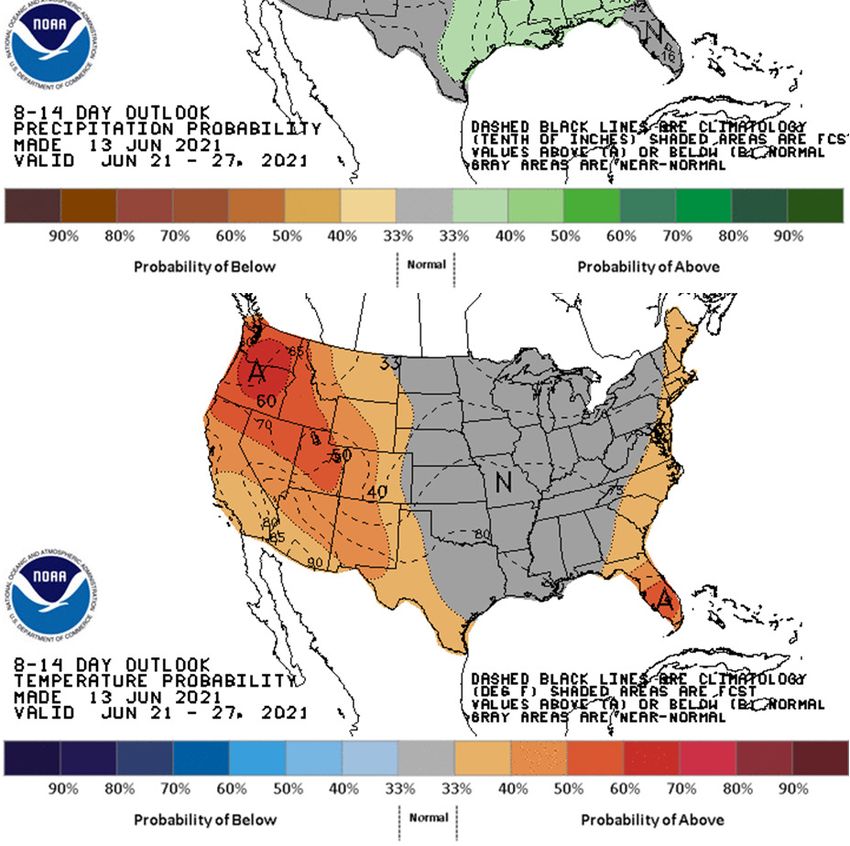
Monday, June 14, 2021
                                                                                                   NTG Morning Comments
                                                                                                        www.nesvick.com

                                                 June Live Cattle Basis History
         $30.00
         $25.00
         $20.00
         $15.00
         $10.00
          $5.00
          $0.00
         ($5.00)
        ($10.00)
        ($15.00)
                    52       47          42        37          32          27      22         17       12          7            2
                                                                    Weeks Til Expiration
                           2015          2016           2017            2018           2019          2020          2021

August basis follows below. I suppose you could say the same thing here. It remains weaker than normal but
not a mind-blowing outlier at this point at least.

                                                August Live Cattle Basis History
        $30.00

        $25.00

        $20.00

        $15.00

        $10.00

         $5.00

         $0.00

        ($5.00)

       ($10.00)

       ($15.00)
                   58 56 54 52 50 48 46 44 42 40 38 36 34 32 30 28 26 24 22 20 18 16 14 12 10 8                        6    4       2   0
                                                                 Weeks To Expiration
                    2014          2015           2016           2017        2018              2019          2020           2021

                                                                       3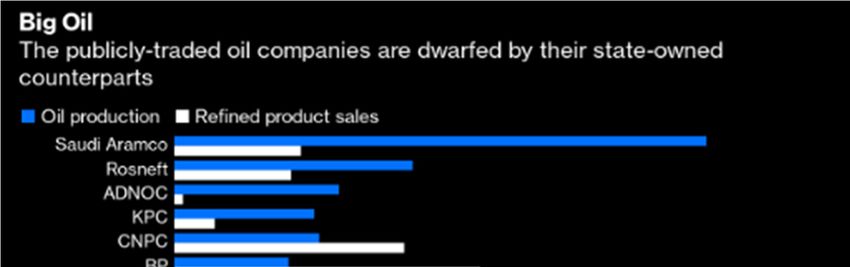
Monday, June 14, 2021
                                                                               NTG Morning Comments
                                                                                    www.nesvick.com

It sounds like cash cattle volume last week was pretty solid. Our friends at MP Agrilytics note it could be the
largest volume since November. Early calls for cash trade this week are for steady prices. Beef prices were soft
last week and this could be the start of the typical seasonal decline…but then again seasonal patterns have not
been very useful in the past two years.

Financials
A lot of talk about Fed tapering around, which of course makes sense. There are a lot of signals suggesting the
Fed’s massive asset purchasing program is running a bit too aggressively right now in addition to the inflation
figures. What I think is interesting about the past few weeks is the market’s perception on rate hikes appears to
have changed fairly dramatically too. The chart below looks at Fed Fund futures implied rate hikes for 2021,
2022, and 2023. Clearly the market is not looking for any change off zero for rates this year, which of course
makes sense. You can see the market is not even pricing in a “full” 25 bps rate hike for 2022 either. However,
note how rate hike expectations for 2023 have jumped in the past 2-3 weeks. For the past several months the
market was pricing in full odds for one 25 bps rate hike, but in the past few weeks it has quickly priced in
another rate hike. I would argue that this is likely the main reason for the dollar’s consolidation in the past
several weeks. It also opens up possible surprises for the market here if the Fed continues to stick with its script.

                                  Fed Fund Futures Implied Rate Change By Year
                                                                                                        0.65
                                                                                                        0.60
                                                                                                        0.55
                                                                                                        0.50
                                                                                                        0.45
                                                                                                        0.40
                                                                                                        0.35
                                                                                                        0.30
                                                                                                        0.25
                                                                                                        0.20
                                                                                                        0.15
                                                                                                        0.10
                                                                                                        0.05
                                                                                                        0.00
                                                                                                        -0.05
    12/31/2020        1/31/2021        2/28/2021          3/31/2021      4/30/2021         5/31/2021

                                                   2021        2022   2023

Energy
An interesting opinion piece on Bloomberg from their oil analyst Julian Lee entitled “Bashing Big Oil Won’t Save
the Planet”. He notes that the “world’s biggest oil producers aren’t susceptible to the sort of shareholder
pressure that dealt blows to the managements of Exxon Mobil Corp and Chevron Corp last month, or the Dutch
court that forced Royal Dutch Shell Plc to revise its carbon-cutting plans. They tend to be state-owned or
controlled entities in countries where climate-change activists and ESG investors have little sway”.

                                                           4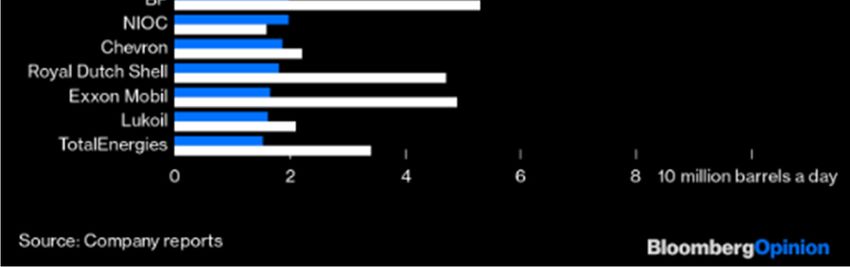
Monday, June 14, 2021
                                                                               NTG Morning Comments
                                                                                    www.nesvick.com

He adds, “that is why we can’t tackle climate problems simply by forcing publicly-listed oil companies to pump
less of it. As long as there is demand for oil, someone will supply it.”

Further: “Until reliable and affordable electric cars, vans, and trucks are available widely, along with the
infrastructure to charge them, there will always be someone willing to provide the fuel to keep the old stock
running. Not to mention our dependence on space heating, industrial heating, shipping and a whole host of
other areas that currently depend on fossil fuels”.

It is all pretty common sense, of course, but it points out the problem that many of the “activists” are going after
the oil companies before they have any viable options to replace them. That should make the oil market very
interesting for years to come.

Today’s Calendar (all times Central)
   • Export Inspections – 10:00am
   • Crop Progress – 3:00pm

Thanks for reading.
David Zelinski
dzelinski@nesvick.com
901-766-4684
Trillian IM: dzelinski@nesvick.com

DISCLAIMER:
This communication is a solicitation for entering into derivatives transactions. It is for clients, affiliates, and
associates of Nesvick Trading Group, LLC only. The information contained herein has been taken from trade and

                                                         5
Monday, June 14, 2021
                                                                               NTG Morning Comments
                                                                                    www.nesvick.com

statistical services and other sources we believe are reliable. Opinions expressed reflect judgments at this date
and are subject to change without notice. These materials represent the opinions and viewpoints of the
author and do not necessarily reflect the opinions or trading strategies of Nesvick Trading Group LLC and its
subsidiaries. Nesvick Trading Group, LLC does not guarantee that such information is accurate or complete and it
should not be relied upon as such.

Officers, employees, and affiliates of Nesvick Trading Group, LLC may or may not, from time to time, have long
or short positions in, and buy or sell, the securities and derivatives (for their own account or others), if any,
referred to in this commentary.

There is risk of loss in trading futures and options and it is not suitable for all investors. PAST RESULTS ARE NOT
NECESSARILY INDICATIVE OF FUTURE RETURNS. Nesvick Trading Group LLC is not responsible for any
redistribution of this material by third parties or any trading decision taken by persons not intended to view this
material.

                                                         6
You can also read