Observing Clouds and Earth's Radiation Budget from CERES: Recent Progress - Norman G. Loeb
←
→
Page content transcription
If your browser does not render page correctly, please read the page content below
Observing Clouds and Earth's Radiation
   Budget from CERES: Recent Progress

                   Norman G. Loeb
      NASA Langley Research Center, Hampton, VA

WCRP Grand Challenge Workshop: Clouds, Circulation and Climate Sensitivity
                     March 23-28, 2014, Germany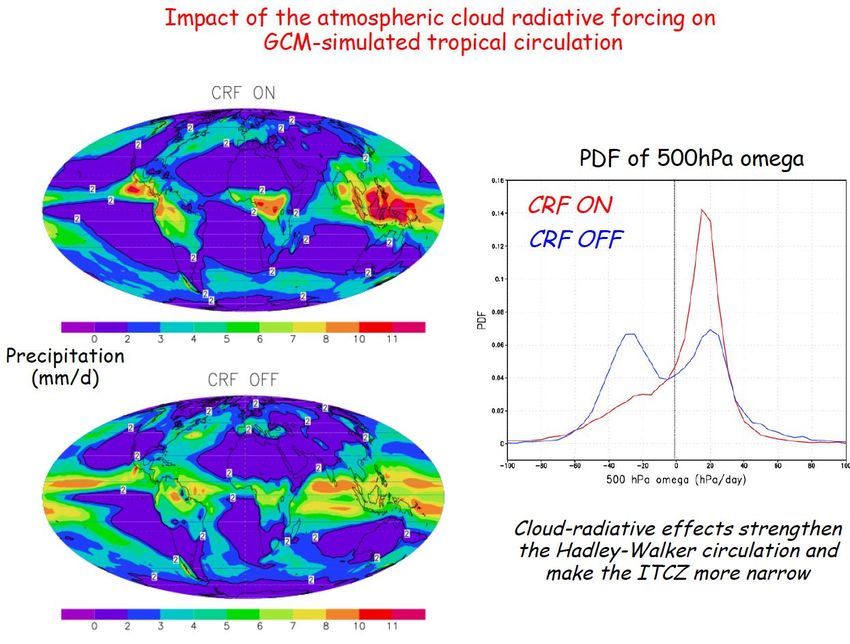
Outline
•   Improved Observation of Earth’s Radiation Budget
•   Using an Energetic Perspective to Observe Interannual Variations
    in Large-Scale Circulation
•   Co-Variability of Cloud Radiative Effects and Circulation in
    Observations
CERES Data Fusion: Net Radiative Effects of Clouds on Earth’s Radiation Budget

                                        Top-of-Atmosphere (-20.9 Wm-2)
                                      - SORCE-TIM: Solar Irradiance
                                      - CERES: Reflected Solar, Emitted Thermal Flux
                                      - MODIS: Cloud Detection & Properties
                                      - 5 Geo Satellites: Diurnal Cycle

                                              Within-Atmosphere (0.4 Wm-2)
                                            - MODIS: Aerosol & Cloud Properties
                                            - GMAO Reanalysis: Atmospheric State
                                            - Aerosol Assimilation
                                            - Constraints from: AIRS, CALIPSO,
                                              CloudSat

                                                   Surface (-21.3 Wm-2)
                                                 - MODIS: Surface albedo, emissivity
                                                   & temperature
                                                 - NSIDC: Snow, sea-ice coverage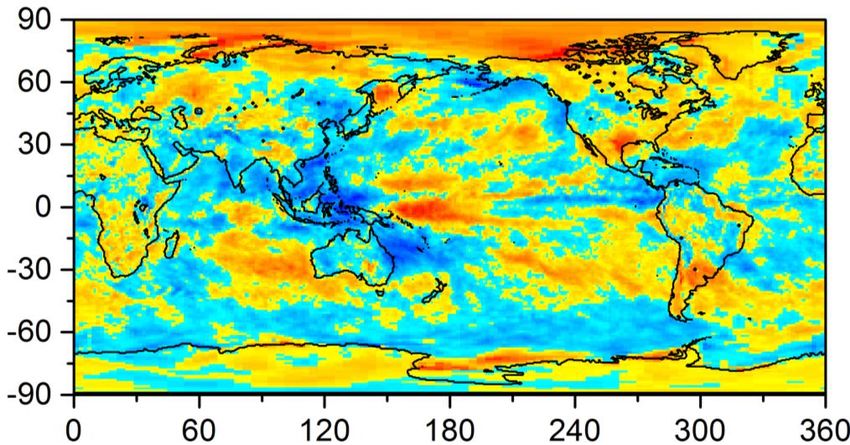
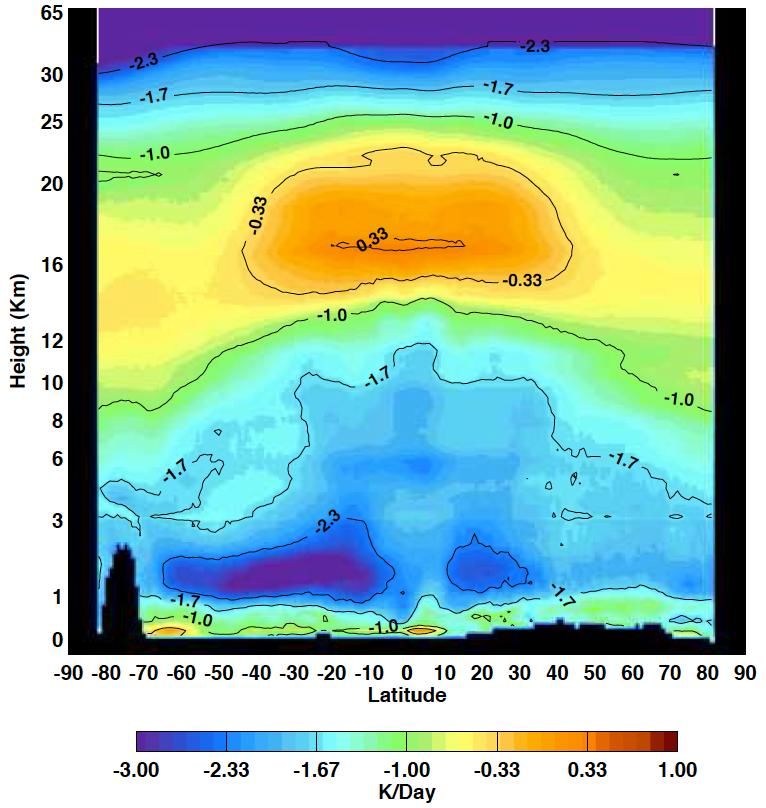
CALIPSO/Cloudsat/CERES/MODIS (CCCM) Annual and Zonal Mean
  Vertical Distribution of Longwave Atmospheric Heating Rate
           Clear-Sky                            All-sky

                                                       Seiji Kato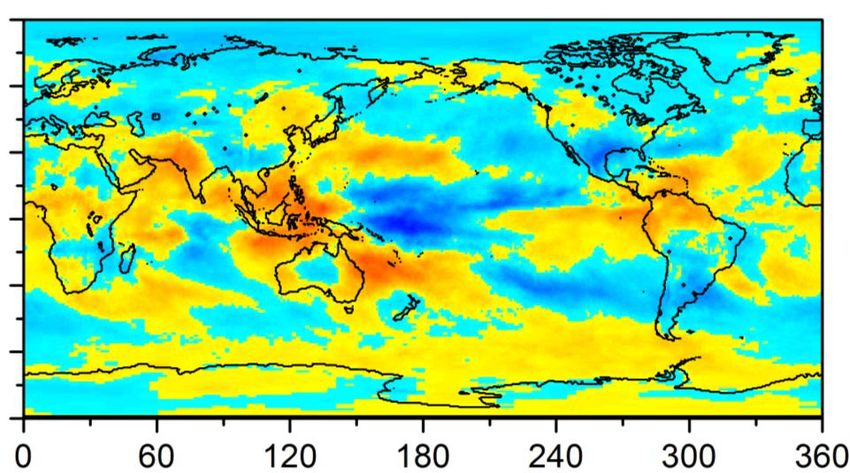
Global TOA All-Sky Radiation Anomalies
(CERES_EBAF_Ed2.8; 03/2000 – 10/2013)
TOA Radiation Changes (March 2000 – October 2013)
     Absorbed Solar              -Emitted LW

       Net Radiation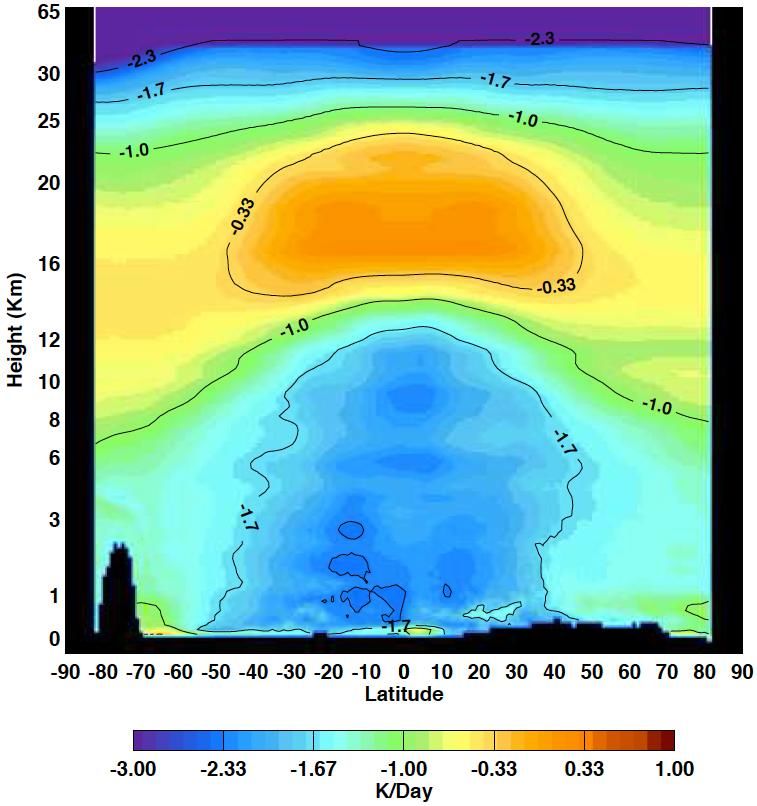
Validation of CERES EBAF-Surface Radiation

                49 Ocean Buoy Sites
                37 Land Sites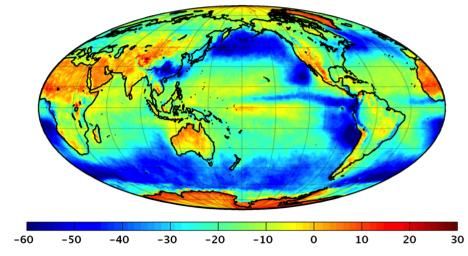
Monthly Anomalies in Downward Surface Flux from CERES EBAF & Surface Observations
                       (Approx. 30 Land and 19 Ocean sites)
     SW Land                                    SW Ocean

      LW Land                                   LW Ocean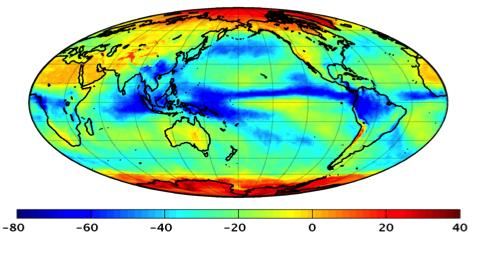
CERES EBAF Downward Surface Flux Comparison with Surface Observations

                                             • CERES EBAF surface fluxes are
                                               well within uncertainty of surface
                                               observations (~ 5 Wm-2)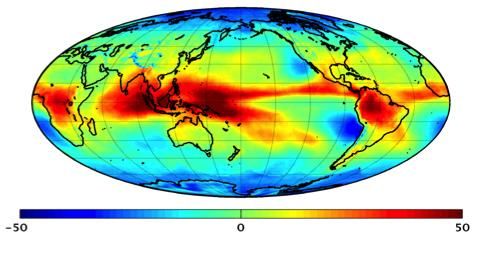
Using an Energetic Perspective to Observe Variations in
               Large-Scale Circulation
Dry Static Energy Budget
- On annual mean time-scale:
Ra = net atmospheric radiation (=Rtoa – Rsfc)
P = precipitation rate
L = Latent heat of vaporization
S = Surface sensible heat flux
H = Vertical integral of divergence of dry static and kinetic
energy.
where s=cp T + gz is the dry static energy and k is kinetic energy.Data Used
1) Reanalysis
- ERA-Interim monthly meridional wind profiles, surface
sensible heat flux, 500 hPa vertical velocity, vertical
integral of dry static energy divergence.
- MERRA V5.2: 500 hPa vertical velocity, vertical integral
of dry static energy divergence.
2) Satellite
- CERES EBAF Ed2.7 TOA and SFC radiation (March
2000-September 2012).
- GPCP V2.2, TRMM 3A12, TRMM 3B31 precipitation.Mass Weighted Zonal Mean Meridional Stream Function
(October 2011)Mean of Atmospheric Energy Budget Terms By Longitude (Mar 2000-Feb 2010)
SH Descending
Ascending
NH DescendingAverage (Stdev) in LP for GPCP V2.2, TRMM (3A12), TRMM (3B43) (March 2000-Sept 2012)
The three data products agree to:
• 3 Wm-2 (5%) in the SH descending branch
• 6 Wm-2 (12%) in the NH descending branch
• 22 Wm-2 (17%) in the ascending branch
• 12 Wm-2 (14%) for 30°S-30°N
Note: We cannot close the global atmospheric energy budget from observations to better
than -14 Wm-2.Interannual Anomalies in H: From Diabatic Heating vs Direct Calculations SH descending Ascending NH descending
Interannual Anomalies in H and w

SH descending

Ascending

NH descending
Co-Variability of Cloud Radiative Effects and
        Circulation in Observations
Regression Slope of Anomalies in Radiative Flux vs Anomalies in Circulation Strength (w*)
- Increase ascent in ascending branch
Reduced emission to space
TOA radiative warming
- Increase subsidence in descending branches
Increased emission to space
TOA radiative cooling
- Large contribution by cloud radiative effects
- Ascending branch: Clear-sky LW radiative cooling
balanced by radiative warming by clouds
- Lack of CRE sensitivity to w* at surface
Is co-variation associated with high clouds?Slope of monthly anomalies in cloud frequency of occurrence against monthly anomalies in ω*
Regression Slope of Anomalies in Radiative Flux vs Anomalies in Circulation Strength (w*)
Do Cloud Radiative Effects Enhance HC Strength?

- As HC circulation strength increases (i.e., ω* increases), clouds enhance
  atmospheric radiative cooling in the descending branches but oppose it in the
  ascending branch.

- This enhances the latitudinal gradient in diabatic heating, potentially leading
  to an increase in HC strength.

- However, the cloud response also influences convective latent heating in the
  tropics by altering the dry and moist static stability of the atmosphere.

-    Owing to the close coupling between CREs, moist convection and circulation
    strength, it is exceedingly difficult to draw conclusions about the magnitude of
    the feedback between clouds and HC strength from satellite observations
    alone.
Bony, 2007
Discussion
• By the end of the 5-10 year time-frame of this Grand Challenge, we
  will have collected 20-25 years of global CERES+MODIS/VIIRS and
  other observations.
• How can we best utilize these data to advance our understanding of
  cloud-circulation-climate coupling?
• Comparisons between models and observations need to move
  beyond regional monthly mean.
• Consider interannual to decadal change, co-variability amongst
  variables that influence energy budget and radiative fluxes, latent
  heating, etc.
END
- Five CERES instruments on 3 satellites (Terra, Aqua, SNPP) are flying.
- FM6 will be fly on JPSS-1 in 2016 and the CERES Follow-on (RBI) will fly on JPSS-2 in 2021.
Mean Cloud Fraction (MODIS)

                     N.A. Sc

                               S.A. Sc
Twelve-month running average of global mean Ra+S and LP, H • Despite -14 Wm-2 imbalance in global atmospheric energy balance, interannual variations in LP and Ra are consistent. • Largest discrepancies occur at extrema in LP (2005 and 2012). • During stronger ENSO conditions, Ra+S and LP track one another closely.
Average (March 2000 – February 2010) Ra, LP, S and H from Satellite Obs & Reanalysis
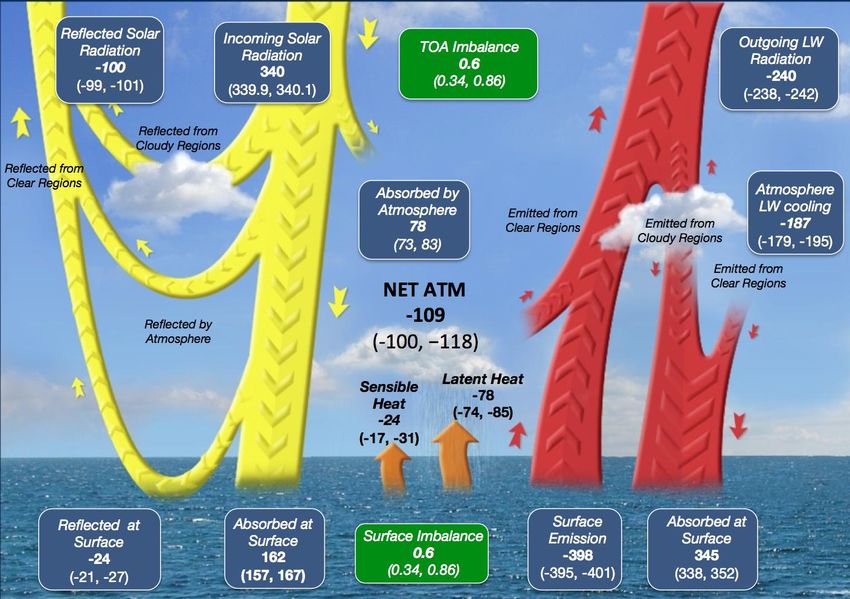
Earth’s Energy Budget (1s Range)

The radiative imbalance between the surface and atmosphere determines how much
energy is available to drive the hydrological cycle and the exchange of sensible heat
between the surface and atmosphere.
Slope of Anomalies in Ra, LP and S against Anomalies in w*

          dRa vs dw
                                                     - Sensitivity of LP to ω* is 4-5 times greater than
                                                       between Ra and ω* in the descending
                                                       branches, but 20 times greater in the
                                                       ascending branch.
                                                     - Global LP constrained by radiative cooling.

          dLP vs dw                                  - 20% of the global LP variability is explained by
                                                       LP variations in the ascending branch.
                                                     - 20-25% of the global variability in Ra is
                                                       explained by Ra variations in the descending
                                                       branches.
                                                     =>Stronger HC thus contributes to enhanced
          dS vs dw                                     global radiative cooling and latent heating at
                                                       interannual timescales.

- For convenience, w is defined as positive up in ascending branch and positive down in
  descending branches.
Mean (March 2000-February 2010) TOA LW CRE and SW CRE TOA LW CRE (January) TOA LW CRE (July) TOA SW CRE (January) TOA SW CRE (July) Solid lines show boundaries of ascending and descending branches of the Hadley circulation.
Relationship Between H and Mid-Tropospheric Vertical Velocity
- In the zonal mean, the vertical advective component dominates
  (Muller and O’Gorman, 2011), so that changes in the divergence of
  energy transport depend upon changes in mean vertical velocity,
  mean dry static stability, and their covariance:

                    “Dynamic      “Thermodynamic
                   Component”       Component”
Evaluation of Hadley Circulation Boundaries
Zonal Mean CERES LW CRE for January Annual Cycle of HC Boundaries &
LW CRE Extrema
- Minima in LW CRE correspond to the latitude where subsidence reaches a maximum.
- Maximum LW CRE corresponds to the latitude of maximum convection (ITCZ).
- Both track positions of HC boundaries.
- The variability in descending branches is smallest in the wintertime when the HC is
strongest (evident from the error bars).Twelve-month Running Average of Latitudinal Distance Between Positions of NH and SH
Subtropical Minima in LW CRE
- Width between the positions of NH & SH subtropical maximum subsidence is greater during
La Niña (expansion of HC) and smaller (contraction of HC) during El Niño conditions.Colocated PR and CloudSat Rain Rate Distributions
• Justification in Stephens et al (2012) for increasing Latent Heat Flux is based upon
comparisons between CloudSat and TRMM PR in tropics.
- TRMM PR misses approximately 10% of total rain.
Berg et al. (2010)Collocated PR and CloudSat Rain Rate Distributions
(Updated Analysis)
• CloudSat data reprocessed with Lebsock
• TRMM PR V7 released.
- TRMM PR now misses approximately 5% of total rain.
- GPCP is consistent with TRMM PR V7 in tropics.
- Larger uncertainty at mid-to-high latitudes (GPM will help quantify uncertainty).
Berg (personal communication)Surface Observed Irradiance Data Providers*
Land & Island Locations Number Of Sites; Web Site
Baseline Surface
Radiation Network Many generous institutions! 20 www.bsrn.awi.de
(BSRN)
Atmospheric Radiation
US Dept. of Energy Measurement Program 9 www.arm.gov
(ARM)
NOAA - Global
Surface Radiation Network www.esrl.noaa.gov/gmd
Monitoring Division 8
(SURFRAD) /grad/field.html
(GMD)
Ocean Buoys
NOAA - Pacific Marine
Buoy Data: PIRATA, RAMA & www.pmel.noaa.gov/ta
Environmental Labs 46
TAO buoy arrays o/index.shtml
(PMEL)
Woods Hole Upper Ocean Processes
uop.whoi.edu/projects/
Oceanographic Group: NTAS, WHOTS, & 3
projects.htm
Institute (WHOI) Stratus Long Term Buoys
*All sites do not have continuous data records over the 12 year EBAF time period.Twelve-month running average of the heat budget terms SH Desc Ascend NH Desc
GPCP minus TRMM (3A12) LP difference (March 2000-September 2012)
  SH branch                             Ascending branch

  NH branch                            30°S-30°N
Difference in AIRS minus CERES trend < 0.2 Wm-2 per decade

                  Susskind’s Oct 15, 2013 Cancelled AIRS STM presentation
You can also read