Oishi Group Analyst Meeting Q4/2019 - For the period of July - Sep 2019
←
→
Page content transcription
If your browser does not render page correctly, please read the page content below
Oishi Group
              Analyst Meeting
                      Q4/2019

For the period of July - Sep 2019

                   Nov 26th , 2019

                                     1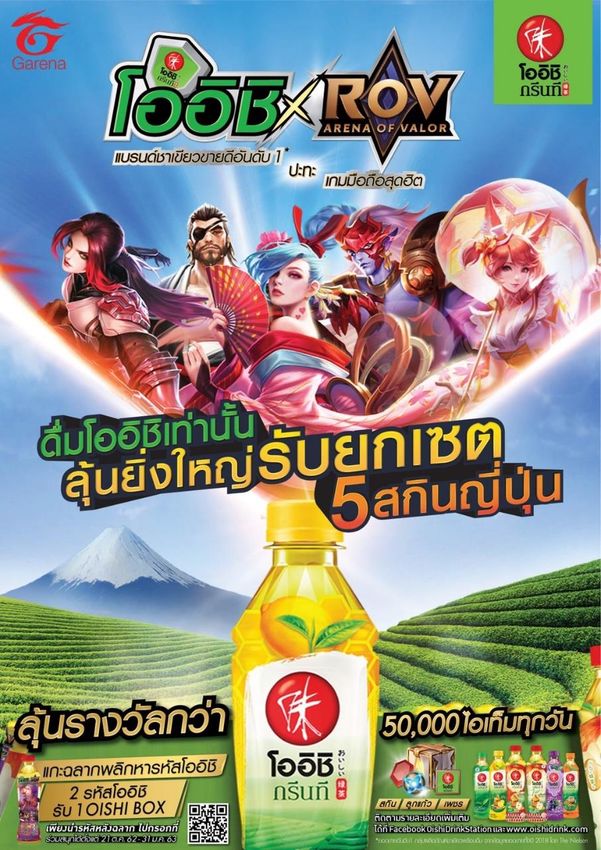
Disclaimer

•   This presentation may include information which is forward-looking in nature. Forward-looking information involve known and unknown risks, uncertainties and other
    factors which may impact on the actual outcomes, including economic conditions in the markets in which Oishi Group Public Company Limited and its Subsidiaries (“OISHI”)
    operate and general achievement of OISHI business forecasts, which will cause the actual results, performance or achievements of OISHI to differ, perhaps materially, from
    the results, performance or achievements expressed or implied in this presentation.

•   The information in this presentation has not been independently verified. No representation, warranty, express or implied, is made as to, and no reliance should be placed
    on, the fairness, accuracy, completeness or correctness of the information and opinions in this presentation. None of the OISHI or any of its agents or advisors or any of their
    respective affiliates, advisors or representatives, shall have any liability (in negligence or otherwise) for any loss howsoever arising from any use of this presentation or its
    contents or otherwise arising in connection with this presentation.

•   This presentation and all other information, materials or documents provided in connection therewith, shall not, either in whole or in part be reproduced or recirculated
    with out written consent from OISHI, save in strict compliance with all applicable laws.

                                                                                                                                                                                    2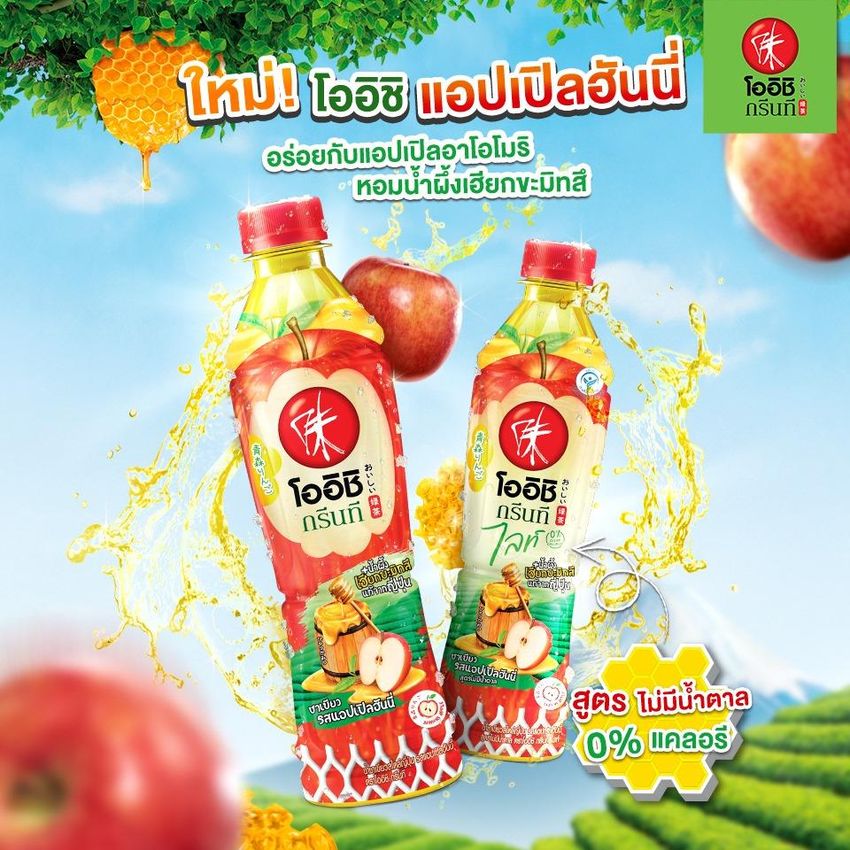
Agenda

         4Q19 and Full Year’s Financial Performances

         Beverage Business

         Food Business

         Strategy & Outlook

                                                       3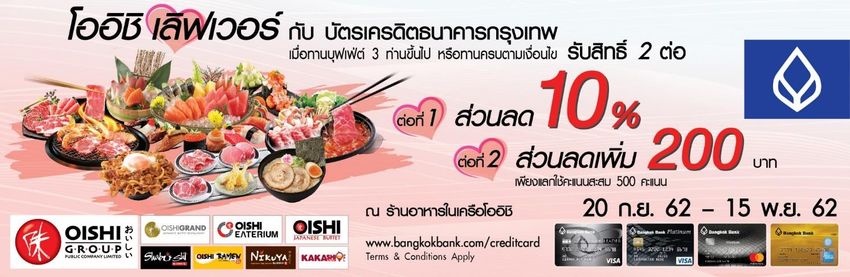
Key Events in the Past
Sep 2017    •   Excise Tax and Sugar Tax are imposed on Ready-to-drink Tea (RTD Tea) Category
Nov 2017    •   Increase in Retailed Price of Green tea across all products as a result of Excise Tax
            •   Fire incident at Navanakorn which impacted UHT Beverage capacity
Dec 2017    •   Revisit menu offerings and price adjustments for “Oishi Grand” from THB895 net to THB995 net
Mar 2018    •   Launched 350ml PET at THB15/bottle in traditional trade channel to fill in the gap of price
                structure
July 2018   •   Completed partial bond repurchase of THB 299.3 mn due to the company’s abundant of cash
                liquidity
Oct 2018    •   Relaunched Core Flavour, Oishi Green Tea Honey Lemon with Hyakkamitsu Honey and Launched
                new flavor, Honey Double Lemon with Hyakkamitsu Honey
Dec 2018    •   Launched Oishi Gold, premium tea
            •   Resumption of UHT Beverage Capacity at Navanakorn
            •   Repayment of matured bond amounted THB700.7 mn
Feb 2019    •   Launched Packaged Food’s one brand, “Oishi Eato”
July 2019   •   Paid back matured bond of THB 1,000 mn

                                                                                                              4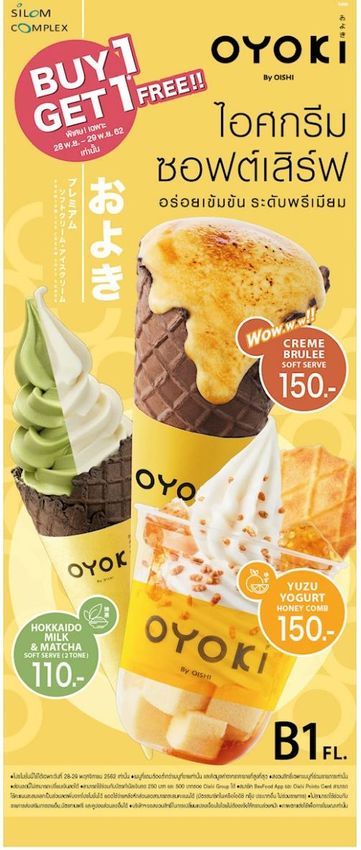
Financial Snapshots: 4Q19 and FY2019
                                              Quarter (Jul - Sep)                          Year (Oct – Sep)
(THB mn)                              4Q19          4Q18        % Change        FY19            FY18          % Change
 Revenue
 Beverage                               1,400        1,213           +15.4%       6,501           5,986          +8.6%
 Food                                   1,744        1,757            -0.7%       7,130           6,610          +7.9%
 Total                                  3,144        2,970            +5.9%      13,631          12,596          +8.2%
 Net Profit
 Beverage                                  61           47           +30.1%          869              772       +12.6%
 Food                                      23          129           -82.2%          360              236       +52.4%
 Total                                     84          176           -52.4%        1,229            1,008       +21.9%
 Normalized Net Profit (excluded extraordinary item)
 Beverage                                  61           47           +30.1%          875              772       +13.4%
 Food                                      23          129           -82.2%          376              287       +30.9%
 Total                                     84          176           -52.4%        1,251            1,059       +18.1%
(THB mn)                                                    Sep-19               Sep-18                 % Change
Balance Sheet Items
Total Asset                                                           8,407                 9,680                -13.2%
Interest-bearing debt                                                    0                  1,701               -100.0%
Total Liabilities                                                     1,768                 3,690                -52.1%
Total Equity                                                          6,640                 5,990                +10.8%

 The company’s capital structure is considered very strong with zero interest-bearing debt. Normal Operational
 funding in the near future is expected to be able to funded by internal cashflow.
                                                                                                                     5
Financial Performances: Beverage
                                          Sales and Services Revenue
 8,0 00

            7,054                                                   THB mn              •    4Q19’s beverage revenue improved
 7,0 00

                    5,986 6,501                                                              by 15.4% YoY, supported by growth
 6,0 00
                                                                                             in both domestics and export
 5,0 00

                                                                                             segments
                                                                                        •    The premium product, Oishi Gold
 4,0 00

                                                      1,799 1,400
                                    1,213 1,618 1,684
 3,0 00

 2,0 00
                                                                                             Genmaicha, launched at 7-11 since
 1,0 00
                                                                                             Aug-19 is well received by customers
     0

                                                                                        •    Also, the UHT OEM lines recovered
            2017 2018 2019          4Q18 1Q19 2Q19 3Q19 4Q19                                 its operation since Apr-19 after the
                                                                                             fire incident impact

                                    Normalized Net Profit and Margin
                                                                    THB mn          •       Beverage net profit in 4Q19
            17.5%                                           18.1%                           improved by 30.1% YoY
                    12.9%   13.5%           13.2%   16.3%
   2,6 00

                                                                                    •       In 4Q19, the company managed to
   2,1 00
                                    3.9%                            4.4%   14. 0%

                                                                                            lower A&P spending by using more
                                                                                            effective marketing campaigns.
                                                                           4.0 %

   1,6 00

            1,233
                            875                                                     •       There are overhauls of two
                                                                           -6.0%

   1,1 00

                    772
                                                                                            production lines resulting in higher
                                                                           -16.0%

     600

                                            214     275     325*    61
                                     47                                    -26.0%

                                                                                            cost per unit and expenses
                                                                                    •       Promotion and trade discounts to
     100

                                                                           -36.0%

    -400

            2017 2018 2019          4Q18 1Q19 2Q19 3Q19 4Q19
                                                                           -46.0%

                                                                                            drive sales volume and prepare for
                                                                                            NPD launch partly affected
                                                                                            profitability in 4Q19
                                                                                                                                    6
Note: * Normalized net profit with extraordinary item adjustment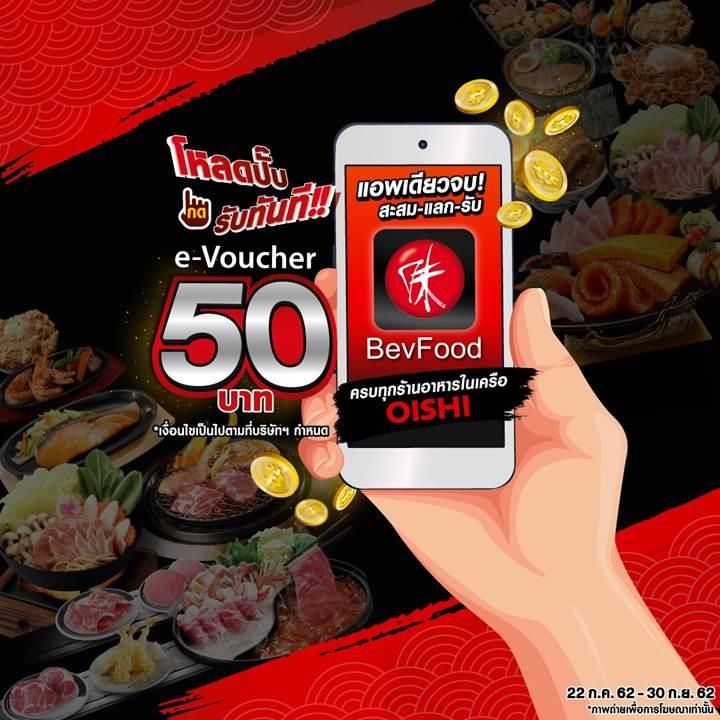
Financial Performances: Food
                                         Sales and Services Revenue
                                                                     THB mn          •   Food revenue was about flat YoY
                        7,130
            6,497 6,610
   8,0 00

   7,0 00
                                                                                         in 4Q19
   6,0 00

                                                                                     •   The company continued to open
                                                                                         new restaurant outlet this
   5,0 00

   4,0 00

                                                                                         quarter. However, Same-Store-
                                     1,757 1,748 1,798 1,840 1,744
   3,0 00

   2,0 00
                                                                                         Sales was slow down by -5.6%
   1,0 00                                                                                since it was impacted by flood in
       0

                                                                                         the provincial areas and slower
            2017 2018 2019           4Q18 1Q19 2Q19 3Q19 4Q19                            consumer spending this quarter

                                    Normalized Net Profit and Margin
                                                                     THB mn          •   Net profit of food business
                                                                                         reduced by 82.2% YoY in 4Q19
   1,0 00                             7.4%    6.4%    6.8%    6.5%          10. 0%

    900

                   4.3%   5.3%                                              8.0 %

                                                                                     •   Higher discount promotion and
            3.2%
                                                                                         lower SSSG put pressure on gross
    800                                                                     6.0 %

    700
                                                                     1.3%   4.0 %

                                                                                         margin of the food business this
    600                                                                     2.0 %

                          376
                   287
    500                                                                     0.0 %

    400

            210
                                                                            -2.0%

                                                                                         quarter. Also, there was higher
    300

                                      129     112     122    119*           -4.0%

                                                                                         admin expense especially labour
    200

                                                                     23     -6.0%

                                                                                         cost to support the business
    100                                                                     -8.0%

       0                                                                    -10.0%

                                                                                         growth.
            2017 2018 2019           4Q18 1Q19 2Q19 3Q19 4Q19

Note: * Normalized net profit with extraordinary item adjustment
                                                                                                                             7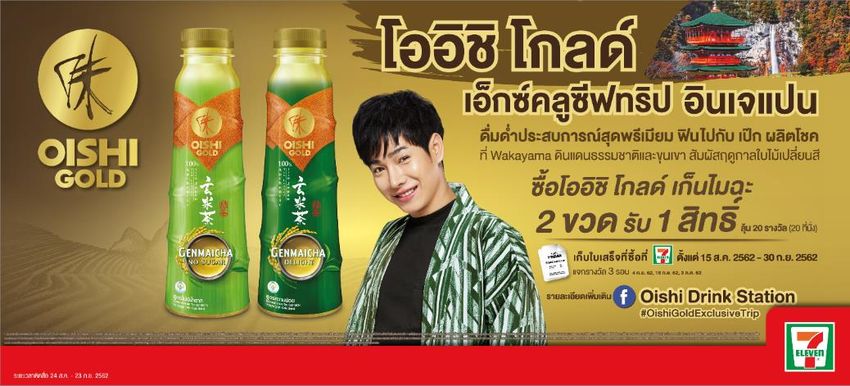
Profitability Ratios
                   Gross Margin (%)                           EBITDA Margin (%)                                     Net Margin (%)
40. 0%

         34.8% 32.3%            35.6% 35.3%        40. 0%                                           40. 0%

35. 0%                                             35. 0%                                           35. 0%

30. 0%                                             30. 0%                                           30. 0%

25. 0%                                             25. 0%                                           25. 0%

20. 0%                                             20. 0%

                                                            14.2%            16.2% 16.1%            20. 0%

15. 0%                                             15. 0%

                                                                    10.1%                           15. 0%

                                                                                                                                   8.0% 9.0%
10. 0%                                             10. 0%                                           10. 0%

                                                                                                             5.9%
 5.0 %                                              5.0 %                                            5.0 %
                                                                                                                    2.7%
 0.0 %                                              0.0 %                                            0.0 %

           4Q18 4Q19            FY18 FY19                   4Q18 4Q19                FY18 FY19               4Q18 4Q19             FY18 FY19

                                ROA* (%)                                                                     ROE* (%)
         30. 0%                                                             30. 0%

         25. 0%                                                             25. 0%

                                                                                                                                     19.5%
         20. 0%                                                             20. 0%
                                                                                                                           17.4%
                                                               13.6%                  11.9%
                                             10.4%
         15. 0%                                                             15. 0%

                  7.2%
                                                                                                 5.1%
         10. 0%                                                             10. 0%

          5.0 %
                         3.8%                                                5.0 %

          0.0 %                                                              0.0 %

                  4Q18   4Q19                 FY18              FY19                  4Q18       4Q19                      FY18       FY19

Note: Margin is profit divided by Sales and Services Revenue                                                                                   8
*Annualized Ratio based on reported Net profit
Strong Financial Status
          Current Ratio (x)               D/E and Net D/E Ratios (x)

                                                 D/E     Net D/E
                                   1.4

 1.6

 1.4
                          1.4      1.2

                                   1.0

 1.2

 1.0
        1.0                        0.8

 0.8

                                   0.6

 0.6

                                   0.4

 0.4
                                          0.3
                                   0.2

 0.2

                                                 0.1
                                                           0.0
                                   0.0
 0.0

       Sep-18            Sep-19
                                  (0.2)

                                                                  (0.1)
                                            Sep-18           Sep-19

                                                                          9
Dividend and Stock Split
Recorded Dividend Payment this year
                                                                                                    (THB/share)
                                                                                                   4.00
                                                                 3.40
                                                   2.50                         2.80
                                     2.00                        2.30                              2.90
       1.30           1.60                         1.40                         1.90
                      1.05           1.45
       1.00                                        1.10          1.10           0.90               1.10
       0.30           0.55           0.55
       2013           2014           2015        2016             2017          2018               2019
                                Interim Dividend                 Final Dividend

Stock Split Plan
Oishi’s BoD has endorsed the Stock Split Plan from the current par value of THB 2.0/ share to the new
par value of THB 1.0/ share.
                                            Before Stock Split                         After Stock Split

 Par (THB/share)                                    2                                         1

 Total Number of Share (mn shares)                187.5                                      375

Expected Effective Date: Beg.-Mid February 2020. However, this is still subject to AGM’s approval
Note that this Stock Split will have no effect on our registered and paid-up capital.                       10
A+ Rating Affirmed Reflects Strong Financials
TRIS Rating affirms the company
rating of Oishi Group PLC (OISHI)
at “A+” with “Stable” Outlook
October, 2019
Key Highlights:
Strong Positions with support from ThaiBev Group
➢ The rating reflects OISHI’s well-known brand, leading market position in the ready-to-drink (RTD) tea
segment in Thailand, its strong balance sheet and status as a strategically important subsidiary of Thai
Beverage PLC.
➢ The domestic RTD tea market recovered in the first half of 2019. Going forward, TRIS Rating expects RTD tea
producers to be able to adapt to the gradual increases in the sugar tax rate during 2019-2023.
➢ TRIS Rating believes that OISHI can maintain its decent position as a restaurant operator in the fragmented
and highly competitive restaurant industry, backed by its brand equity and a track record of consistent
operating performance.
Minimal financial leverage
➢ TRIS Rating expects OISHI will have little need to borrow and become largely debt-free by 2022.
Source: TRIS 11Corporate Governance and AGM Scores
Good Corporate Governance Scores
Oishi Group Listed co
Avg 2019
2014 2015 2016 2017 2018 2019
Rights of Shareholders 89 94 95 95 95 95 94
Equitable Treatment of Shareholders 96 98 99 99 99 99 92
Role of Stakeholders 76 80 79 91 92 93 81
Disclosure and Transparency 84 87 89 93 96 96 86
Board Responsibilities 70 76 81 81 85 84 75
Total score 78 84 86 88 91 91 82
Source : Thai Institute of Directors (สมาคมส่งเสริ มสถาบันกรรมการบริ ษัทไทย)
AGM Quality Score
Listed co
2014 2015 2016 2017 2018 2019 Avg 2019
Oishi Group 97 100 99.25 100 99 100 93.95
Source : Thai Investors Association (สมาคมส่งเสริ มผู้ลงทุนไทย)
12Beverage Business
13Beverage: Oishi Sustains Leadership Position
Thailand – % Market share of RTD Tea by Value Value % YoY
MAT-Sep19
Moving Average 12 months (MAT) Sep-19’s Value = THB 12,370 mn RTD Tea +2.2%
Oishi Corp. +0.3%
Second Player +9.6%
45.4% 44.6% 45.1% 45.5% 43.6% 44.3% 45.7% 44.2% 46.2% 43.8% 43.8% 43.5% 44.8% 45.3%44.7%
31.9% 31.7% 30.2% 33.4% 33.2% 33.7% 32.3%
31.5% 30.0% 30.2% 30.4%30.4%
29.4% 28.7% 30.0%
7.3% 7.8% 7.7% 6.8% 7.6% 7.7% 7.6% 8.7% 8.1% 8.0% 7.3% 7.7% 8.2% 8.0% 8.0%
Oishi Corporate Second Player Third Player
Source : Nielsen Retail Index Sep-19 14Beverage: Resumption of Capacity since Dec-18
Capacity Snapshot
(mn unit/ month) Sep’18 Sep’19
CAF (1-4) 60.0 60.0
Drinking water 24.0 18.0
Others (UHT Green Tea, UHT Dairy, Hot-fill) 12.5 45.5
Total 96.5 123.5
• The UHT production lines have been resumed since December 12, 2018. The UHT
operation started with UHT Green Tea immediately and then UHT Dairy (OEM products) in
Apr-19.
• Excess Capacity of Drinking water was sold in Apr-19
• Average utilization of 4Q19 was around 50-60%, flat from 4Q18. There was an overhaul at
CAF line 3 during the quarter. Overall Utilization for the FY2019 was around 50-60%.
15New Products to Add Varieties and Stimulate Sales
Previous New Product Record New Product to be launched in Oct-19
“Oishi Honey Double Lemon” best performed
among other NPDs in the market
22%
27%
NPD Value
Contribution
18% 9%
6% 9% 9%
Oishi Apple Honey Oishi Apple Honey Light
SIZE: 350 & 380 ML SIZE: 380 ML
Source: Nielsen Retail Audit, YTD Aug’19 RSP: THB 15
20 and 20 RSP: THB 20
CHANNEL: Nationwide CHANNEL: Modern Trade 16Oishi x ROV campaign
Partner with No.1 Gaming Platform
Mechanic : 2 Oishi’s Codes = 1 Random
box from ROV
Period : 21 Oct 2019 – 31 Jan 2020
• No.1 MOBA Game on mobile
• Target Teens
• Penetrate to new target
customer through ROV
Channels
• High engagement both Online
and On ground activity
17Beverage: Oishi Gold’s Successful Launch
Successful Launch of Oishi Gold’s Genmaicha NEW: Oishi Gold “Sencha Matcha”
in 7-11
Exclusive promotion drove Oishi Gold to be
ranked in T1 at 7-11
No Sugar Delight
Channel: Modern Trade
Launch Period: October 2019
RSP: THB30 / bottle
18Beverage: Continue to grow in CLMV markets
Laos* Export Revenue
No. 1 RTD Tea +15% YoY
FY18 FY19
% Export
to Bev revenue
21% 22%
Thailand
• No.1 RTD Tea
Cambodia*
No. 1 RTD Tea
Malaysia
• No.1 RTD Green tea
• Cooperation with F&N Singapore
• Proven products in a quality-
concern market
• Cooperation with F&N
Company’s Subsidiary 1100 Factory
Company’s Beverage Partner’s Beverage Factory
Remarks : * Market share information is based on internal market survey from local distributors (unofficial data) 19Food Business
20Food: Continued Outlet Expansion
Balance as Balance as
Brand Type of Opened Closed of
30 Sep 18 30 Sep 19
Buffet
1 - - 1
(THB 995 net)
Buffet
7 +2 - 9
(THB 659+)
Buffet
11 - -1 10
(THB 569+)
Buffet
138 (1) + 18 -5 151(1)
(THB 399 net)
A-la-carte 54 +2 -2 54
A-la-carte and Buffet
17 - -2 15
(THB399++ and 539++)
A-la-carte 22 +4 -1 25
Others A-la-carte 2 - -1 1
Total 252 + 26 - 12 266
Note: 1) include 2 outlets of Shabushi in Myanmar
Remarks: Price might be vary in some outlets 21Food: Marketing Activities in 4Q19
22Food: The New Shabushi’s 24-Hours Store
▪ Catch up to the new mega trend, “ 24-hour service”
▪ Hybrid Store Format: Buffet Model with 2 types of service and price tiers during different hours
% Customer
Sales
Breakdown
Regular Service (10.00 – 22.00)
THB 419/head 54% 2-3 Times
of Normal
Happy Hour (22.01 – 9.59)
Shabushi
THB 319/head (Promo THB299 until Dec-19) 46% Store at the
Serving only hotpot menu with no sushi corner same size
Plan to serve to table without using conveyor belt
▪ Lower CAPEX - Separated some of the seating space from the Conveyor Belt
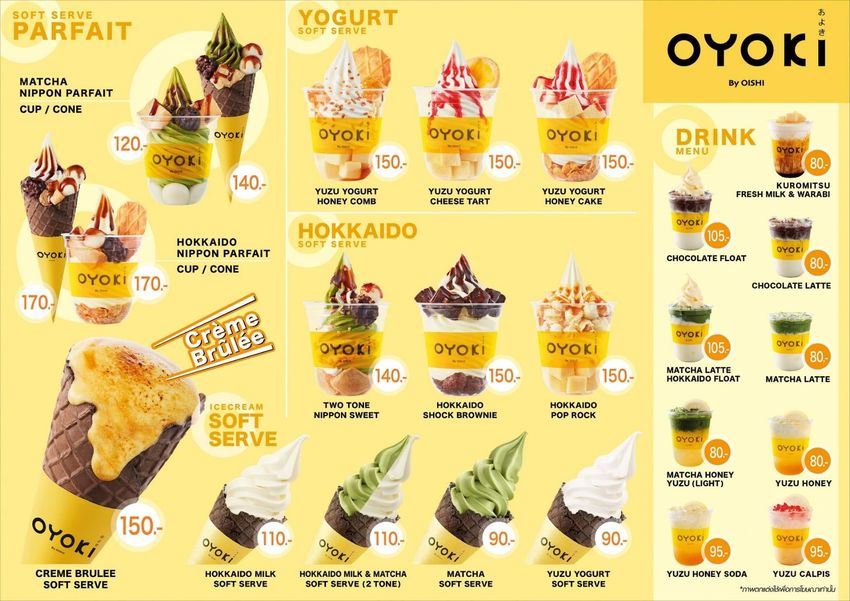
Remarks: Statisticss after 1-month opening (20 Sep – 19 Oct 2019) 23Food: New Store Concepts – Soft-Serve Kiosk
Brand: Oyoki by Oishi
Concept: Surprise JAPANESE Soft-Serve EXPERIENCE
PREMIUM BASE FLAVOR SURPRISE PREMIUM TOPPING
First Store: Silom Complex, B Fl.
Launch: November, 28th
Menu: Soft-Serve (Plain and Creations) and Drinks
24Food: New Store Concepts – Soft-Serve Kiosk (Cont.)
25Food: The New BevFood Application
• Point Collection and Redemption
• Personalized Marketing &
Promotion
• Restaurant Booking (coming soon)
26Food: Packaged Foods Continued to Develop New Products
Bacon and Cheese French Toast Sandwich
First time ever in Channel: 7Eleven
Thailand!!…. French Toast in Launch: Sep 2019
RTE format
RSP: THB 35/ pack
Not ordinary toast…dipped with milk
butter and egg
27Strategy and Outlook
282020 Strategic Priorities
Food Group
Beverage Group
Restaurant Packaged Food
• Dominance Leadership in • Store Expansion • Brand Building
Thailand o To open 20 outlets in 2020 o Oishi “One” Brand
o Grow portfolio share o Deeper penetration in o Japanese brand for RTE
through innovation and second-tier provinces o Build Brand connection
new product development • Brand Building & Customer and Engagement
o Premiumization Retention • New Product
o Healthier Products for the o Brand Premiumization/ o New category and New
future New Brands to compliment innovation
existing portfolio • Distribution
• Larger Export Footprint o Applying mobile- o Expand to new channels
o Grow in CLMV first to enhancing and leverage Group
customer experience. Synergy
• Driving Synergy • Product Development o Continue to grow in
o Synergy with stakeholders o New Innovation existing channels – CVS
o Menu Rationalization and MT
• Platform Expansion o Grow Export
o App-based food ordering • Efficiency and Productivity
& delivery through own o Increase factory
platform and food utilization
aggregators o Improve process to
• Operational Excellence reduce waste
29
• Sustainable Quality2020E CAPEX Plan
Total Capex 2020E Capex Breakdown
THB mn
1,400 1,300
1,200
6%
1,000 900
800
400 33%
600
1,300 2020E
UHT 400 61%
investments
to be covered
200
500
by insurance
claims -
2019 2020E
Beverage Food Center
UHT Others
30Our Awards and Recognitions
2018
Superbrands Thailand 2017
Awards from Superbrands for
3rd consecutive years
Food Safety Award 2018
from Ministry of Public
Health Thailand Top Company
Awards 2018 from ARIP
and UTCC
Certificate from Green
House Gas Management
Organization (องค์การบริ หาร
Thailand’s Most Social
จัดการก๊ าซเรื อนกระจก)
Powerful Brand 2018 for
RTD Tea from BrandAge
The Most Powerful Brand
2018 from Chulalongkorn
Business School
2019
Thailand’s Most Admired
Brand 2019 from
Thailand’s Most Social
BrandAge for 8th
Powerful Brand 2019 for
consecutive years
RTD Tea and Restaurant
from BrandAge
31Give Back to the Community with CSR
The Giving Project “Im-jung” Project
Support and extend help to society in a number Donate our products for youth and those less
of ways – promotion for quality of life, fortunate in our community alongside with
economic and social aspects through activities recreational activities that promotes good
as follows: morality.
• Renovation of Thai temple in Japan • Special meal for less fortunate children
• Clean drinking project • for schools in nearby area of
• The Co-operative Education Project manufacturing plants
• The residence project • Songkran events for disabled one and
elderlies in less developed areas
• Scholarships for children of staff
32THANK
YOU
33You can also read


