On the Negative Pricing of WTI Crude Oil Futures - European ...
←
→
Page content transcription
If your browser does not render page correctly, please read the page content below
On the Negative Pricing of WTI Crude Oil Futures

 Adrian Fernandez-Perez*, Ana-Maria Fuertes** and Joëlle Miffre***

 ABSTRACT
WTI crude oil futures markets experienced the unprecedented phenomenon of negative prices
on April 2020. Energy market pundits have attributed the event to the large United States oil
exchange traded fund (“USO”) due to the rolling of positions out of the May 2020 contract
(CLK20) before its maturity on April 21, 2020. We show empirically that USO flows do not
cause the price of WTI futures in general, nor of CLK20 in particular. A blend of
macroeconomic/geopolitical conditions, including the demand plunge associated with Covid19
pandemic-control measures and supply spikes due to Russia-Saudi Arabia tensions, contributed
to a contangoed WTI futures curve that attracted cash-and-carry (C&C) arbitrage. C&C trades
increased the inventory at Cushing, the physical settlement hub for WTI futures, which further
steepened the curve and attracted more arbitrage. Long WTI futures holders panicked upon the
possibility of a near tank-tops scenario, and sought hastily to unwind their positions.

Date: January 29, 2020
Keywords: WTI crude oil; Negative price; Theory of storage; Contango; Cash and carry
JEL classifications: G13, G14, Q4
Word count: 150
___________________________

* Senior Research Fellow, Auckland University of Technology, Private Bag 92006, 1142
 Auckland, New Zealand. Phone: +64 9 921 9999; Fax: +64 9 921 9940; Email:
 adrian.fernandez@aut.ac.nz
** Professor of Finance and Econometrics, The Business School, City, University London, ECIY
 8TZ, England; Tel: +44 (0)20 7040 0186 E-mail: a.fuertes@city.ac.uk.
*** Professor of Finance, Audencia Business School, 8 Route de la Jonelière, 44312 Nantes, France;
 Tel: +33 (0)2 40 37 34 34. Corresponding author.
We are grateful to USCF for funding this research. The paper benefitted from discussions with Kevin
Baum, Marcos Gonzalez-Fernandez, Hilary Till and seminar participants at Audencia Business School,
University of Nantes, for useful suggestions.

 1
Executive summary

On April 20, 2020, the price of the NYMEX WTI crude oil futures contract with maturity April
21, 2020 (known as the May 2020 delivery contract or CLK20) tumbled to a negative -$37.63.
This is the first time a WTI futures contract has experienced a negative price since NYMEX
WTI trading began on March 30, 1983. The purpose of this article is to investigate the reasons
behind this unprecedented event.
 Some energy market commentators have blamed the largest WTI crude oil exchange
traded fund, United States Oil fund (USO), for having wacked the market. The implicit line of
reasoning is that the massive USO long futures positions on WTI crude oil and the
corresponding rolls nearer maturity are responsible for the collapse of WTI futures prices. Using
Granger-causality tests fitted to daily data, we show that USO flows have little price impact on
WTI futures and are unlikely to be responsible for the negative pricing observed in last April.

 Further analysis suggests that speculative arbitrage is most likely to have led to the WTI
crude oil price collapse. As from January 2020 the WTI futures market turned into contango
which is likely to have attracted cash-and-carry (C&C) arbitrage. The latter together with
disastrous blend of macroeconomic and geopolitical conditions, such as a demand shattered by
the Covid-19 lockdowns and spikes in an already high supply triggered by Russia-Saudia
Arabia tensions contributed to turn the contango into super-contango in March. The super-
contango attracted rampant cash and carry (C&C) arbitrage, the long leg of which pushed the
physical settlement hub (Cushing in Oklahoma) closer to a top tanks scenario. As the maturity
of CLK20 became imminent, C&C traders panicked at the possibility of no feasible storage at
Cushing and sought to get rid of their long positions at any price.

 Thus, our findings suggest that, rather than long index trackers, the C&C arbitrageurs are
responsible for the anomalous CLK20 negative pricing. Our investigation calls for C&C
arbitrageurs to exert caution during super-contango stages as sudden jumps in storage costs
effectively imply that the C&C strategy is not risk-free. Our findings may also call for regulators
to monitor the long positions of C&C arbitrageurs close to contract maturity so that they do not
dislocate the natural convergence at maturity of the futures and spot prices.

 2
1. Introduction

The West Texas Intermediate (WTI) crude oil futures contract that is traded on the New York

Mercantile Exchange (NYMEX) involves an obligation to buy or sell 1,000 barrels of light

sweet crude oil at some pre-specified price and delivery date. Long (short) futures positions at

contract maturity legally bind the holder to a physical settlement – taking delivery of

(delivering) WTI crude oil at the Cushing hub in Oklahoma. 1 The price of WTI futures is often

discussed in news reports on crude oil as benchmark. WTI crude oil is not any particular oil

produced in any specific oil fields; oil produced in any world location can be considered WTI

if it meets certain specifications as regards low density and low sulfur content.

 The goal of this empirical investigation is to shed light on the recent anomalous pricing

behavior of the May 2020 WTI futures contract with maturity date April 21, 2020 (formally

known as CLK20). 2 The futures price of CLK20 swung dramatically from $18.27 (April 17,

2020) to a negative -$37.63 (April 20, 2020) 3 and climbed back to $10.01 at maturity (April 21,

2020). This is the first time that a WTI futures contract has experienced negative prices since

NYMEX WTI trading began on March 30, 1983. The existence of the United States Oil fund

(with ticker symbol USO), one of the main trackers of the WTI crude oil performance, has been

controversial and a frequent target of criticism by energy market pundits. In particular, some

oil market commentators have implicitly or explicitly stated that the massive USO long futures

1
 Delivery should take place on any calendar day of the delivery month. For more details on
WTI crude oil contract specifications see https://www.cmegroup.com/ trading/energy/crude-
oil/light-sweet-crude_contract_specifications.html.
2
 CL is the NYMEX ticker symbol for WTI crude oil, K is the letter that states the delivery
month (May) and the last two numbers refer to the delivery year.
3
 One long contract of WTI crude oil futures buys 1,000 barrels of oil. Thus, a negative price of
-$37.63 per barrel (p/b) on April 20, 2020 meant that opening a long futures position then was
highly beneficial to traders with storage facility as the contract holder would receive not only
1,000 barrels of oil at contract expiration, but also a $37,630 payment. See, for instance,
https://www.bloomberg.com/news/articles/2020-05-13/one-trader-who-cashed-in-on-sub-
zero-oil-prices-sees-rare-payout.
 3
positions on WTI crude oil and the corresponding rolls as contract maturity approaches are to

blame for the recent anomalous negative CLK20 pricing. 4

 This article contributes to the literature on the price behavior of WTI crude oil futures

contracts, firstly, by empirically testing the conjecture that USO trading induced the negative

price of CLK20 as of April 20, 2020. For this purpose, we conduct an eclectic set of Granger-

causality tests to determine whether USO flows (changes in open interest) have any predictive

power for subsequent price changes of CLK20. The results indicate that USO flows did not

drive the returns of CLK20 which is not surprising upon the recognition that USO had already

rolled all of its long positions on CLK20 to more distant contracts already as of April 13, 2020

(or seven days before the CLK20 crash). More generally, the finding that USO trading did not

influence the price of CLK20 can be extended to any of the WTI futures contracts that USO has

ever traded approximately since its inception from October 24, 2008 to June 29, 2020.

 The second contribution of this article is to uncover the plausible causes of the negative

pricing of CLK20. The empirical analysis suggests that the negative pricing of WTI futures in

April 2020 was the outcome of an unfortunate blend of macroeconomic, geopolitical and

storage conditions. In the early months of 2020, the worldwide demand for crude oil was

shattered by 18.3% due to Covid-19 lockdowns; meanwhile, geopolitical tensions between

Russia and Saudi Arabia in March 2020 increased by 3.5% an already overinflated world

supply. Against this background, the WTI futures market steered into a super-contango state;

namely, the spread or futures price difference between front- and second-nearest contracts,

became very large and negative. Motivated by the theory of storage of Kaldor (1939), Working

(1949) and Brennan (1958), we argue empirically that the Cushing storage blowout played a

key role in the negative pricing. Specifically, we test the conjecture that the said super-

4
 See, for instance, https://www.wsj.com/articles/the-fund-that-ate-the-oil-market-11587489
608 and https://www.forbes.com/sites/vineerbhansali/2020/04/21/negative-price-of-oil-is-
telling-us-that-bigger-problems-are-afoot/#5536ed163a5a
 4
contangoed WTI futures market acted as a strong catalyst for cash-and-carry (C&C) arbitrage

which, in turn, depleted the Cushing storage facility. As Ederington et al. (2020) show, the

C&C arbitrage on WTI crude oil – a market neutral strategy that combines the physical purchase

of WTI crude oil through borrowing at a cheap spot or front-end futures price and the sale of

the stored oil at a premium via distant-maturity futures contracts – is profitable as long as the

WTI futures market is contangoed enough for the difference between the distant- and front-

maturity prices to exceed the financing and storage costs of the long WTI crude oil position.

 In the first two weeks of April 2020, numerous traders (e.g., hedge funds) saw the super

contango as an opportunity for C&C arbitrage profits, and consequently, the long leg of their

arbitrage pushed up the storage tanks at Cushing toward their limits. As days passed, and the

maturity of CLK20 came closer, C&C traders realized that there was no spare storage facility

at Cushing. As taking delivery at maturity appeared unfeasible, long CLK20 traders who had

not secured storage resorted to closing their long positions at all costs, even if that meant selling

at negative prices. As Nagy and Merton (2020) put it, WTI crude oil became like a toxic waste

or a pile of garbage to long CLK20 traders on April 20, 2020; effectively, long traders cannot

just dump crude in a lake or ocean to dispose of it; for that reason, they deemed paying up to

$37.63 per WTI crude oil barrel sold as a lesser loss than taking physical delivery.

 Our findings speak to the literature on the financialization of energy futures markets by

showing that index traders, such as USO, did not drive the price of crude oil futures away from

its fundamental value and thus, did not alter the price formation process (see e.g., Till, 2009;

Tang and Xiong, 2012; Fattouh et al., 2013; Bessembinder et al., 2016; Byun, 2017). This

suggests that calls for the regulation of index trackers might be, at this stage, premature. Further

regulation could, in fact, be detrimental as it may discourage index trackers, important providers

of risk-absorption and liquidity, from trading crude oil futures.

 5
Our findings also speak to the empirical literature on the theory of storage 5 by bringing

indirect evidence that the law of one price implied by the cost-of-carry model does not hold in

the presence of storage constraints. In so doing, it complements the analysis of Ederington et

al. (2020) by focusing on the anomalous negative pricing of CLK20, and by showing that limits

in the availability of storage facility (i.e., reaching the nightmare scenario of exhausted storage)

can hinder the execution of C&C arbitrage to the extent that futures prices become negative.

Our findings therefore call for C&C traders to exert caution during super-contangoed futures

markets as sudden jumps in storage costs effectively imply that the C&C strategy can suddenly

become physically impossible and thus, highly risky. Our findings may thus call for regulators

to monitor the long positions of C&C arbitrageurs close to delivery so that they do not dislocate

the natural convergence of the futures and spot prices at maturity.

 The remaining of the article unfolds as follows. Section 2 describes the data. Section 3

provides empirical tests of the role of USO trading as regards the CLK20 price crash on April

20, 2020. Section 4 analyzes other potential drivers of the event related to the fundamentals of

crude oil supply and demand, Cushing storage facility, and C&C arbitrage. Section 5 concludes.

2. Data

2.1 WTI crude oil futures market data

Our investigation relies on a wide sample of daily settlement prices and open interests (or total

outstanding contracts) for all 446 WTI crude oil futures traded from March 30, 1983 to June 29,

2020. According to the theory of storage, a negative futures spread at time t ( , 1 − , 2 <

5
 Geman and Ohana (2009), Symeonidis et al. (2012), Geman and Smith (2013), Gorton et al.
(2013), Alquist et al. (2020), and Ahmadi et al. (2020) confirm empirically for different
commodity markets that low (high) inventory levels are associated with forward curves in
backwardation (contango). Using intra-day data, Alquist et al. (2020) show that news of higher-
than-expected (lower-than-expected) U.S. crude oil inventories lead to very quick, within
minutes after the announcement, decreases (increases) in the front futures contract price.
 6
0 with 1 and 2 denoting the front- and second-nearest maturities) or upward-sloping term

structure signals contango or abundant inventories, while a positive futures spread (downward-

sloping term structure) signals backwardation or scarce inventories. For comparison, we also

obtain the settlement prices of front and second-nearest maturity futures contracts on Brent

crude oil over the available period December 12, 1988 to June 29, 2020. 6 All prices are from

Thomson Reuters Datastream. Our investigation employs also day-close long USO open

interest data on WTI crude oil from October 24, 2008 to June 29, 2020 (source: USCF archives).

2.2 Crude oil storage capacity, supply and demand data

Our empirical analysis is also based on crude oil storage capacity, supply and demand data.

Weekly working storage capacities for the U.S. and different Petroleum Administration for

Defense Districts (PADDs) – PADD 1 (East Coast), PADD 2 (Midwest which includes

Cushing), PADD 3 (Gulf Coast), PADD 4 (Rocky Mountains) and PADD 5 (West Coast) – are

obtained from the Energy Information Administration (EIA) website. Also from the EIA

website, we obtain monthly worldwide crude oil production, as measure of supply. Finally, we

obtain monthly worldwide (and U.S.) crude oil and liquid fuels consumption data, as proxy for

world (and U.S.) demand, from Thomson Reuters Datastream. The start date of the different

datasets is dictated by data availability, and the end date is June 26, 2020 throughout.

3. USO trading and WTI crude oil futures price behavior

USO is a crude oil exchange traded fund (ETF) designed to provide returns that track those of

WTI crude oil. 7 Launched on October 2006 and with around $4.78 billion under management

6
 Unlike WTI crude oil futures contract that can only be physically settled, the Brent crude oil
futures contract allows for either cash or physical delivery. For more details on Brent crude oil
contract specifications see https://www.theice.com/products/219/Brent-Crude-Futures.
7
 For details on USO’s investment objective and strategy, see the prospectus available at
https://www.uscfinvestments.com/documents/united-states-oil-fund-pro-20190228.pdf.
 7
as of June 29, 2020, it is the largest crude oil ETF. USO does not hold oil inventories, which

would entail large storage costs. Instead, it holds long positions in front-maturity contracts and

rolls them to second-nearest contracts several days before the expiration of the front contracts.

 USO open interest on WTI crude oil represents 6.80% of total open interest on average

over our sample period. USO has been often accused by the media of distorting the WTI crude

oil market. A study of prices, liquidity and individual account trading activity around the large

and predictable USO roll dates conducted by Bessembinder et al. (2016) does not find evidence

of the systematic use of predatory strategies. 8 Specifically, the authors find the WTI crude oil

market quality improves (narrower bid-ask spreads, greater order book depth, and improved

resiliency) on the largely predictable USO roll dates. Our paper complements the latter by

investigating empirically the more recent claim by energy market pundits that USO trading is

responsible for the anomalous negative price of the CLK20 contract on April 20, 2020.

 We begin by formulating and testing a general hypothesis that concerns the causal

relationship between USO trades of WTI futures contracts and the pricing of these contracts:

Hypothesis 1: USO flows do not influence the pricing of WTI futures.

The second hypothesis is more specific as it pertains to the causal relationship between USO

trades and the anomalous price behavior of CLK20 in April 2020, stated as:

Hypothesis 2: USO flows do not drive the pricing of the May 2020 delivery contract (CLK20).

 The empirical models estimated as regards both hypotheses employ data for the entire

cross-section of WTI futures contracts ever traded by USO from October 24, 2008 to June 29,

2020. The tests for Hypothesis 2 additionally rely on a discrete variable to capture the period

from March 6, 2020 to April 13, 2020 during which USO held CLK20 positions.

8
 As put by Bessembinder et al. (2016) “a trader who learns that another investor will transact
a substantial quantity of a security can potentially profit by trading in the same direction prior
to or simultaneous with the investor, before subsequently reversing the trade.” Thus, USO with
its highly predictable roll dates is the “prey” and the WTI investors are the “predators”.
 8
3.1 Granger-causality tests for all USO-traded WTI futures contracts

In order to test whether USO trading Granger-causes the price of WTI futures contracts, we

begin by pooling the daily excess returns of the N futures contracts on WTI crude oil that USO

traded over the period October 24, 2008 to June 29, 2020 (N=148); we do the same pooling for

the daily changes in open interest. The pooled time-series have length = ∑
 =1 = 3,767

where is the number of days that USO held long positions on the ith contract. We estimate a

panel regression of the pooled WTI excess returns on their lagged values as well as on lagged

values of the changes in USO’s open interest. Formally, we estimate the panel regression model

 = + + ∑ =1 − + ∑ =1 Δ − + , = 1, … ,148, = 1, … , (1)

where is the WTI excess return from the end of day − 1 to the end of day , Δ the change

in USO’s open interest from day − 1 end to day end, are individual fixed effects to

account for unobserved heterogeneity across futures contracts, are monthly time effects to

account for seasonality in crude oil markets, and , = 1, … , denote the marginal effects

of prior futures returns and USO’s flows, respectively, on current returns, P is a maximum lag

order to capture any serial dependence in daily returns, and is an error term. The model is

estimated by OLS and inferences are based on the White cross-section covariance matrix

clustered by contract that accommodates contemporaneous correlation and heteroscedasticity.

 The first hypothesis can be formulated in the context of (1) as 0 : 1 = ⋯ = = 0

(Hypothesis 1) which says that the addition of lagged USO’s flows into the model does not

improve its explanatory power for returns; in other words, past USO’s flows into a given futures

contract do not help predicting the upcoming price change (return) of that contract, namely,

they do not Granger-cause the returns. Refuting 0 implies that USO’s flows impact the price

behavior of WTI futures contracts, namely, USO is a price-maker as opposed to a price-taker.

 Table 1, Panel I, presents the estimation results and diagnostics for four alternative

specifications of Equation (1) using a maximum lag order = {1,2,3,4}, alongside the

 9
hypotheses tests. The selected model specification according to the 2 , Akaike Information Criterion (AIC) corresponds to lag order = 3.. The joint hypothesis 0 cannot be rejected (for any of the specifications) by the Wald test, which is confirmed by individual ( = 0) tests using t-statistics. This suggests that, nearly since USO’s inception, from October 24, 2008 to June 29, 2020, its flows have not caused WTI futures price changes. [Insert Table 1 around here] 3.2 Granger-causality tests for the CLK20 contract We now tackle the controversial issue of whether USO has influenced the price of the controversial CLK20 contract. Figure 1, Panel A, plots for the CLK20 contract the daily USO open interest on the right-hand vertical axis, 9 and the daily settlement prices on the left-hand side. At day-close on April 13, 2020 (seven business days before the price crash of CLK20 on April 20, 2020) USO did already not hold any CLK20 contract which represents prima facie evidence to suggest that USO trading is unlikely to have caused the anomalous negative pricing of this contract. Relatedly, was USO a “smart” player that foresaw the price crash and pulled out of the market? Panel B of Figure 2 shows that it is usual practice of USO to roll all the long positions in a given contract typically (median value) five business days before maturity. 10 [Insert Figure 1 around here] We formally test whether USO trading over the period March 6, 2020 to April 13, 2020 (i.e., the short period during which USO held long positions on CLK20) influenced the subsequent price of CLK20. To do so, we re-specific the above Granger-causality models, Equations (1) and (2), by introducing a CLK20 dummy variable, , as follows 9 We have anonymized USO’s open interests (right-hand axis) for confidentiality reasons. 10 Since May 2020, USO started rolling over a 10-day period whereas previously it rolled over a 4-day period. On each day during the 4-day roll period, USO rebalanced approximately 1/4th of the announced percentage of the notional value of its nearest month instrument. See https://www.uscfinvestments.com/resources-filings/commodities/uso. 10
 = + + �∑ =1 + ∑ =1 , � − + �∑ =1 + ∑ =1 , �Δ − + (2)

where is a dummy equal to 1 on days t from March 6, 2020 to April 13, 2020 (when USO

held open interest on CLK20) and 0 otherwise; the additional parameters , and , in these

equations capture the specific effects of USO trading on CLK20 prices, over and above the

effect of USO trading on all other WTI contracts (as captured by and ). The hypothesis

 0 : ,1 = ⋯ = , = 0 in Equation (2) states that USO’s flows on the CLK20 contract did

not impact its price more than it impacted the price behavior of other WTI futures contracts.

 Table 1, Panel II, presents the results. Again the model for maximum lag P=3 is the best

specification according to the − 2 , Akaike Information Criterion (AIC) and Bayesian

Information Criterion (BIC). The joint restrictions implied by the above 0 are not rejected by

the Wald statistic, which is confirmed by the individual significance � , = 0� t-tests. These

findings in conjunction with those from the prior tests based on Equation (1), and the fact that

USO did not hold any CLK20 contract already 7 business days before its maturity, suggest that

overall USO’s flows (changes in open interest on CLK20) did not drive the anomalous price

changes of this contract, in line with Hypothesis 2. Overall, the evidence suggests that USO is

unlikely to have “whacked” the market, that is, it did not induce the negative pricing of CLK20

on April 20, 2020, one day before contract expiry. Another fact worth noting in support of the

contention that USO did not induce the price crash of CLK20 is that USCF launched on 2010

an ETF on Brent crude oil (United States Brent Oil Fund; ticker: BNO) 11; if indeed USO

“wacked” the WTI crude oil market we should have observed also negative prices for Brent

crude oil but this is not the case – e.g., the Brent’s front-end (June 2020) settlement price on

April 20, 2020 was $25.57 and $19.33 on April 21, 2020.

11
 For details on BNO’s investment objective and strategy, see the prospectus available at
https://www.uscfinvestments.com/documents/united-states-brent-oil-fund-pro-20200420.pdf
 11
We test the robustness of the previous results to the inclusion of widely-accepted predictive

signals within the WTI futures market as well as macroeconomic and financial predictors of

WTI futures returns. Specifically, we augment Equations (1) and (2) with the one-day lagged

values of the WTI crude oil futures spread, momentum or the average of CLK20 daily returns

over the preceding 50 trading days, basis-momentum 12, relative basis 13, the Baker et al. (2016)

Economic Policy Uncertainty index, the Aruoba et al. (2009) index designed to track real

business conditions at high observation frequency, and CBOE volatility index. Table 2 reports

the Wald test statistic and associated p-value for hypothesis 1 and 2. We consider an extension

of Equations (1) and (2) that includes the effect of the spread in lag-distributed form, namely,

the equations are augmented with − , = 1, . . , . Table 3 reports the estimation results,

model diagnostics and Wald tests. The selected model specification according to all three

criteria 2 , AIC and BIC corresponds to maximum lag order of either 2 or 3.

 [Insert Table 2 and Table 3 around here]

Both types of robustness tests suggest that the main finding remains unchallenged; USO’s flows

do not influence the price of WTI futures contracts in general nor of CLK20 in particular,

4. Other explanations for the anomalous pricing of CLK20

Having ruled out the USO’s flows as influential on the unprecedented negative price of the

CLK20 contract, this section tries to uncover the plausible causes of the event.

12
 The basis momentum signal is designed by Boons and Prado (2019) to capture imbalances in
supply and demand of futures contracts that materialize when the market-clearing ability of
speculators and financial intermediaries is impaired (e.g., during episodes of high volatility and
illiquidity). It is defined as the difference between the 50-day averaged returns of the front- and
second-nearest contracts. Lower values predict lower excess returns in the near future.
13
 The relative basis signal is designed by Gu et al. (2020) as a measure of the convexity or
concavity of the price curve. A concave futures curve (or negative relative-basis) indicates a
low convenience yield, an abundant commodity and thus, a contango market. The relative basis
signal is defined as , 1 − 2 , 2 + , 3 where T1, T2 and T3 are the maturities of the front,
second-nearest and third-nearest contracts and , is the time t settlement price.
 12
4.1 The super contango of March-April 2020

The world oil market experienced an ongoing oversupply (or “glut”) in the last decade. Amongst

the various factors contributing to the massive oversupply, a prominent one is the U.S. shale oil

revolution that started in 2011 (Kilian, 2016). Other factors include i) a steadily falling

worldwide demand for crude oil due to, e.g. the slowdown of the Chinese economy and also

due to ii) the end of U.S. quantitative easing, and iii) environmental policies that promote an

increasing share of energy consumption away from fossil fuels (e.g., the Paris Agreement of

2015). In 2019 concerns about oil demand centered on the US-China trade dispute, thorny

Brexit negotiations and slower-than-expected India’s economic growth. In order to prop up

crude oil prices, against this background, the Organization of Petroleum Exporting Countries

(OPEC) and Russia cut production during 2019 by about 1.2 million barrels a day (mb/d) or by

1.4% (compared to the world production on December 2018). As meanwhile the oil supply was

being boosted by the shale oil revolution, 14 various international energy agencies began to issue

warnings as regards the risk of a massive oversupply in 2020. 15

 In the early months of 2020, the Covid-19 outbreak turned the 2010s oil “glut” into a

tsunami of oversupply. As of January 30, 2020, the World Health Organization (WHO)

officially declared the Covid-19 outbreak as a public health emergency of international concern;

on March 11, 2020, it was declared a pandemic. Attempts to curb the rapid contagion lead to

worldwide economic lockdowns with thousands of restaurants and other businesses closed,

factories reducing or ceasing production, fewer public transport services, residents staying out

of cars, and air travel sharply reduced. As a result, the crude oil and liquid fuels consumption

14
 See for instance https://www.reuters.com/article/us-oil-opec-report/opec-cuts-oil-supply-
steeply-but-sees-growing-2019-headwinds-idUSKCN1Q11GA
15
 “Overall, we will continue to see a well-supplied market in 2020. […] we will see a surplus
probably, unless there is very strong demand growth recovery.” Keisuke Sadamore, Director
of Energy Markets and Security, Singapore International Energy Week, October 29, 2019.
 13
dropped suddenly by 18.28% worldwide (19.63% in the U.S.) from March 2020 to April 2020;

the corresponding figures over the period from April 2019 to April 2020 are equally shocking

(-25.48% and -27.74% worldwide and for the U.S., respectively).

 As if the Covid-19 pandemic was not enough, the substantial crude oil surplus was

exacerbated by Russia versus Saudi Arabia geopolitical tensions from March 2020 onwards. In

response to the Covid-19 led dramatic drop in demand, the OPEC members agreed on March

5, 2020 to cut production further by 1.5 mb/d prompting Russia and other non-OPEC members

to follow suit (such a cut would represent a decrease by about 2% of the crude oil supply

worldwide with regard to the world production on February 2020). However, on March 6,

2020 Russia rejected the call which triggered a $10 fall in crude oil prices on March 9, 2020 (or

a drop by 28.22% in one day). In retaliation, Saudi Arabia announced on March 10, 2020, that

it would increase its production by 2.6 mb/d (from 9.7 mb/d to 12.3 mb/d), Russia declared a

similar plan to rise its supply by 0.3 mb/d. These announcements, which represented an increase

in global crude oil supply by 3.5% of the world production on February 2020, only served to

worsen the crude oil price fall. Following political pressure by the U.S., Saudi Arabia and other

(non)-OPEC countries such as Russia and Mexico agreed on April 9, 2020 to cut production by

9.7 mb/d (or by 11.8% of the world production on March 2020). These production cuts were

“too little too late” in the light of the Covid-19 demand shock and as a result, prices kept on

dropping. Figure 2, Panel A, shows the timeline of these events alongside the CLK20 price.

 [Insert Figure 2 around here]

 The theory of storage predicts that, in this setting of a staggering high supply and low

demand, the crude oil futures curve turns into contango. To confirm the latter, we plot in Figure

2, Panel B the daily futures spreads for WTI and Brent crude oil from December 2, 2019 to June

29, 2020. The switch from a positive spread (backwardation) to a persistently negative spread

(contango) occurs on January 14, 2020 for WTI and on March 4, 2020 for Brent.

 14
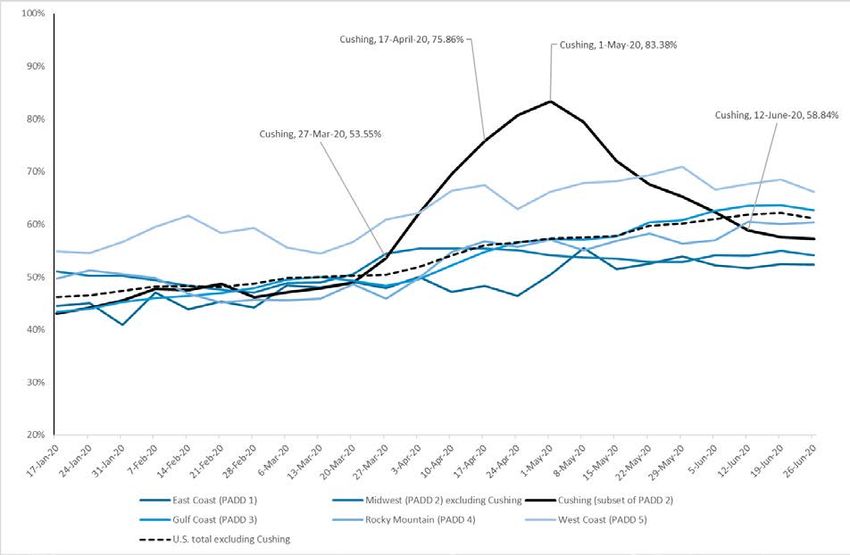
The sudden slowdown of crude oil demand (driven by Covid-19) alongside the Russia

versus Saudi Arabia tensions are likely to have played a key role in turning the early 2020

contango in the WTI futures market into a super-contango in late March 2020; then, the WTI

spread fell below the 5th percentile of its distribution over the entire available period from

March 30, 1983 to June 29, 2020. Eventually, the WTI futures market reached unprecedented

levels of contango with an all-time large and negative spread of -$58.06 on April 20, 2020.

Brent also remained in contango but not as much as WTI and its price did not turn negative.

These observations indirectly suggest that crude oil supply and demand imbalances and the

associated futures contango per se did not trigger the WTI crude oi futures price collapse of

April 20, 2020 since otherwise, a negative price should have been observed also to some extent

for Brent futures; something else linked to the storage facility at Cushing played a key role.

4.2 C&C arbitrages “squeeze” as driver of the negative CLK20 pricing

4.2.1 Storage utilization

Given the geopolitical and economic conditions described above and the super contango

observed as of late March 2020, one might naturally be concerned about the possibility of crude

oil storage tanks reaching maximum storage capacity – the so called tank tops scenario. As

noted, there are five PADDs in the U.S. where crude oil is stored. All hubs act as providers of

storage facility for operational (e.g. refinery) purposes while, in addition, Cushing, included as

part of PADD 2, is the delivery point of NYMEX WTI crude oil futures contracts.

 Figure 3 plots the weekly rate of utilization of storage capacity at Cushing, at all five

PADDs (excluding Cushing from PADD 2), and at the entire U.S. (excluding Cushing) in the

time window from January 17, 2020 to June 26, 2020 around the negative CLK20 price event.

The graph shows that 54% of refineries and tank farms at Cushing were used in late March

2020, and a much higher 76% on April 17, 2020, and 59% in June 12, 2020.

 [Insert Figure 3 around here]

 15
The storage utilization rate outside Cushing is far less volatile, with the U.S. total (excluding

Cushing) utilization rate steadily rising but never exceeding 63% over the period considered.

The sharp sudden rise in the utilization rates at Cushing in April (and subsequent fall in May),

not seen in other U.S. storage hubs, is a reflection of the fact that the Cushing inventory

dynamics does not just reflect operational factors, that is, is not exclusively a

macroeconomic/geopolitical phenomenon (i.e., by-product of a large crude oil supply and

shuttered demand). As shown by Ederington et al. (2020), the inventory dynamics at Cushing

reflect largely the fact that this is the WTI crude oil futures contract delivery point, unlike other

U.S. storage hubs. Thus, we hypothesize that the rampant C&C arbitrage induced by super-

contango played a key role in pushing up the tank levels at Cushing and, in turn, expectations

of a tanks top in May 2020 led to the negative price event of CLK20 on the 20th April, the day

before contract maturity. This hypothesis is examined empirically next.

4.2.2 C&C arbitrage trade

In contangoed markets, C&C arbitrageurs have an incentive to take long positions in the spot

asset (or in front-maturity contracts) and short positions in distant-maturity contracts. As long

as the difference between the distant- and front-maturity prices is large enough relative to the

cost of funding and carrying the physical commodity, the arbitrage trade will be profitable. We

argue that the super-contango that prevailed as of early 2020 in the WTI futures market

incentivized C&C traders to open long positions on front-end WTI contracts in March 2020, as

well as short positions in more distant contracts. The long leg of the C&C trades induced the

aforesaid sharp rise in storage utilization at Cushing. 16 Although they could also be hedgers, the

main C&C traders are financial institutions such as hedge funds which lease storage capacity at

Cushing (for further discussion see, e.g. Davis, 2007; Ederington et al., 2020).

16
 The sample period for these correlations starts on January 17, 2020 (Friday) as opposed to
January 14, 2020 (Tuesday) when the WTI futures market turned into contango) because the
inventory data is only available at the weekly frequency.
 16
In support of the claim that the WTI crude oil futures contango attracted C&C arbitrage

which, in turn, subsequently raised inventory levels at Cushing, we obtain the weekly crude oil

inventory levels (excluding strategic petroleum reserve) at Cushing from the EIA website and

measure the correlation between the futures spread at week t (measured as the difference

between the front and second-nearest futures prices) and the inventory at week t + 2. From

January 17, 2020 to June 19, 2020, the correlation is a highly negative and significant -0.86;

the more negative the futures spread at time t (deeper contango), the more C&C arbitrage trades,

and, consequently, the Cushing inventories rise 2 weeks ahead when the delivery of the expired

long position takes place. Similarly, the correlations between spread at t and inventory at + ,

 = {1,3,4} weeks are significant and negative at -0.77, -0.82 and -0.70, respectively.

 We provide next an illustrative example of how the C&C arbitrage can explain the build-

up of storage tanks at Cushing in April 2020 and, in turn, the panic selling of CLK20 and

negative prices that ensued driven by expectations of a tank tops scenario. As of March 12,

2020, the futures spread was at -$0.48 p/b, with the (front) April 2020 contract (CLJ20) trading

at $31.50 and the (second nearest) May 2020 contract (CLK20) trading at $31.98 p/b. On that

day, a C&C arbitrageur could buy (long) WTI crude oil for delivery on April 2020 (CLJ20) at

$31.50 through borrowing, and sell (short) crude oil for delivery on May 2020 (CLK20) at

$31.98; this strategy requires storage facility for the oil from the buy delivery date on April

2020 until the sell delivery date on May 2020. As more C&C trades engaged in this arbitrage,

the Cushing hub utilization sharply increased in April and dropped in May, which is consistent

with the pattern observed in Figure 3. Insofar as the costs of carrying and financing the spot

 17
(front futures) position in April 2020, net of any convenience yield, did not exceed $0.48 p/b, the C&C arbitrage was still deemed profitable. 17 If our conjecture regarding the role of C&C trading on the negative pricing of CLK20 is correct, the open interest of the April 2020 (CLJ20) and May 2020 (CLK20) contracts should have been particularly high on March 2020 versus historical levels. To assess this, we plot over the 150 trading days preceding the expiration day: i) the open interest of CLJ20 and CLK20, and ii) the 95th percentile of open interest of all the contracts with maturity April and May in prior years (e.g., CLJ19, CLK19 and so on). Figure 4, Panels A and B, present the results and confirm our intuition: contango attracted on March 2020 an unusually large number of positions in CLJ20 and CLK20; for example, the open interest of CLJ20 on March 12, 2020 (that is, 6 trading days before its maturity on March 18, 2020) was at 221,602 and thus very close to the 95th percentile for all April contracts at 230,953. Likewise, the open interest on the May 2020 contract kept rising in March 2020 and reached on April 2, 2020 a level of 634,727; that level of open interest 13 days before maturity had never been attained by any other futures contract before. These unusually large levels of open interest suggest that many traders, seeking to seize risk-free arbitrage profits, acted upon the contango by carrying out C&C arbitrage strategies. [Insert Figure 4 around here] We further hypothesize that the deepening of the contango lead to more and more C&C traders seeking to profit from buying cheap crude oil “spot” prices (i.e., long front futures contract) and selling (short positions on) more distant futures contracts. The futures spread as of April 17, 2020 (or 2 business days before the maturity of CLK20) was at -$6.76 suggesting that C&C arbitrageurs taking a long position in the controversial May 2020 (CLK20) contract 17 Typical monthly storage costs at Cushing are between 10 and 50 cents a barrel. https://www.wsj.com/articles/why-oil-is-11-a-barrel-now-but-three-times-that-in-autumn- 11587392745 and https://br.reuters.com/article/global-oil-storage/oil-plunge-sets-off-search- for-tanks-revives-dormant-cushing-storage-trade-idUKL4N2B95KD. 18
at $18.27 combined with a short position in the June 2020 contract at $25.03, could theoretically

make a high profit. In support of the hypothesis that many C&C trades were initiated as of April

17, 2020, Figure 4, Panel B shows that the open interest of the May 2020 contract (at 108,593)

was unusually high at that very late stage exceeding by a large margin the 95th percentile of

open interest on all previous May contracts (66,375). Figure 4, Panel C, likewise confirms our

conjecture for the short leg of the C&C trade, the June 2020 contract: its open interest was

historically high on April 17, 2020, at 538,038 above the 95th percentile at 524,410.

 In the same spirit as for the other panels, Figure 4, Panel D compares the open interest of

the July 2020 contract to the 95th percentile of open interests on previously traded July contracts

over the 150 days preceding their maturity. The figure suggests an unusually high level of open

interest of the July 2020 contract as of April 17, 2020, suggesting that C&C traders could also

have used that contract for the short leg of their strategy. This is likely since on April 17, 2020,

the spread between the price of the May 2020 contract and that of the July 2020 contract was at

a staggering low level of -$11.15.

 The inventories held at Cushing represented 76% of storage capacity on April 17, 2020 and

rose to a high of 83% on May 1, 2020 (as shown in Figure 3) with the remaining storage capacity

likely already leased by then. 18 C&C traders positioned long in the May 2020 contract and short

in distant contracts could not at that late stage contract store space for crude oil at Cushing,

which suddenly turned the expected amazing C&C profits into expected large losses. They were

thus left with either one of the following stark choices: (a) paying exorbitant storage costs at

maturity (if oil tank leasing was at all feasible) or (b) entering a reversing trade at all costs

before maturity, just to avoid taking delivery, even if that implied selling at the negative price

18
 “The terminals have already contracted their storage 100%” said Ernie Barsamian, chief
executive officer of The Tank Tiger, a terminal storage clearinghouse in Princeton, New Jersey
(April 20, 2020). Although the companies having leased the remaining storage could sublease,
the storage costs of these sublease contracts when there is hardly spare capacity at Cushing
would have been then prohibitively high.
 19
of $-37.63 p/b. In effect, the second alternative amounts to closing the long CLK20 leg of the

C&C trade by paying $37.63 a barrel to a counterparty with storage facility (the counterparty

thus receives both the barrels of oil and the payment); namely, the C&C traders (and possibly,

other long CLK20 holders) on Monday 20th April were willing to pay in order to get rid of their

long contracts so as to avoid the obligation of having to take physical delivery. Observing the

open interest of the May 2020 contract on April 20, 2020 (one day before maturity) in Figure

3, Panel B, it is noticeable that this is indeed what happened. The open interest fell from 108,593

on Friday April 17, to 13,044 on Monday April 20, or by 88%; such a huge drop had never been

seen over one business trading day before. 19

 This empirical evidence is consistent with the model of the “squeeze” put forward by

Bouchouev (2021) where the value of the futures spread is determined by the difference

between two probability density functions, one for the upside squeeze at zero inventories, and

the other for the downside squeeze at zero storage capacity. When both inventories and storage

ability are available the spread coverges to the negative of the storage cost as maturity

approaches. However, if inventories are within reach of the two danger zones, zero inventories

or zero storage capacity, them the spread is driven by the likelihood (probability) of approaching

the extremes which represent two extreme scenarios of default by the C&C trader who seeks to

profit from the carry arbitrage but fails to make or take delivery (e.g., default of C&C

arbitrageurs). In the first scenario (triggered in backwardation), the “reverse C&C” trader fails

to deliver the crude oil because the inventory is zero. In the second scenario, (triggered in

19
 On April 20, 2020, all the WTI futures contracts available experienced a negative return from
April 17, 2020 to April 20, 2020 ranging from a brutal -305.97% (CLK20) to -1% (December
2023; CLZ23). The term structure of WTI futures prices was thus subject not only to a parallel
shift down but also to a severe steepening of its slope (contango). This made matters worse: the
margin profits earned on the short (back-end) positions were not enough to hedge the margin
calls received on the long (front-end) positions. Thus, we argue that the price drop observed on
CLK20 as of April 20, 2020 is in part due to C&C traders choosing to close their long positions
rather than paying ever-increasing margin calls. This observation applies to all CLK20 traders,
not just to those who were unable to secure storage facilities.
 20
contango) the C&C trader fails to deliver physical barrels at expiry as barrels are not available.

The model captures the fact that the actual default event does never happen because futures

contracts are liquidated by the clearing broker, but the price of such liquidation is unbounded.

 What happened next? Figure 4, Panels B and C suggests that on April 20, 2020 the C&C

traders closed the long May 2020 leg, and gradually the short June 2020 leg of their arbitrage

strategy. This is evidenced by open interests on the June 2020 contract dropping by 21% on

April 21, 2020 and by 44% over 4 trading days (from April 20, 2020 to April 24, 2020). The

open interest of the July 2020 contract dropped by 7.66% in one trading day (from April 20 to

April 21, 2020), confirming that the July 2020 contract could have been part of the C&C trade.

4.3 Who else could be responsible for the negative CLK20 pricing?

Aside from C&C traders, who else could have taken long positions in CLK20 and precipitously

closed these positions as of April 20, 2020, bringing the price of CLK20 into negative territory?

4.3.1 Index-trackers and long-only asset managers

The empirical tests in Section 3 ruled out USO as responsible for the negative pricing which

ties well with the fact that it did not hold the CLK20 contract since 7 days before its price crash.

For the same reason, it is unlikely that long-only or long-short index managers are responsible

for the event since they did not held CLK20 a few days before its maturity. Commodity index

providers have no interest in taking or making delivery of the physical asset at maturity and

thus, they typically roll their positions to more distant contracts a few weeks before front-end

contracts mature. For instance, the S&P-GSCI (the first investable commodity index and a

recognizable benchmark of commodity futures performance) rolls its positions from the 5th to

9th business day of the maturity month. Consistent with this observation, Figure 4, Panel B

indicates a sharp fall in CLK20 open interest from 11 to 8 days before maturity (or from April

6, 2020 to April 9, 2020), and more generally sharp falls in the open interest of all contracts

over the same dates. Hence, like USO, index trackers are very unlikely to have held positions
 21
on CLK20 on the days preceding its negative pricing, and therefore their trades cannot have

induced the event. Anecdotal evidence from the Financial Times (April 28, 2020) or the New

York Times (May 21, 2020) reveals, however, that some long-only fund managers (e.g., Crude

Oil Treasure managed by Bank of China) still had not rolled their positions on CLK20 two days

before maturity and thus, to avoid delivery, they closed their positions on April 20, 2020 at

negative prices. These ill-informed investment managers bore the same losses as those incurred

by the C&C traders who had not secured storage facility.

4.3.2 Hedge funds other than those engaging in C&C trades

Could long-short speculators (e.g., CTA managers) other than the ones who engaged in C&C

trades be blamed for the negative pricing of CLK20? We see this as unlikely, first, because

speculators also roll their contracts at least two weeks prior to maturity to avoid illiquidity-

driven price distortions. Second, because as of March 31, 2020 (or 15 days before maturity; T-

15) various trading signals hinted towards a poor forthcoming performance of CLK20 and thus,

rational speculators ought to have then taken short, rather than long, positions in that contract.

 First, at T-15 and as detailed in the sections above, the crude oil supply was at a staggering

high level while demand was very low, and inventories at Cushing were rising, hinting towards

a price fall (Gorton et al., 2013). Relatedly, second, the futures spread was very negative at -

$4.03 (compared to a 5th percentile of -$1.41 from March 30, 1983 to June 29, 2020). Thus, the

term structure of crude oil futures prices was upward-sloping and very steep at T-15 which

predicts a drop in CLK20 prices (Erb and Harvey, 2006; Gorton and Rouwenhorst, 2006).

 Third, at T-15 the average of CLK20 daily returns over the preceding 50 trading days was

very low at -2.11% (compared to the 5th percentile of the distribution of all contracts from

March 30, 1983 to June 29, 2020 at -0.56%). According to the momentum literature, this highly

negative momentum signal predicted poor performance of CLK20 in the run-up to maturity

(Miffre and Rallis, 2007; Moskowitz et al., 2012).

 22
Fourth, the basis-momentum signal took at T-15 the very negative value of -0.0036

(compared to a 5th percentile of -0.0006 from March 30, 1983 to June 29, 2020) which is also

a warning signal of a price drop.

 Finally, the relative basis signal at T-15 takes a negative value of -$0.85 (compared to a 5th

percentile of -$0.52 from March 30, 1983 to June 29, 2020). Thus, the term structure of WTI

futures prices was unusually concave, suggesting that the-then front-maturity contract (CLK20)

might be overpriced. Table 4 summarizes all predictive signals over the entire sample period.

 [Insert Table 4 around here]

 Since CTAs and managed futures funds rely on some (or a mix) of the above signals as

predictors of futures prices (e.g. Asness et al., 2015; Fernandez-Perez et al., 2019), it is

reasonable to assume that they took short (instead of long) positions in CLK20 on March 31,

2020, in the hope of closing them nearer maturity at much lower prices, and thus, earning a

premium. By entering a reversing (long) trade closer to maturity (e.g., at T-2), these short

speculators offered the C&C traders that were seeking to reverse their positions part of the

liquidity that they craved for and thus, if anything, they prevented the negative price event

suffered by the May 2020 delivery contract from being even more dramatic than it was.

4.3.3 What about the long hedgers?

Could one explanation for the negative pricing of CLK20 on April 20, 2020 be that many long

CLK20 hedgers (i.e., processors or consumers of crude oil) desperately sought to enter a

reversing trade one day before maturity and precipitated the negative pricing of the contract?

We see this as unlikely for two reasons. First, as the WTI market entered a phase of deep

contango, long hedgers had an incentive to decrease their long hedge, rather than increase it

(see Stulz, 1996 on selective hedging). 20 Some processors and consumers of WTI crude oil

20
 Selective hedging is a common practice of hedgers (consumers and producers) who
simultaneously seek to reduce the risk of their spot position (risk minimization) and earn a
 23
might even have considered the possibility of not hedging at all, hoping to buy crude oil in the

spot market at a very low price when needed in the near future. Second, hedgers typically close

their positions before maturity and therefore, do not take (or make) delivery; thus, very few

hedgers shall have ended up in the dire predicament of C&C traders; namely, as of April 20,

2020 very few hedgers shall have been long CLK20 and short storage facility.

5. Conclusions

On April 20, 2020 the NYMEX WTI crude oil futures market crashed and the prices of the May

2020 delivery contract (CLK20) fell into very negative territory. Energy market pundits hinted

that United States Oil fund (USO), the largest WTI crude oil exchange traded fund, had induced

the negative pricing. Using a comprehensive data set of WTI crude oil futures prices and USO

open interest we conduct formal empirical tests of this contention. The results reveal that USO

is not responsible for the negative pricing of CLK20. More generally, we show that USO flows

do not Granger-cause the prices of WTI futures contracts in general, nor of CLK20 in particular.

 Further analysis suggests that a disastrous blend of macroeconomic and geopolitical

conditions, such as a rising surplus triggered by geopolitical tensions and a demand obliterated

by the Covid-19 lockdowns, prompted a super-contangoed WTI futures market. The steep

upward-sloping term structure of WTI futures prices, in turn, attracted a splurge of cash-and-

carry (C&C) arbitrages with a perverse feedback effect. The increase in long front-maturity

C&C positions contributed to boost the storage utilization at Cushing, the storage hub where

the NYMEX WTI futures contract is settled. The sharp build-up of inventory induced by the

long leg of C&C arbitrage strategies ended up depleting the available storage capacity at

Cushing. In the second and third weeks of April 2020, long WTI futures holders (mostly C&C

arbitrageurs) panicked upon the realization that there was effectively no storage facility left at

premium by forecasting price changes (speculation). Through selective hedging they under- or
over-hedge their risk exposures.
 24
Cushing, and sought to get rid of their contracts at unprecedented negative prices to avoid taking

delivery. Rather than the long index trackers like USO, the C&C arbitrageurs played a key role.

 25
References
Ahmadi, M., Bashiri Behmiri, N., Manera M. (2020). The theory of storage in the crude oil
 futures market, the role of financial conditions. Journal of Futures Markets 40, 1160-1175.
Alquist, R., Ellwanger, R. and J. Jin (2020). The effect of oil price shocks on asset markets from
 oil inventory news. Journal of Futures Markets 40, 1212-1230.
Auroba, S.B., Diebold, F.X,, and C. Scotti (2009). Real time measurement of business
 conditions Journal of Business and Economic Statistics 27, 417-27.
Asness, C., Moskowitz, T., Pedersen, L., 2013. Value and momentum everywhere. Journal of
 Finance 68, 929-985.
Baker, S. R., Bloom, N., and Davis, S. J. (2016). Measuring economic policy uncertainty. The
 Quarterly Journal of Economics 131, 1593-1636.
Bessembinder, H., Carrion, A., Tuttle, L. and Venkataraman, K., 2016, Liquidity, resiliency
 and market quality around predictable trades: Theory and evidence, Journal of Financial
 Economics 121, 142-166
Bollerslev, T., 1986, Generalized autoregressive conditional heteroskedasticity, Journal of
 Econometrics 31, 3, 307-327.
Boons, M., Prado, M., 2019, Basis momentum, Journal of Finance 74, 239-279.
Bouchouev, I., 2021. A lesson from physics in oil prices: Revisiting the negative WTI price
 episode, The Oxford Institute for Energy Studies January 2021.
Brennan, M., 1958, The supply of storage, American Economic Review 48, 50-72
Byun, S.-J., 2017. Speculation in commodity futures markets, inventories and the price of crude
 oil, Energy Journal 38, 93-113.
Davis, A., 2007, Where has all the oil gone? Wall Street Journal (Oct. 6, 2007).
Ederington, L., Fernando, C., Holland, K., Lee, T. Linn, S., 2020, Dynamics of arbitrage,
 Journal of Financial and Quantitative Analysis, 1-31.
Erb, C., Harvey C., 2006. The strategic and tactical value of commodity futures, Financial
 Analysts Journal 62, March/April, 69-97.
Fattouh, B., Kilian, L., and Mahadeva, L., 2013.The role of speculation in oil markets: What
 have we learned so far?, Energy Journal 34, 7-33.
Fernandez-Perez, A., Fuertes, A.-M., and Miffre, J., 2019. A comprehensive appraisal of style-
 integration methods, Journal of Banking and Finance, 105, 134-150.
Geman, H., Ohana, S. (2009). Forward curves, scarcity and price volatility in oil and natural
 gas markets. Energy Economics 31, 576-85.
Geman, H., Smith, W. (2013). Theory of storage, inventory and volatility in the LME base
 metals. Resources Policy 38, 18-28.
Gorton, G., Hayashi, F., Rouwenhorst, G., (2013). The fundamentals of commodity futures
 returns, Review of Finance 17, 35-105.
Gorton, G., Rouwenhorst, G., (2006). Facts and fantasies about commodity futures, Financial
 Analysts Journal 62, March/April, 47-68.
Gu, M., Kang, W., Lou, D., Tang, K., 2019. Relative basis and risk premia in commodity futures
 markets, SSRN working paper No. 3404561.
Kaldor, N., 1939, Speculation and economic stability, Review of Economic Studies 7, 1–27.
Kilian, L., 2016. The impact of the shale oil revolution on U.S. oil and gas prices. Review of
 Environmental and Economic Policy, 10, 185-205.

 26
You can also read