On the Use of Climate Information in Africa - Richard Washington & Gillian Kay Oxford University Centre for the Environment
←
→
Page content transcription
If your browser does not render page correctly, please read the page content below
On the Use of Climate
       Information in
           Africa
Richard Washington & Gillian Kay
Oxford University Centre for the Environment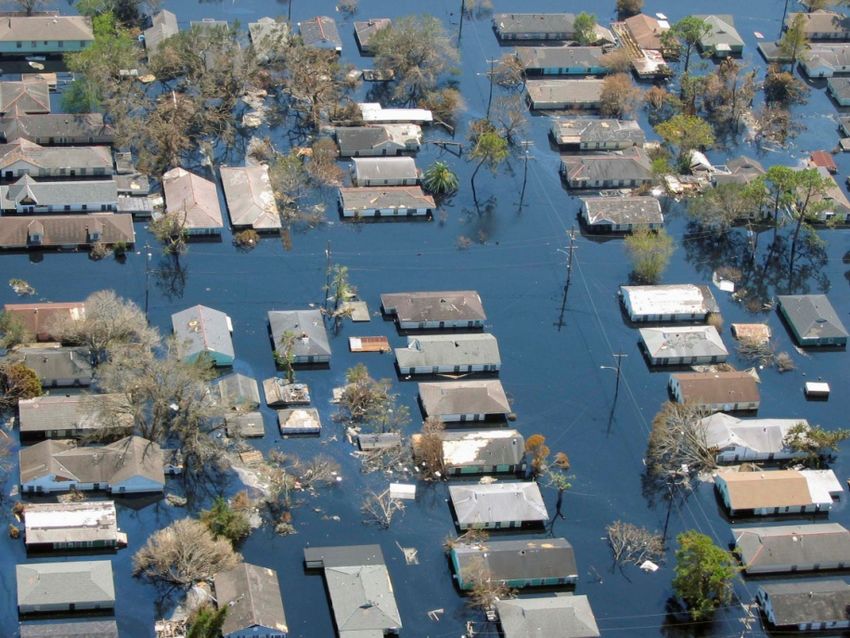
Some African Climate Background

• Reliance on rain-fed subsistence
  agriculture (30% GDP from agric, 75%
  living in rural areas, 60% of rural income
  from the land)

• Signature of large interannual and, in the
  subtropics, multi-decadal variability (e.g.
  Sahel)
Rainfall and GDP

Ethiopia

                                  Kenya

           World Bank 2005: Acknowledgement: Jamal Saghir
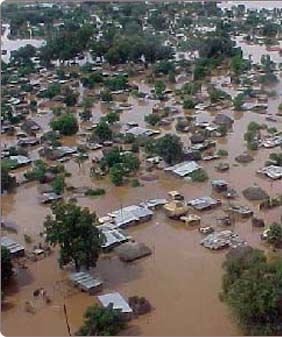
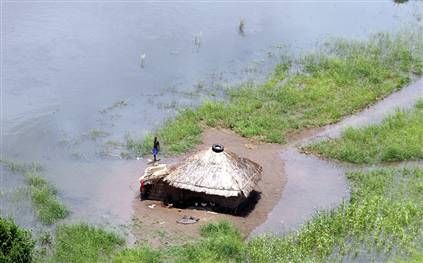
Mozambique floods of 2000 reduced
Growth rate from 8% to 2.1%
Mozambique Floods of 2000

• 90% of the country's functioning irrigation
  infrastructure was damaged, causing the worst of
  the agriculture losses suffered.
• 1,400 km2 of agricultural land lost
• 20,000 cattle lost
• 630 schools closed, leaving 214,000 pupils without
  classrooms.
• 42 health units destroyed, including Beira Central
  Hospital, the second largest in the country.
• The Mozambican government requested $450
  million in international aid at a donor conference
  held in Rome in early May, 2000.
Tuareg Republic of Tumoujgha

Conflict and Unrest

Sahel drought has been linked to the Taureg
rebellion of 1990s in N. Mali and N. Niger.

Role of climate in Dafur conflict is being debated.
African Climate: Recent Development

• Regional Climate Outlook Forums in Africa
  (RCOFS e.g. SARCOF, PRESAO,
  GHACOF) celebrate 10 years
• Gleneagles G8 2005: Africa and Climate
  Change
• DFID, Oxfam, World Bank, UNDP
• CLIMDEV – AU, AfDB and ECA
• CGIAR-ESSP CCCP: West and East
  African focus
Outline

• What kind of climate information are
  interested parties (DFID/Oxfam/World
  Bank) asking for?
• What are the key problems which emerge
  from this engagement?
• What can we do about these problems?
What kind of climate information are
 interested parties (DFID/Oxfam/World
 Bank) asking for?

  – Climate in 2015-2020s for countries/regions
  – Extremes:
    • Will floods/droughts become more intense?
    • If the climate is becoming wetter will there still be
      droughts?
  – At what scale can climate model data be
    used?
  – Can we expect changes in seasonality?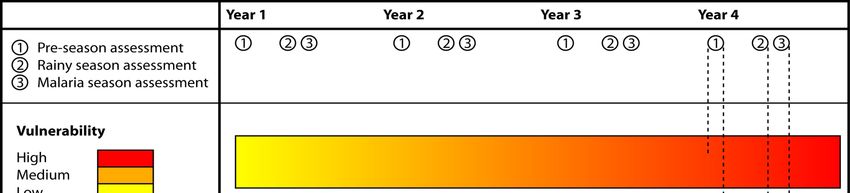
2015-2020s

       Weather                                        Climate
                           SIP          Decadal
      Forecasting                                     Change

                            time

  Limited skill
                                                     Climate
Poor initialisation   Growing
                                     Big Gap!         Change
       data           Industry
                                     Methods       Important for
   Consumes            RCOFs
                                   experimental Mitigation evidence/
   Resources
                                                     advocacy
    Aviation
CCCMA CGCM3.1 MAM precip seasonal anomalies (relative to 1961-90) with model and observed
climatologies
Generally
wetterCSIRO Mk3.0 MAM precip seasonal anomalies (relative to 1961-90) with model and observed
climatologies
Generally
drierMPI ECHAM5 MAM precip seasonal anomalies (relative to 1961-90) with model and observed
climatologies
Depends on
Decade and
SRESChange in precip against change in SAT relative to 1961-90 climatology for
2020s (pale blue), 2050s (mid blue) and 2080s (dark blue)
Precip anomaly
(mm/day) SAT anomaly (°C)• Climate information more quantitative than
for any other sector of planning
• Mixed signals, esp in rainfall
– Sahel (Cook&Vizy 2006 Vs Hoerling et al 2006)
– East Africa: OND increase, MAM more mixed
– Southern Africa: GCM mixed, some
downscaling shows more consensus
• Areas with highly uncertain futures are
passed overWhat kind of climate information are interested parties asking for? – 2015-2020s – Extremes, e.g. floods and droughts: possible to calculate metrics from IPCC AR4 CMIP3 data but how good are the models? • Southern Africa • East Africa
ENSO Teleconnections
Obs                              HadAM3

  Nino 3 – southern African rainfall correlations

  MPI              r=0.32           GFDL            r=-0.35
  HadCM3           r=-0.09          CSIRO           r=0.19
  CNRM             r=0.08           NCAR            r=-0.34
Southern African Rainfall Index
             Extreme wet years: 1974 + 1976

60
50
40
30
20
10
 0
-10
-20
-30
-40
      1900

             1904

                    1908

                           1912

                                  1916

                                         1920

                                                1924

                                                       1928

                                                              1932

                                                                     1936

                                                                            1940

                                                                                   1944

                                                                                          1948

                                                                                                 1952

                                                                                                        1956

                                                                                                               1960

                                                                                                                      1964

                                                                                                                             1968

                                                                                                                                    1972

                                                                                                                                           1976

                                                                                                                                                  1980

                                                                                                                                                         1984

                                                                                                                                                                1988

                                                                                                                                                                       1992

                                                                                                                                                                              1996
             What causes these extreme events?
Washington and Preston 2006 JGR
1996
1992
1988
1984
1980
1976
SSTA JFM 1974
1972
1968
1964
1960
1956
1952
1948
1944
1940
1936
1932
1928
1924
SSTA JFM 1976
1920
1916
1912
1908
1904
1900
60
50
40
30
20
10
0
-10
-20
-30
-40Washington and Preston 2006 JGR
SST patterns in 6 coupled models from IPCC AR4

                                   Kay and Washington 2008
Model rainfall associated with SST patterns in 6 coupled models UKMO MPI CNRM CSIRO GFDL NCAR
East African Teleconnections

• Conway et al 2007 GRL
• GCM simulations of the Indian Ocean Dipole influence
  on East African rainfall
• Mean climate is reasonably well simulated in 6 models
• 5/6 models reproduce correlation observed correlation
  between IOD and East African rainfall
• 2080s: 3/6 models trend to positive IOD phase, 2/6
  decrease and 1/6 no change
• Rainfall extremes are driven by IOD – so what can we
  say about these extremes?
Do the climate models simulate
   teleconnections sufficiently well to assess
            extremes quantitatively?

• Africa is influenced by all three ocean basins
• Multiple teleconnections
   – Southern Africa: ENSO and SWIOD
   – East Africa: ENSO and IOD
   – Sahel: THC/MOC, ENSO and Atlantic modes
• No – extremes in the models are not simulated for the
  right reasons
Outline • What kind of climate information are interested parties (DFID/Oxfam/World Bank) asking for? • What are the key problems which emerge from this engagement? • What can we do about these problems?
What are the key problems which emerge from this
                  engagement?

•   Off the shelf studies assumed to exist
•   Short term consultancies are not long enough to properly research
    the model behaviour
•   Data from climate models are used where models have never been
    assessed for the region in question

•   Methodologies for interpreting climate information in the 2015-2020s
    band (on which immediate decisions are being made) are crude and
    highly simplified (a long way from our finest hour as climate
    scientists!)

•   Mixed rainfall signals (e.g. wet/dry futures) result in regions being
    ignored wrt climate planning

•   Extremes in the models occur for the wrong reason but results on
    extremes are still being provided
Outline • What kind of climate information are interested parties (DFID/Oxfam/World Bank) asking for? • What are the key problems which emerge from this engagement? • What can we do about these problems?
What can we do about these problems?

• Huge step-up in effort going into coupled
  model analysis
• Document performance of often-requested
  metrics in models
• Make funding bodies aware of the
  importance and urgency of this work
  – Meanwhile…….make sure gains in simple
    use of climatology are maximised
Malaria in Botswana
Botswana straddles the southern margins of malaria transmission in sub-Saharan
Africa.
The incidence of malaria varies
considerably from district to district –
showing a general decreasing north-
south pattern from more stable to less
stable malaria.
In Botswana the incidence of malaria
varies considerably from year to year –
and as such malaria is considered to be
‘unstable’ and prone to periodic
epidemics.
Simon MasonMalaria in Botswana
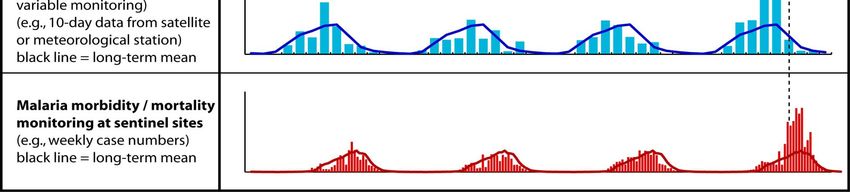
The disease is highly seasonal and follows the rainy season with a lag
of about 2 months
Simon MasonMalaria in Botswana
Malaria incidence in Botswana
is strongly related to rainfall
variability during the peak
rainfall season December –
February.
The relationship is non-linear:
incidence peaks at about 4 mm
per day.
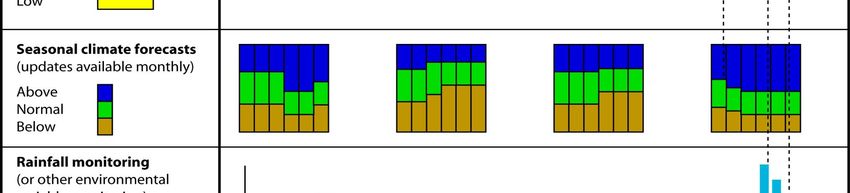
Simon MasonCase surveillance requires no climate data, but provides minimal warning
Monitoring of observed rainfall provides about 2 months warning
Seasonal climate forecasts, provide an additional 3 or 4 months warning
Vulnerability trends may be partly related to climate trends
The Angola Malaria, HIV/AIDS, and Tuberculosis Control Project

•prevention, diagnosis, treatment, and care and support.

•2004-2010

•39.6 m USD

•Malaria Prevention focused on southern Angola

•Preventative spraying worth approx 5m USD

•Spraying took place during the dry season so spraying ineffectual

•Annual cycle of rainfall (basic climatology) not considered.
What can we do about these problems?

• Huge step-up in effort going into coupled model
  analysis
• Document performance often-requested metrics
  in models
• Make funding bodies aware of the importance
  and urgency of this work
  – Meanwhile…….make sure gains in simple use of
    climatology are maximised
  – Focus on studies which demonstrate the usefulness
    of seasonal prediction information
SADC Drought Monitoring Centre
STATEMENT FROM THE SOUTHERN AFRICAN REGIONAL
CLIMATE OUTLOOK FORUM, 1999
13-17 September 1999, Maputo, Mozambique
1.1 SUMMARY
There are high probabilities of
normal to above-normal rainfall
conditions over much of southern
Africa during the period October
1999 - March 2000. There are also
high probabilities of normal to
above-normal rainfall over the
south-eastern part of the regionWCRP Position Paper on Seasonal Prediction: Feb 2008 Total list of African Seasonal Forecast Use: • Météo-France uses dynamical long range forecast information for the Senagal Manatali dam via a water management model. • The UK Met Office for several years has provided seasonal forecasts specifically for the Volta River water management project.
What can we do about these problems?

• Huge step-up in effort going into coupled model
  analysis
• Document performance often-requested metrics
  in models
• Make funding bodies aware of the importance
  and urgency of this work
  – Meanwhile…….make sure gains in simple use of
    climatology are maximised
  – Focus on studies which demonstrate the usefulness
    of seasonal prediction information
  – Work out why seasonal prediction information is not
    acted up
Often quoted reasons for non-use of
seasonal forecasts
• Skill of prediction is too low
• Terciles hard to understand
• Probabilities impossible to understand
• Problems of communication between scientist and users
• Climate events seen as inevitable
• But are these the root causes?
• non-climate example of predictive failure in a
development setting: South Africa’s electricity generationearly 1990s - Eskom advises municipalities to close down power stations as "too much power" is being generated. Power plants are shut down or mothballed – e.g. Komati, Camden, Cape Town (x2) Grootvlei Power Stations. 1998 - Energy Policy of SA White Paper, approved by Cabinet, “surplus capacity will be fully used by 2007”. Report signed by energy minister. 1998 - Government instructs Eskom to stop building new power plants. 2003 - Former Energy Minister says there is no looming power crisis. She says Eskom CEO assured her SA will never run out of power. 2005 – Energy Minister assures SA there is no national power crisis, despite numerous power cuts throughout this year and 2006. In December 2005, problems surface at Koeberg, SAs only nuclear power station - Poor planning and a lack of maintenance exposed 2006-2007 - SA experiences intermittent power cuts, Eskom's top managers received huge salaries and bonuses – e.g. CEO R6.1m package January 2008 - Extensive power cuts plague SA. Government declares the power problems "a national emergency“ says power cuts expected for five to seven years to come. January 25, SA's major gold, diamond and platinum mines shut down. Load shedding schedules publicized.
Mkondeni Load shedding Schedule A
(TUE, THURS, SAT, SUN):
Stage 1 Shedule A: Up to 243MW
00:00 to 02:30
Albert Falls (Nb 36,37,38), Amatikulu, Amatikulu
Traction, Bergvliet, Brakfontein, Cedarville, Curry’s
Post, Karkloof, Davel, Dejagersdrift Traction,
Doringberg Traction, Dundee, Dundee, Eshowe,
Franklin, Gingindlovu, Gowrie Rural, Harding, Hospital
(Except Nb Hv,He), Hudley Traction, Ingeli, Kingsley
Traction, Leksand, Malonjeni Tracion,

Mandawe, Matatiele, Mhlatuze, Mt Frere, Mzintlava, Ngwelezane, Nkwaleni, Paddock, Spioenkop, St
James, Sundumbili, Talana Traction, Taveta, Volksrust, Munic negotiated load curtailment (60MW)
02:00 to 04:30
Alpha, Bergville, Cedara (Nb 5,6,13), Chievely Traction, Colenso Rural, Colenso Town, Coronation,
Dagbreek,Dolphin Coast Munic, Driel, Emmaus, Ernersdale Traction, Frere Traction, Hlobane, Izothsha,
Jagersrust, Louwsberg, Margate, Marina, Montreux, Mpophomeni, Nqabeni, Port Edward, Ramsgate,
Stillwater Traction, Strathcona Traction, Uitkoms, Umgababa, Uvongo, Vaalkrans, Vryheid, Vryheid
Traction, Winterton, Munic negotiated load curtailment (60MW)
04:00 to 06:30
Appelsbosch, Blaauwbosh, Buffelshoek, Catkin, Cygnus, Dalton, Doornkop, Driefontein, Glendale,
Gruneck, Hluhluwe, Kokstad Munic, Kwambonambi, Mairscamp, Mkuze, Mtubatuba, Nseleni, Plains (Nb
1,3), Port Shepstone Munic, Riversmmet, Rutland, Stafford, Swayimana, Vlaklaagte, Wartburg, Munic
negotiated load curtailment (60MW)
06:00 to 08:30
Abattoir, Balgowan Traction, Beacon Hill Traction, Bloedrivier Rural, Clontarf, Clontarf Traction, Craigiburn,
Edendale, Emondlo, Ixopo, Kamberg, Kelso Traction, Kingsdale, Lidgetton, Lidgetton Traction, Lions River
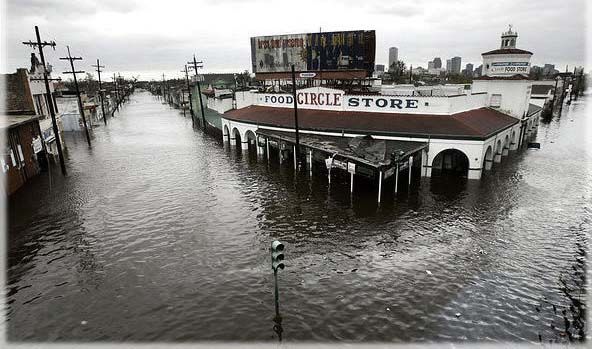
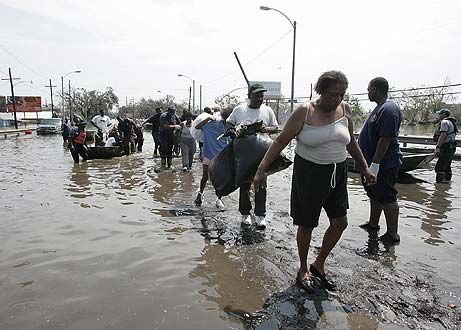
Some things that will make a
difference
• Recognition that working with
governments/large institutions is probably
the hardest way to promote the use of
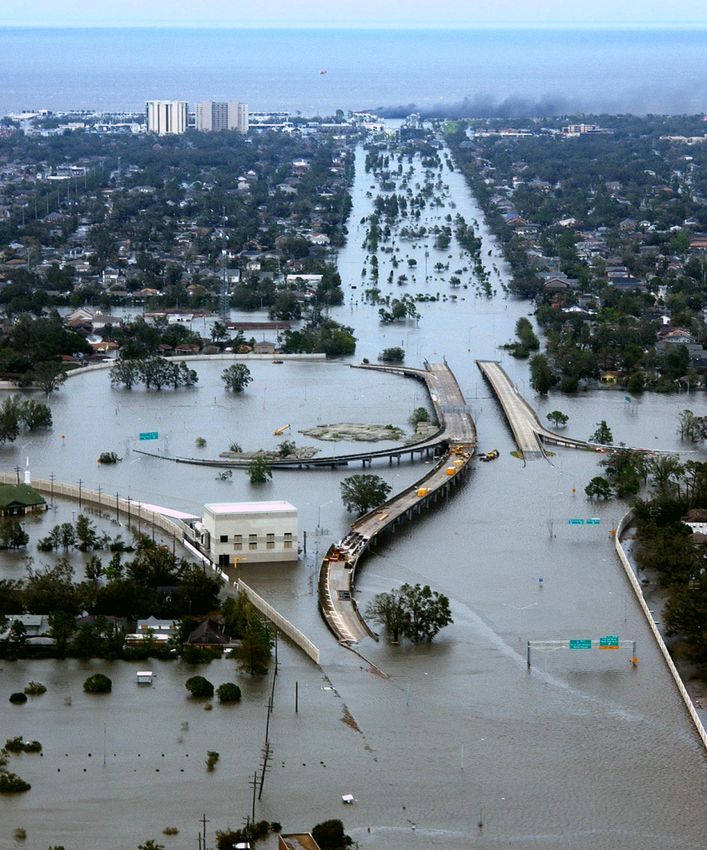
climate info (see SA electricity and New
Orleans!)
• Recognising the urgent need for small-
scale, simple demonstration studies which
can show the value of climate informationPossible Ways forward • Status quo: climate scientists continue with focus on SIP and long term CC, some NGOs and Foreign Govt Departments involved, climate information slowly included in decisions but few African Govts come to the party. No real gain from climate information. • High Road: climate information absorbed into decision making, big time for climate science which earns rightful place in continent with great exposure to climate: positive feedback to climate funding • Low Road: current initiatives fail – dearth of climate adaptation information in the window 2015-2025 kills off early initiatives. Resources withdrawn from further climate initiatives.
You can also read