Optimisation of Scores Generated by an Online Feline Health-Related Quality of Life (HRQL) Instrument to Assist the Veterinary User Interpret Its ...
←
→
Page content transcription
If your browser does not render page correctly, please read the page content below
ORIGINAL RESEARCH
                                                                                                                                            published: 06 January 2021
                                                                                                                                       doi: 10.3389/fvets.2020.601304

                                             Optimisation of Scores Generated by
                                             an Online Feline Health–Related
                                             Quality of Life (HRQL) Instrument to
                                             Assist the Veterinary User Interpret
                                             Its Results
                                             Vinny Davies 1 , Jacqueline Reid 2* and E. Marian Scott 3
                                             1
                                               School of Computing Science, University of Glasgow, Glasgow, United Kingdom, 2 School of Veterinary Medicine, University
                                             of Glasgow, Glasgow, United Kingdom, 3 School of Mathematics & Statistics, University of Glasgow, Glasgow,
                                             United Kingdom

                                             Using methodology previously described for the dog health-related quality of life (HRQL)
                             Edited by:
                    Alan G. McElligott,      tool (VetMetricaTM ), the aim was to optimize the scores profile of a comparable feline
         City University of Hong Kong,       online HRQL instrument for monitoring HRQL in cats, to assist in its interpretation.
                            Hong Kong
                                             Measuring HRQL helps quantify the impact of disease and its treatment on well-being,
                      Reviewed by:
                       Lauren Finka,
                                             aids clinical decision making and provides information in clinical trials. In Study 1, using
         Nottingham Trent University,        data collected from previous studies, scores generated for three domains of HRQL
                     United Kingdom          (Vitality, Comfort, Emotional Well-being) in healthy cats were normalized using standard
                          Janice Vaz,
  Western Sydney University, Australia       statistical techniques of logit transformation and T-scores, such that the average healthy
                       Jenna Kiddie,         cat has a score of 50 in all three HRQL domains. Using normalized scores from
         Dogs Trust, United Kingdom
                                             healthy and sick cats, a threshold score of 44.8 was determined, above which 70%
                    *Correspondence:
                       Jacqueline Reid
                                             of healthy cats should score. Study 2 determined the Minimal Important Difference (MID)
           jacky.reid@newmetrica.com         in normalized score that constituted a clinically significant improvement in each domain.
                                             Three methods were tested in order to determine the MID, with the final choice made
                    Specialty section:
                                             based on statistical and clinical considerations. Thresholds of 5, 7.5, and 5 were chosen
         This article was submitted to
         Animal Behavior and Welfare,        for the three HRQL domains representing Vitality, Comfort and Emotional Well-being,
                a section of the journal     respectively. This study makes available a means of displaying HRQL scores from an
        Frontiers in Veterinary Science
                                             online application in an easily interpretable manner and quantifies a clinically meaningful
          Received: 31 August 2020
       Accepted: 01 December 2020
                                             improvement in score. To illustrate the practical application of these developments, three
        Published: 06 January 2021           case examples are presented. Example 1 illustrates the raw and normalized scores for a
                              Citation:      group of overweight cats enrolled in a Feline Weight Management Programme. Example
Davies V, Reid J and Scott EM (2021)
                                             2 shows three groups of osteoarthritic cats, each with different severity of disease.
Optimisation of Scores Generated by
      an Online Feline Health–Related        The third is an elderly, un-well cat whose HRQL was recorded over time, specifically
  Quality of Life (HRQL) Instrument to       to facilitate end of life discussion between owner and veterinary clinician.
Assist the Veterinary User Interpret Its
   Results. Front. Vet. Sci. 7:601304.       Keywords: health-related quality of life, cats, optimisation, health status, threshold, minimum important difference,
     doi: 10.3389/fvets.2020.601304          interpretability, score normalization

Frontiers in Veterinary Science | www.frontiersin.org                              1                                          January 2021 | Volume 7 | Article 601304
Davies et al.                                                                                                                   Health-Related Quality of Life in Cats

INTRODUCTION                                                                         Active/Comfortable (A/C), Calm/Relaxed (C/R)) compared with
                                                                                     3 for the cat–Vitality, Comfort, Emotional Well-being (EWB).
In humans HRQL measurement is an important research area,                            These domains were derived using a multivariate statistical
quantifying the impact of disease and its treatment on an                            analysis called factor analysis (FA). Factor analysis is a technique
individual’s daily well-being, to aid clinical decision making,                      that is used to reduce a large number of variables into fewer
provide an outcome measure in clinical trials and contribute to                      numbers of factors, in this case domains of HRQL. Details of
healthcare policy (1). The development of HRQL instruments                           this process for the dog and cat tools can be found in Reid et
for companion animals is growing and their value is increasingly                     al.’s and Noble et al. (9–11), but briefly, using a test data set,
recognized (2). HRQL instruments can be disease specific or                          several factor solutions are explored, each of which consists of
generic (3–8). Generic instruments measure quality of life (QOL)                     a different number of factors. The optimum factor solution is the
in healthy or sick animals and are the only option when co-                          one that accounts for the most variability in the data, so for the
morbidities are present, as is the case with older animals. Profile                  dog, the four factor solution was optimum accounting for 72% of
rather than single item HRQL measures generate scores in                             the variance (10) and in the cat the optimum solution contained
multiple domains of HRQL, allowing for comprehensive analysis                        three factors, accounting for 72.3% of the variance (11).
of HRQL changes over time, in contrast to a single item score                            Although interpretability is a key element of a useful
which only tells us if an animal is better or worse.                                 measurement scale, to date there is no agreement as to how
    Previously we reported the development, validation and                           HRQL scores should be presented to ensure the ease with which
reliability of web-based generic HRQL profile measures for the                       a user can interpret them. Users should be able to understand
dog (9, 10) and the cat (11). They consist of simple behavioral                      what an individual score produced by an instrument means, for
questions (questionnaire items) for the owner (22 for the dog                        example by comparing the score to a healthy population. They
and 20 for the cat) that are scored on a 0-6 scale (0 = could                        also need to know when any variation in scores is meaningful,
not be less and 6=could not be more) and completed online in                         for example is the treatment really working or is the disease
around 5 min. A list of these items which are either positive—for                    really worsening as time goes on? This is currently an important
example “active,” or negative—for example “listless,” is available                   research focus in the medical field (12), where according to
in Noble et al. (11). The dog tool generates scores in four domains                  these authors “the choice of what constitutes an important
of HRQL -Energetic/Enthusiastic (E/E), Happy/Content (H/C),                          difference in a HRQL score will influence judgements about the

 FIGURE 1 | Boxplots showing the raw and normalized HRQL domain scores for sick (red) and healthy (green) cats. The threshold for the normalized scores is set at
 44.8 for all domains, with 70% of healthy cats estimated to score above this threshold. The shaded gray area represents the area below the 44.8 threshold score.

Frontiers in Veterinary Science | www.frontiersin.org                            2                                          January 2021 | Volume 7 | Article 601304
Davies et al.                                                                                                                  Health-Related Quality of Life in Cats

success of a health care intervention, the required sample size                          disease and its treatment (10). As a result, interpretability is
of clinical studies, and the design of these studies.” Health—                           equally as important in the veterinary as well as the medical field.
related quality of life instrument development is an expanding                               Currently, several techniques have been suggested to enhance
area in the veterinary arena and there is increasing appreciation                        interpretability of health measures for people including linking
of their value in measuring well-ness within a model of veterinary                       the scores to those of a specific population (norm-based
preventative healthcare and measuring the impact of chronic                              scoring) such as a general population, populations with similar
                                                                                         demographics or to a population with a specific disease (13).
                                                                                         The scores profile of the dog tool was optimized to improve
                                                                                         its interpretability by normalizing the scores to the age-related
                                                                                         healthy dog population and deriving a threshold as a guide
                                                                                         to the health of the dog (14). A detailed description of the
                                                                                         rationale underlying the choice of these procedures can be
                                                                                         found in Davies et al. (14). The significance of a change in
                                                                                         score can be quantified through the calculation of a Minimum
                                                                                         important difference (MID). This has been defined as “the
                                                                                         smallest difference in score in the outcome of interest that
                                                                                         informed patients or informed proxies perceive as important,
                                                                                         either beneficial or harmful, and which would lead the patient
                                                                                         or clinician to consider a change in the management” (15).
                                                                                         The MID can be established using distributional and/or anchor-
                                                                                         based techniques. A distribution-based approach relies on the
                                                                                         statistical properties of the instrument and does not involve an
                                                                                         external impression of change. Examples include effect size (16),
                                                                                         normalized response mean (17) and the modified normalized
                                                                                         response mean (18). On the other hand, anchor-based techniques
                                                                                         use an external impression such as the patient’s perception of
 FIGURE 2 | Density plot of the theoretical distribution of the healthy cat              a significant improvement or worsening of their condition to
 population. (A) denotes the threshold for dividing healthy and sick cats, the           identify the change on the HRQL scale that corresponds to the
 30th percentile (a HRQL score of 44.8). Above this threshold (to the right of the       MID (19). Such global measures of change are however strongly
 plot) are 70% of the healthy cat population predicted to be healthy, the area           affected by the context in which they are used and subject to much
 marked by (B). Below the threshold (to the left of the plot) are 30% of the
                                                                                         variability making dependance on these problematic. Deyo and
 healthy population predicted to be sick, the area marked by (C).
                                                                                         Centor (20) suggested that scales could be viewed as “diagnostic

 FIGURE 3 | Reproduced with kind permission of Dr. Barr Hadar, Ontario Veterinary College, University of Guelph. Means and 95% confidence intervals for HRQL
 scores in Vitality, Comfort, Emotional Well-being for a group of 21 overweight cats enrolled on a weight loss programme whose owners completed a baseline score
 before treatment and then four assessments at approximately monthly intervals. A, Raw domain scores; B, Normalized domain scores. A score of 50 = the average
 healthy cat score and 70% of healthy cats will score above the 44.8 threshold.

Frontiers in Veterinary Science | www.frontiersin.org                                3                                     January 2021 | Volume 7 | Article 601304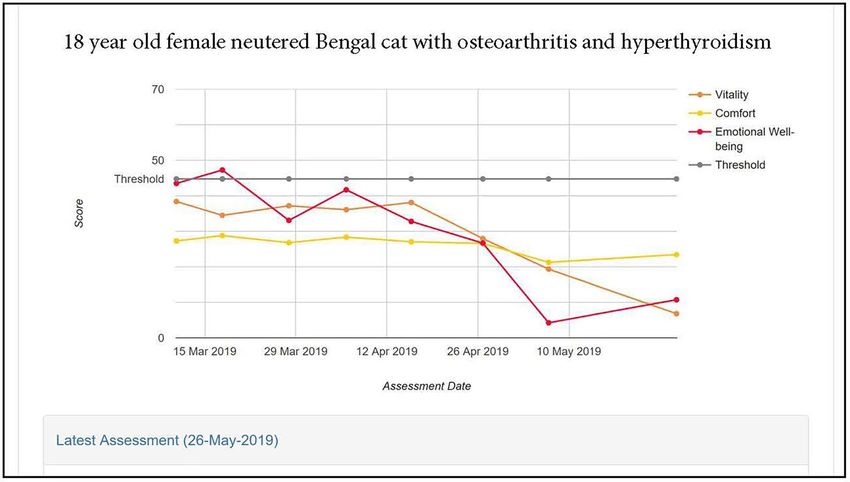
Davies et al.                                                                                                           Health-Related Quality of Life in Cats

tests” for distinguishing improved patients from those that had                 Step 1: Transformation of raw 0−6 scores for each of
not, with receiver operating characteristic (ROC) curves being              the three HRQL domains to a continuous scale, using a
utilized to describe a scale’s ability to identify improvement. This        logit transformation.
more objective method to determining the MID using ROC was                      To allow the use of a logit transformation, HRQL scores (d)
used in the dog study (14). Briefly, the characteristics of the test,       on the scale of 0−6 were converted to lie between 0 and 1,
namely sensitivity and specificity, which describe how well the             excluding exact 0 and 1 values. This was achieved by adding an
test discriminates between two groups are calculated. Sensitivity           arbitrary value, 0.1, at each end of the scale and dividing by 6.2
describes how well a test identifies those with a particular                (the maximum score after the arbitrary values has been plus 0.1)
disease (true positive) and specificity describes how well it               as follows: d′ = d+6.20.1 .
correctly identifies those without that disease (true negative). The            Thereafter these converted scores were logit transformed to
ROC curve plots sensitivity against 1—specificity and a cut-off             the continuous real scale (values between very large negative
                                                                            and very large positive values) as follows: d′′ = logit d′ =

(threshold value) is chosen above which cases are classified as
positive while cases with scores below that cut-off are classified
                                                                                 ′
                                                                                    d
                                                                            log 1−d   ′ . The transformation to a logit scale puts the
as negative. A test with perfect discrimination (no overlap in
the diseased and non-diseased distributions: no false positives
or false negatives) has a ROC curve that passes through the
upper left corner of the ROC graph, providing 100% sensitivity
and 100% specificity, but this is very rare. Therefore, the closer          TABLE 1 | Descriptive statistics for all three HRQL domain scores both raw (A)
the ROC curve I to the upper left corner of the graph, the                  and normalized (B), for questionnaires 1−5 completed by owners of a group of 21
                                                                            overweight cats enrolled on a weight loss programme.
higher the overall accuracy of the test (21). In the dog study
(14), the owner’s impression of change (improved or unchanged)              Domain       Questionnaire Mean SD Minimum Q1 Median Q3 Maximum
and the corresponding change in HRQL score were used to                                      No
calculate a series of sensitivity and 1—specificity value pairs,
                                                                            (A)
which then made up the points on the ROC curve. Each point
on the ROC curve was translated back to a value: a change in                Vitality—         1         2.70 0.62     1.33   2.26    2.74    3.19    3.82
                                                                            Raw
score. A point on the curve was chosen as the MID with due                  score             2         2.91 0.53     1.50   2.60    3.05    3.30    3.54
regard given to the consequences of the clinical implications of                              3         2.98 0.54     1.87   2.62    3.02    3.35    3.95
that choice.                                                                                  4         3.30 0.34     2.46   3.09    3.33    3.54    3.78
   The aim of this paper was to implement similar                                             5         3.61 0.43     2.42   3.32    3.81    3.89    3.95
methods to those employed for the dog to improve the                        Comfort–          1         5.57 0.35     4.58   5.34    5.57    5.87    6.00
interpretability of the cat tool through normalization of                   Raw
scores, creation of a health status threshold and calculation of            score             2         5.61 0.54     3.97   5.54    5.78    5.94    6.00
the MID.                                                                                      3         5.71 0.38     4.82   5.59    5.84    6.00    6.00
                                                                                              4         5.83 0.28     4.87   5.78    5.94    6.00    6.00
                                                                                              5         5.91 0.19     5.34   5.91    6.00    6.00    6.00
STUDY 1: NORMALIZATION AND                                                  EWB—              1         3.40 0.50     2.47   3.05    3.38    3.99    3.99
CREATION OF A THRESHOLD                                                     Raw
                                                                            score             2         3.44 0.46     2.30   3.18    3.39    3.87    3.99
Materials and Methods                                                                         3         3.55 0.35     2.74   3.33    3.54    3.86    3.99
Data                                                                                          4         3.61 0.31     3.02   3.37    3.69    3.78    3.99
HRQL data for 107 healthy cats and 95 sick cats                                               5         3.75 0.27     3.06   3.59    3.75    3.99    3.99
(Supplementary Material 3) were collected from University                   (B)
of Glasgow Small Animal Hospital (UGSAH), five general                      Vitality—         1        46.08 8.94 24.85 40.09 46.83 52.97            62.01
veterinary practices and one feline medicine specialist veterinary          Normalized        2        49.10 7.64 28.00 44.96 51.14 54.57            57.98
clinic, as part of previous HRQL instrument development                                       3        50.15 7.58 34.29 45.18 50.79 55.25            63.99
studies, for which ethical approval was granted by the University                             4        54.60 4.73 43.03 51.62 54.96 57.81            61.41
of Glasgow Veterinary School. In the sick group there were no                                 5        59.06 6.01 42.39 54.82 61.89 63.09            63.99
exclusion criteria and the only inclusion criterion was that the            Comfort–          1        45.65 8.29 31.49 39.38 43.24 51.51            59.55
cats were suffering from a non-acute condition deemed likely                Normalized        2        47.67 9.23 27.00 42.61 48.28 55.04            59.55
to affect their QOL by the attending veterinary surgeon. The                                  3        49.86 8.85 33.62 41.48 50.47 59.55            59.55
healthy cat group comprised cats deemed to be healthy by the                                  4        52.97 7.75 34.01 48.25 54.82 59.55            59.55
attending veterinary surgeon.                                                                 5        55.69 6.38 39.37 53.45 59.55 59.55            59.55
                                                                            EWB—              1        46.28 10.45 27.14 38.98 45.73 58.84           58.84
                                                                            Normalized        2        47.11 9.57 23.40 41.62 46.06 56.26            58.84
Normalization Process Using Healthy Cats
                                                                                              3        49.35 7.43 32.74 44.72 49.19 55.89            58.84
Using raw owner-generated data from the 107 healthy cats
                                                                                              4        50.60 6.55 38.32 45.56 52.38 54.31            58.84
(Supplementary Material 2), normalization was a two step
                                                                                              5        53.62 5.79 39.31 50.13 53.71 58.84            58.84
process as follows.

Frontiers in Veterinary Science | www.frontiersin.org                   4                                           January 2021 | Volume 7 | Article 601304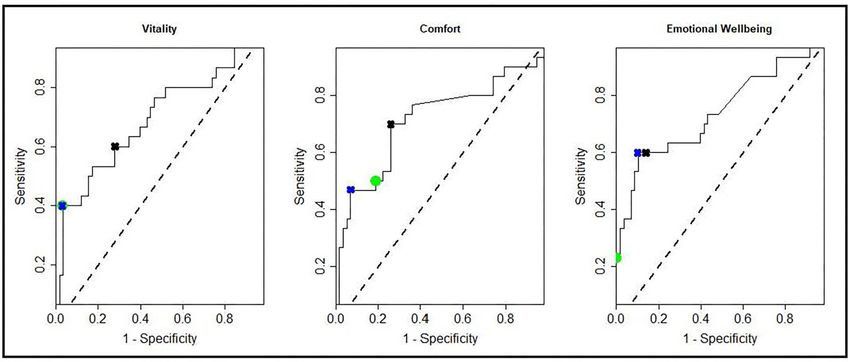
Davies et al.                                                                                                   Health-Related Quality of Life in Cats

measurement on a continuous scale, which is standard statistical          domain. In the Comfort domain the boxplot for the healthy cats
practice in the testing literature (22).                                  is non-symmetrical, with no tail on the right-hand side. This is
   Step 2: Following transformation to a continuous distribution,         clear evidence of a ceiling effect in the healthy cat group, with
T-scores were calculated for 3 HRQL domain scores based on the            a high percentage of owners (42 of 107) recording a maximum
sample means (µ), and sample SDs (σ ), of the scores as follows:          score of 6. The right panel shows the scores once normalized.
      ′′
T = d σ− µ .                                                              Now, because all scores are presented relative to the average
   The T-scores have mean 0 and standard deviation 1. Finally,            healthy dog (score of 50), the domains are directly comparable
T-scores were scaled by multiplying them by 10 and adding                 to each other.
50, thus providing easily interpretable scores, where a score of
50 represented the healthy population norm for a given HRQL               Establishing Thresholds Between Healthy and Sick
domain S = 10 × T + 50.                                                   Cats
   In combination, these steps produce scores that are                    Figure 2 shows the density plot of the theoretical distribution
comparable across all HRQL domains, with the distributions                of the healthy cat population. Marked on the plot is (A),
for each set of scores having the same mean (50) and standard             a vertical line denoting the threshold for dividing healthy
deviation (10).                                                           and sick cats, the 30th percentile (a HRQL score of 44.8).
                                                                          Above this threshold (to the right of the plot) are 70% of
Creation of a Threshold to Distinguish Healthy From                       the healthy cat population predicted to be healthy, the area
Sick Cats                                                                 marked by B. Below the threshold (to the left of the plot)
To allow the choice of a threshold which was consistent                   are 30% of the healthy population predicted to be sick, the
across all HRQL domains, with each domain having the same                 area marked by C. The right panel of Figure 1 shows the
mean and standard deviation, a density plot of the theoretical            normalized scores for healthy and sick cats with the shaded
distribution of the healthy cat population was constructed and            gray area representing the area below the 44.8 threshold
the HRQL score representing the 30th percentile identified.               score, and although the normalized scores for the sick and
Thereafter boxplots of the normalized HRQL domain scores                  healthy cats overlap, this was considered acceptable at the 44.8
(Vitality, Comfort and Emotional Well-being) for sick and                 cut-off point.
healthy cats were constructed and examined visually to establish
if the chosen threshold was effective at separating sick and              Practical Applications
healthy populations.                                                      Figure 3 and Table 1 show how the appearance of the raw and
                                                                          normalized scores differed in a group of 21 overweight cats
Examples Used to Demonstrate the Practical                                enrolled in a Feline Weight Management Programme, where
Application of Score Normalization and Threshold                          owners completed one assessment before treatment to provide
Creation                                                                  baseline data, then four assessments at approximately monthly
Examples were drawn from 3 previous studies carried out using             intervals following treatment. Formal analysis using a one-way
the HRQL scale.                                                           ANOVA showed, for raw scores, p =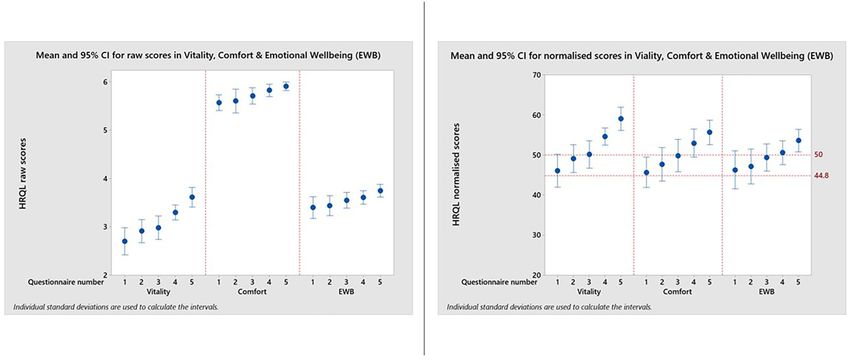
Davies et al.                                                                                                                      Health-Related Quality of Life in Cats

Formal analysis using a one-way ANOVA showed p = 0.631 for                              and controlled hypertension, recorded over a 2-month
Vitality, p = 0.010 for Comfort and p = 0.325 for EWB. Although                         period. At enrolment all three domain scores were below
only Comfort was statistically significant, the mean HRQL scores                        the healthy cat average. There was a steady decline in
show a trend which support that the HRQL scores decline with                            Emotional Well-being scores over the period, but scores
OA severity (mild > moderate > severe).                                                 for Comfort and Vitality domains were stable until week 5,
   Figure 5 illustrates the scores profile for an 18-year-                              after which they declined, Vitality showing more deterioration
old Bengal female neutered cat with OA, hyperthyroid                                    than Comfort.

  FIGURE 4 | Means and 95% confidence intervals for HRQL scores in Vitality, Comfort, Emotional Well-being for a group of 60 cats with varying severity (mild,
  moderate, severe) osteoarthritis. A score of 50 = the average healthy cat score and 70% of healthy cats will score above the 44.8 threshold.

TABLE 2 | Descriptive statistics for all three HRQL domains for mild, moderate and severely affected OA cats.

Domain              Severity                      Mean             SD              Minimum               Q1              Median              Q3              Maximum

Vitality            Mild (n = 19)                 32.35           13.68                11.86            20.89             30.14             43.01                56.10
                    Moderate (n = 32)             31.19           11.34                9.20             24.01             31.60             39.91                52.03
                    Severe (n = 9)                24.06           15.06                0.05             15.31             20.31             37.00                49.38
Comfort             Mild (n = 19)                 44.75           14.90                22.02            31.90             44.80             57.01                 70
                    Moderate (n = 32)             38.12           12.92                23.26            30.38             34.10             41.61                 70
                    Severe (n = 9)                30.89           11.43                15.71            22.76             26.10             43.61                47.56
EWB                 Mild (n = 19)                 38.72           11.83                14.00            29.50             38.80             48.71                58.80
                    Moderate (n = 32)             34.43           11.81                0.31             30.05             35.90             43.56                52.32
                    Severe (n = 9)                29.16           16.78                0.00             17.94             29.14             40.39                58.80

Frontiers in Veterinary Science | www.frontiersin.org                              6                                           January 2021 | Volume 7 | Article 601304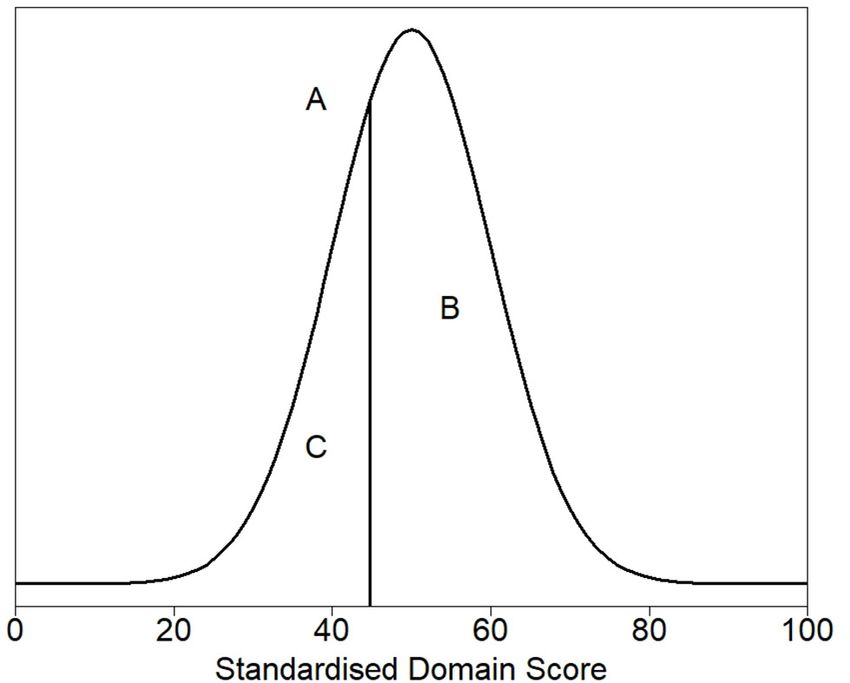
Davies et al.                                                                                                                    Health-Related Quality of Life in Cats

STUDY 2: CALCULATING THE MID FOR AN                                                  for assessments 1 and 2 for each domain was calculated, and
IMPROVEMENT IN THE NORMALIZED                                                        generally these followed a normal distribution. The mid-point
                                                                                     between the difference in normalized scores for each domain
HRQL SCORES
                                                                                     was selected and using the corresponding owner impression
Materials and Methods                                                                of change (unchanged or improved health) the sensitivity and
Data                                                                                 specificity for each possible MID (mid-point) was calculated. For
Data were obtained from previous studies as before                                   each HRQL domain, the sensitivities were then plotted against
for a mixed (healthy and unhealthy) group of 95 cats                                 the corresponding 1—specificities to create the ROC curves for
(Supplementary Material 4) with HRQL scores collected                                each HRQL domain (14).
on two or more occasions from Glasgow University Small
Animal Hospital, Liverpool University Small animal Practice,                         Selection of MIDs
five veterinary practices in the UK, one in Canada and Australia                     The methodology is reported by Davies et al. (14)
and three in the US. In addition to the 20 questions comprising                      and can be found reproduced with permission in the
the feline VetMetrica assessment, owners were asked to record                        Supplementary Material 1. Briefly, using ROC curves and
whether they believed their cat’s health had improved, stayed                        all possible calculated MIDs, several different methods to
unchanged or worsened since the previous assessment. Of                              calculate the most appropriate MID for each HRQL domain
the 95 cats, data from two cats was incomplete, owners of 29                         were considered. A ROCconsistent method as described by
cats considered health status had improved, 58 had not seen a                        Davies et al. (14), where all domains have the same MID followed
change and six considered their cat’s health had deteriorated.                       by a similar method which allowed for different MIDs in
These six cats were removed based on their small number.                             different domains (ROCdomain) was used. Finally a set of MIDs
The unchanged group of 58 cats contained cats that were both                         (VetMetrica Cat) were chosen based on their position on the
healthy and unhealthy.                                                               ROC curve.

                                                                                     Results
Calculation of Possible MIDs                                                         Table 3 shows the sensitivity, specificity and classification
Only the 1st and 2nd second assessments from each cat were                           accuracy for ROCconsistent, ROCdomain and VetMetrica Cat
used. For each cat, the difference between the normalized scores                     methods. Figure 6 shows the ROC curves constructed for

 FIGURE 5 | HRQL scores in Vitality, Comfort and Emotional Well-being for an 18 year old female neutered Bengal cat with osteoarthritis and hyperthyroidism. A score
 of 50 = the average healthy cat score and 70% of healthy cats will score above the 44.8 threshold.

Frontiers in Veterinary Science | www.frontiersin.org                            7                                           January 2021 | Volume 7 | Article 601304
Davies et al. Health-Related Quality of Life in Cats
each HRQL domain as well as the corresponding sensitivities cats who have improved in health and those that have
and 1—specificities. The ROC curves show the sensitivity and remained unchanged.
specificity trade off that must be considered when choosing
the final MIDs. After considering the clinical implications
from the different options displayed in Table 3 and Figure 6, DISCUSSION
the chosen MID values for VetMetrica Cat were 5, 7.5,
and 5, respectively for the Vitality, Comfort and EWB Previously we have described three strategies to enhance the
HRQL domains. Figure 7 shows boxplots of the change interpretability of a web-based, generic, profile HRQL measure
in normalized HRQL domains scores. For each domain, for the dog (VetMetrica) (14) and this paper describes how these,
separate boxplots are given for cats whose owners reported namely score normalization, health status threshold and MID,
an improvement in health (green) and no change in health were applied to the feline VetMetrica instrument. Norm-based
(red). On each boxplot the area below the MIDs are shaded, scoring algorithms transformed the raw scores such that, on a
with the MIDs being 5, 7.5, and 5, respectively for the 0–100 continuous scale, 50 represented the average healthy cat
Vitality, Comfort and EWB HRQL domains. In each case with a standard deviation of 10, thus scores above 50 are better
the boxplots show an acceptable demarcation between the than average and those below are worse compared to the healthy
population. In the dog HRQL scores were normalized to the
average healthy dog, according to two age groups, 0–≤7 yrs and
≥8 yrs. However, for the cat there were insufficient data to form
TABLE 3 | The sensitivities, specificities and classification accuracies of similar age groups. Whereas, the authors were concerned that
MIDconsistent, MIDdomain and VetMetrica Cat methods of MID calculation for
it was unrealistic to have a 1 year old dog in the same group as
HRQL domains Vitality, Comfort and Emotional well-being (EWB).
one that was 7 years old (14), subsequent work investigating the
Domain Method MID Sensitivity Specificity Accuracy impact of age, breed and sex on QOL has shown that the decline
in QOL with age in healthy dogs is very slow (in press). For
Vitality MIDconsistent 10.8 0.40 0.97 0.77 example the decline in the score for Energetic/Enthusiastic over
Vitality MIDdomain 10.8 0.40 0.97 0.77 a 12 month period was 0.05. Clearly it would be inappropriate to
Vitality VetMetrica Cat 5 0.60 0.72 0.68 extrapolate these findings to the cat, but in general it may not be
Comfort MIDconsistent 10.8 0.50 0.81 0.70 as important to divide subjects into different age groups as was
Comfort MIDdomain 15.5 0.47 0.93 0.77 once thought.
Comfort VetMetrica Cat 7.5 0.70 0.74 0.73 The normalization process does not take account of the ceiling
EWB MIDconsistent 10.8 0.23 1 0.74 effects which occur when scores reach the maximum as a result
EWB MIDdomain 5.4 0.60 0.90 0.80 of high numbers of healthy subjects scoring very highly. In
EWB VetMetrica Cat 5 0.60 0.86 0.77 the dog ceiling effects were seen in “Active/Comfortable” and
FIGURE 6 | ROC curves showing all possible MIDS for each of the HRQL domains; Vitality, Comfort, Emotional Well-being. Marked on the ROC curves are the
sensitivities and 1—specificities for the MIDconsistent method (green circles), MIDdomain method (blue crosses), and the MIDs used in the cat section of the
VetMetrica application (black crosses).
Frontiers in Veterinary Science | www.frontiersin.org 8 January 2021 | Volume 7 | Article 601304Davies et al. Health-Related Quality of Life in Cats
FIGURE 7 | Boxplots of the change in normalized scores in each of the three normalized HRQL domains, Vitality, Comfort and Emotional Well-being. For each domain
there are two boxplots, one for cats whose health is unchanged (red) and one where their health has improved (green).
“Happy/Content” domains which reflect physical and emotional A comparison of the raw score profile for a group of
well-being, respectively, but in the cat only occurred in the overweight cats recruited to a weight loss programme with
“Comfort” domain which reflects physical well-being. Many the normalized profile (Figure 3) demonstrates the superior
people accept that cats may appear less expressive than dogs when interpretability of normalized scores. Whereas, there is no
it comes to their emotions, and therefore the behaviors making reference point for the raw scores, the score of 50 for the average
up the EWB domain may be less overt than their equivalent in healthy cat and the threshold of 44.8 above which 70% healthy
the dog. Accordingly, this may have been a contributing factor to cats will score provide a useful reference point which also allows a
the lack of ceiling effect in the EWB domain. direct comparison between domains, which are now presented on
Several methods, both parametric and non-parametric, have the same metric. At baseline the HRQL of the overweight cats is
been proposed to deal with ceiling effects (23, 24), but due below average in all three domains, although scores are above the
to the large number of cats that achieved a maximum score 70% threshold. By questionnaire 3 (2 months into the weight loss
in the “Comfort” domain it was considered that these would programme) they have improved such that the mean of the group
not be effective at correcting the skewness of these data. is equivalent to the average healthy cat. That improvement is then
Accordingly, it was decided to follow the standard statistical sustained until the end of the trial. Furthermore, the two case
practice of transforming data to a continuous scale (22), and studies presented (Figures 4, 5) demonstrate how the normalized
then calculating norm-based scores that are comparable across scores and threshold provide the veterinary surgeon with an
all the domains (25). It is important to note that the difference immediate visual interpretation of individual or group scores
between normalized scores generates approximately normally relative to health status over time. Notably, many owners of cats
distributed data, so ceiling effects do not affect the calculation with OA don’t recognize the signs of mild disease, and yet, at that
of a MID. level, the condition has a marked impact on all domains of QOL,
Frontiers in Veterinary Science | www.frontiersin.org 9 January 2021 | Volume 7 | Article 601304Davies et al. Health-Related Quality of Life in Cats
especially Vitality and EWB (Figure 4). In the individual cat In conclusion, if a measurement instrument is not easily
(Figure 5), the physical and emotional impacts of disease follow interpreted, it is of limited use in clinical practice and research.
a different trajectory, with EWB (emotional impact) declining This work substantially improves the interpretability of the
steadily from the start of screening compared with Vitality and VetMetrica generic HRQL instrument for the cat and will
Comfort (physical impact) which remain stable before declining contribute to the body of knowledge regarding the impact of
sharply at different time points. This ability to distinguish chronic disease on the emotional and physical health of this
emotional from physical impact is one of the advantages of a enigmatic species.
profile measure compared with a single item score which only
tells us whether a patient is better or worse, but no more. On a DATA AVAILABILITY STATEMENT
day to day basis there will be natural variation in domain scores
and so it is important to distinguish clinically significant change The original contributions generated for this study are included
from “noise.” It is important to be able to advise owners of healthy in the article/Supplementary Materials, further enquiries can be
cats that some change is within normal parameters, and unlikely directed to the corresponding author.
to indicate any health change. Conversely, the clinician needs to
know when an improvement in scores represents a positive effect ETHICS STATEMENT
of treatment in the sick cat. This is the function of the MID.
It is equally important to determine if a deterioration in scores The original animal study was approved by the University of
is meaningful, but unfortunately there were insufficient data Glasgow Ethics and Welfare Committee and this retrospective
available to investigate this. Several factors may have contributed data analysis by the RCVS Ethics Review Panel. Written informed
to this. Owners may have habituated to their cat’s condition consent was obtained from the owners for the participation of
and believed them to be unchanged. Alternatively they may not their animals in this study.
have remembered their cat’s previous health status accurately
(recall bias). In any study, this bias can be more significant AUTHOR CONTRIBUTIONS
when the participant has a poor memory in general and when
the interval between events is long. Other factors that can VD, JR, and MS: conceptualization, writing, review, and editing.
influence it include age, education, socioeconomic status and JR: data curation and original manuscript. VD and MS: statistical
the importance of the outcome to the respondent. Regarding analysis. All authors contributed to the article and approved the
the latter, owners may be reluctant to admit their cat has submitted version.
deteriorated (social desirability bias) and so it may be that some
“unchanged” cats were in fact worse. The authors accept that ACKNOWLEDGMENTS
this is a significant limitation to the use of the scale which will
be addressed as more data become available. The sick cats used The authors wish to thank all the cat owners, as well as the
in this study were suffering from a variety of chronic diseases veterinary surgeons and nurses in practice and at the University
expected to impact their QOL which was appropriate for a of Glasgow Small Animal Hospital, who willingly participated in
generic scale. However, it is important to appreciate that, like the original studies from which we obtained data and Dr. Barr
validity, the MID is not an inherent property of the scale, but a Hadar, Ontario Veterinary College, University of Guelph for use
feature of the scale as it is used in a particular clinical context. of his weight loss trial data.
Accordingly, the MIDs of 5, 7.5, and 5 calculated for Vitality,
Comfort and EWB, respectively, in this study for a general
population may not apply when the scale is used in disease SUPPLEMENTARY MATERIAL
specific populations.
The Supplementary Material for this article can be found
Small sample sizes limited the scope of these studies. While
online at: https://www.frontiersin.org/articles/10.3389/fvets.
the available data were considered adequate for the normalization
2020.601304/full#supplementary-material
to the healthy cat population, it may be that experience with the
Supplementary Material 1 | Calculating the MID for improvements in the
tool will demonstrate that age should also be incorporated in the
normalised scores.
normalization process, as it was in the dog. Furthermore, the lack
Supplementary Material 2 | Profile of scores for 107 healthy cats.
of a MID for deterioration as well as improvement is a limitation
to its use. However, it is not uncommon for existing tools to Supplementary Material 3 | Profile of scores for 202 sick and healthy cats.
undergo a continual process of refinement to accommodate new Supplementary Material 4 | Profile of scores for the 1st and 2nd assessments
populations and contexts in which they are to be used (26). from 95 sick and healthy cats.
REFERENCES 2. Spofford N, Lefebvre SL, McCune S, Niel L. Should the veterinary profession
invest in developing methods to assess quality of life in healthy dogs
1. Gyatt GH, Naylor CD, Juniper E, Heyland DK, Jaeschke R, Cook and cats?. J Am Vet Med Assoc. (2013) 243:952–6. doi: 10.2460/javma.24
DJ. User’s guides to the medical literature. XII. How to use articles 3.7.952
about health-related quality of life. J Am Med Assoc. (2007) 277:1232– 3. Budke CM, Levine JM, Kerwin SC, Levine GJ, Hettlich BF, Slater MR.
7. doi: 10.1001/jama.1997.03540390062037 Evaluation of a questionnaire for obtaining owner-perceived, weighted
Frontiers in Veterinary Science | www.frontiersin.org 10 January 2021 | Volume 7 | Article 601304Davies et al. Health-Related Quality of Life in Cats
quality- of-life assessments for dogs with spinal cord injuries. J Am Vet Med 17. Liang MH, Fossel AH, Larson MG. Comparisons of five health
Assoc. (2008) 223:925–30. doi: 10.2460/javma.233.6.925 status instruments for orthopedic evaluation. Med Care. (1990)
4. Favrot C, Linek M, Mueller R, Zini E. International task force on canine 28:632–42. doi: 10.1097/00005650-199007000-00008
atopic dermatitis. Development of a questionnaire to assess the impact 18. Guyatt G, Walter S, Norman G. Measuring change over time:assessing
of atopic dermatitis on health-related quality of life of affected dogs and the usefulness of evaluative instruments. J Chron Dis. (1987) 40:171–
their owners. Vet Dermatol. (2010) 21:64–70. doi: 10.1111/j.1365-3164.2009.0 8. doi: 10.1016/0021-9681(87)90069-5
0781.x 19. Lydick E, Epstein RS. Interpretation of quality of life changes. Qual Life Res.
5. Freeman LM, Rush JE, Farabaugh AE, Must A. Development and (1993) 2:221–6. doi: 10.1007/BF00435226
evaluation of a questionnaire for assessing health-related quality of life 20. Deyo RA, Centor RM. Assessing the responsiveness of functional
in dogs with cardiac disease. J Am Vet Med Assoc. (2005) 226:1864– scales to clinical change: an analogy to diagnostic test performance.
8. doi: 10.2460/javma.2005.226.1864 J Chron Dis. (1986) 39:897–906. doi: 10.1016/0021-9681(86)9
6. Lynch S, Savary-Bataille K, Leeuw B, Argyle DJ. Development 0038-X
of a questionnaire assessing health-related quality-of-life in 21. Zweig MH, Campbell G. Receiver-operating characteristic (ROC) plots: a
dogs and cats with cancer. Vet Comp Oncol. (2011) 9:172– Fundamental evaluation tool in clinical medicine. Clin Chem. (1993) 39:561–
82. doi: 10.1111/j.1476-5829.2010.00244.x 77. doi: 10.1093/clinchem/39.4.561
7. Niessen SJM, Powney S, Guitian J, Niessen APM, Pion PD, Shaw JAM, et al. 22. Lesaffre E, Rizopoulos D, Tsonaka R. The logistic transform for Bounded
Evaluation of quality-of-life tool for dogs with diabetes mellitus. J Vet Int Med. outcome scores. Biostatistics. (2006) 8:72–85. doi: 10.1093/biostatistics/
(2012) 26:953–61. doi: 10.1111/j.1939-1676.2012.00947.x kxj034
8. Noli C, Minafò G, Galzerano M. Quality of life of dogs with skin diseases 23. Huang IC, Frangakis C, Atkinson MJ, Willke RJ, Leite WL, Vogel, et
and their owners. Part 1: development and validation of a questionnaire. Vet al. Addressing ceiling effects in health status measures: a comparison
Dermatol. (2011) 22:335–43. doi: 10.1111/j.1365-3164.2010.00954.x of techniques applied to measures for people with HIV disease.
9. Reid J, Wiseman-Orr ML, Scott EM, Nolan AM. Development, validation and Health Serv Res. (2008) 43:327–39. doi: 10.1111/j.1475-6773.2007.
reliability of a web-based questionnaire to measure health-related quality of 00745.x
life in dogs. J Small Anim Pract. (2013) 54:227–33. doi: 10.1111/jsap.12059 24. French B, Sycamore NJ, McGlashan HL, Blanchard CC, Holmes NP.
10. Reid J, Wiseman-Orr L, Scott M. Shortening of an existing generic online Ceiling effects in the Movement Assessment Battery for Children-
health-related quality of life instrument for dogs. J Small Anim Pract. (2018) 2 (MABC-2) suggest that non-parametric scoring methods are
59:334–42. doi: 10.1111/jsap.12772 required. PLoS ONE. (2018) 13:e0198426. doi: 10.1371/journal.pone.01
11. Noble CE, Wiseman-Orr LM, Scott ME, Nolan AM, Reid J. Development, 98426
initial validation and reliability testing of a web-based, generic feline 25. Ware J, Kosinski M, Bjorner J, Turner-Bowker D, Gandek B, Maruish M.
health-related quality-of-life instrument. J Feline Med Surg. (2019) 21:84– User’s Manual for the SF-36v2 R Health Survey. Lincoln (RI): QualityMetric
94. doi: 10.1177/1098612X18758176 Incorporated (2007).
12. Schünemann HJ, Akl EA, Guyatt GH. Interpreting the results of patient 26. Streiner DL, Norman GR, Cairney J. Health measurement scales: a
reported outcome measures in clinical trials: the clinician’s perspective. Health practical guide to their development and use. USA: Oxford University Press
Qual Life Outcomes. (2006) 4:62. doi: 10.1186/1477-7525-4-62 (2015). doi: 10.1093/med/9780199685219.003.0001
13. Lam CL, Lauder IJ, Lam TP, Gandek B. Population Based Norming
of the Chinese (HK) Version of the SF-36 Health Survey. Hong Kong Conflict of Interest: JR was employed by the company NewMetrica Ltd.
Practitioner (1999).
14. Davies V, Reid J, Wiseman-Orr ML, Scott EM. Optimising outputs from a The remaining authors declare that the research was conducted in the absence of
validated online instrument to measure health-related quality of life (HRQL) any commercial or financial relationships that could be construed as a potential
in dogs. PLoS ONE. (2019) 14:e0221869. doi: 10.1371/journal.pone.0221869 conflict of interest.
15. Schünemann HJ, Puhan M, Goldstein R, Jaeschke R, Guyatt GH.
Measurement properties and interpretability of the chronic respiratory Copyright © 2021 Davies, Reid and Scott. This is an open-access article distributed
disease questionnaire (CRQ). J Chron Obstructive Pulm Dis. (2005) 2:81– under the terms of the Creative Commons Attribution License (CC BY). The use,
9. doi: 10.1081/COPD-200050651 distribution or reproduction in other forums is permitted, provided the original
16. Kazis LE, Anderson JJ, Meenan RF. Effect sizes for interpreting author(s) and the copyright owner(s) are credited and that the original publication
changes in health status. Med Care. (1989) 27:S178– in this journal is cited, in accordance with accepted academic practice. No use,
89. doi: 10.1097/00005650-198903001-00015 distribution or reproduction is permitted which does not comply with these terms.
Frontiers in Veterinary Science | www.frontiersin.org 11 January 2021 | Volume 7 | Article 601304You can also read