Our People & Practices - IFC's commitment to alleviating poverty and creating opportunities for the developing world's most vulnerable people is ...
←
→
Page content transcription
If your browser does not render page correctly, please read the page content below
Our
People &
Practices
IFC’s commitment to alleviating
poverty and creating opportunities
for the developing world’s most
vulnerable people is reflected in
our corporate culture.
Understanding our
IFC Annual Report 2017
Development Impact
Measuring the results of our work is critical
to understanding how well our strategy is
working — and whether IFC and our clients
are reaching people and markets that most
need our help.
IFC has been at the forefront of results
measurement among multilateral
development banks and development
finance institutions for private
sector operations. We are one of the
few international financial institutions
that set corporate targets — not only for
investment volume but also for direct
development impact.
IFC’S RESULTS-M EASUREMENT SYSTEM
IFC constantly refines and upgrades our results-
measurement framework to support our strategy
76 – 77
and better articulate the impact of our work.
We continue to develop new tools to assess the full
range of our impact — g oing far beyond the direct
impact of our projects.
IFC’s results-measurement system features three
mutually reinforcing components:
••The IFC Development Goals (IDGs), which provide
orporate-level targets to reflect IFC’s strategy and
c
areas of greatest development need.
••A monitoring system tracking project performance
and development impact of IFC interventions.
••Sector, program, and c ountry-level results
measurements.
IFC’s strategy firmly places development impact at
the heart of what we do. We are now introducing
a new framework that will enable us to design
and select projects with the greatest potential for
development impact. The new Anticipated Impact
Measurement and Monitoring (AIMM) framework, is
designed to assess the anticipated — or “ex ante” —
impact of our work at two levels: what the specific
project is expected to achieve and how it is expected
to contribute to the creation or development of
markets. At the project level, the AIMM framework
Creating Markets
will help IFC staff articulate — s ystematically and
comprehensively — h ow projects promote develop-
ment. The AIMM approach will be integrated with
IFC’s existing results-measurement framework and
monitoring system. It will help IFC apply a stronger
portfolio approach to our interventions.THE IFC DEVELOPMENT GOALS: SUPPORTING With each investment and advisory commitment we
THE IFC STRATEGY make, we work with our clients to estimate specific
development impacts we will achieve over time. At
The IFC Development Goals identify what we expect the start of the current three-year cycle (FY17–19),
our development work to accomplish over cycles substantial gains were made towards the IDGs in FY17.
of three years. They help us communicate with our We exceeded the target for increasing or improving
shareholders and the public about how IFC’s work infrastructure services, mostly because of a broad-
is expected to contribute to the World Bank Group’s band investment project in Mexico that is expected to
goals of ending poverty and boosting shared pros- benefit 9 million people by 2021.
perity. The IDGs set targets for five areas that have a
direct impact on people’s lives and are aligned with
our strategy:
••Increase or improve sustainable farming
opportunities
••Improve health and education services
••Increase access to financial services for microfinance
and SME clients
••Increase or improve infrastructure services
••Reduce greenhouse emissions
IFC Development Goals
PERCENT OF
FY17–19 FY17 FY17 FY17 TARGET
GOAL TARGETS TARGETS COMMITMENTS ACHIEVED
Increase or improve Benefit Benefit 0.72 million 68%
sustainable farming 3.32 million 1.05 million people
opportunities people people
Improve health and Benefit Benefit 8.60 million 101%
education services 26.14 million 8.54 million people
people people
Increase access to financial Benefit Benefit 28.99 million 94%
services for microfinance 98.28 million 30.89 million clients
clients clients clients
Increase access to financial Benefit Benefit 0.61 million 69%
services for SME clients 2.87 million 0.88 million clients
clients clients
Increase or improve Benefit Benefit 33.01 million 138%
infrastructure services 68.08 million 23.86 million people
people people
Reduce greenhouse- Reduce by Reduce by 6.68 million 97%
gas emissions 21.79 million 6.91 million metric tons
metric tons metric tons
of CO2 equivalent of CO2 equivalent
per year per yearTHE MONITORING SYSTEM: TRACKING THE The review also identified key lessons:
IFC Annual Report 2017
PERFORMANCE AND DIRECT RESULTS OF
IFC OPERATIONS ••It is wise to work with local partners, investors, or
donors who have a stake in the project.
The Development Outcome Tracking System (DOTS) ••It is best to start with small projects that can
provides a framework to monitor the performance demonstrate to local entrepreneurs the potential of
and track the direct development outcomes of IFC’s new approaches to business.
client companies. DOTS ratings, in the case of invest- ••It is essential to factor in the time it takes to build
ment operations, is a synthesis of four performance the necessary capacity to ensure the success of
areas: financial, economic, environmental and social, projects. In addition, the specific local context of
and broader private sector development impacts. conflict should be factored into project design and
implementation.
The FY17 DOTS rating scores are based on a cohort
of 828 investments approved between 2008 and 2013 IFC works closely with the World Bank and the
that were mature enough to be rated. DOTS also tracks Multilateral Investment Guarantee Agency to
indicators such as the number of people reached by develop common results frameworks for the World
IFC’s investment clients, or the dollar benefit to partic- Bank Group’s country engagements. In FY17, IFC
ular stakeholders during the reporting year. contributed to the design of results frameworks
for 14 country-partnership frameworks, or country
Results measurement of advisory services has strategies, as well as provided input for 15 perfor-
been integrated into the project’s life cycle — from mance and learning reviews.
conception to completion. The overall DOTS score
for advisory services, also known as the develop- In addition, IFC worked on reporting on results for
ment effectiveness rating, is a synthesis assessment 18 World Bank and IFC joint implementation plans
of the project’s strategic relevance, effectiveness, for key areas such as cities, power, agribusiness,
and efficiency performances, and is rated at project and health.
completion. In FY17, the advisory DOTS score
represented the performance of 88 completed ALIGNING IFC’S RESULTS MEASUREMENT TO
advisory projects. THE SUSTAINABLE DEVELOPMENT GOALS
EVALUATING DEVELOPMENT IMPACT AT THE Since the approval of the United Nations’ Sustainable
PROGRAM, SECTORAL, AND COUNTRY LEVEL Development Goals (SDGs) in September 2015, IFC
78 – 79
has mapped how our strategies and operations are
IFC has been conducting evaluations to understand aligned with these goals. In parallel, IFC has also
the impact of IFC investments on the World Bank taken the lead among international finance institu-
Group’s twin goals. These evaluations also estimate tions in reporting how we and our clients contribute to
IFC’s contribution to job creation. achieving the SDGs.
In FY17, IFC adopted a more strategic approach to MAINTAINING THOUGHT LEADERSHIP IN
evaluations — designed to fill critical knowledge gaps. PRIVATE SECTOR DEVELOPMENT RESULTS
We undertook six e conomic-impact assessments MEASUREMENT
at the sectoral level and four large impact-evaluation
programs. These efforts provide evidence of IFC In March 2017, IFC held the first annual Evaluating
impact beyond the individual projects at the sector Private Sector Development Impact Conference, which
level. They also generate useful lessons that inform featured 24 donor partners, multilateral development
industry strategies. banks, and international finance institutions. The
conference highlighted the importance of evaluations,
For example, in Jamaica, we conducted an economic- specifically in the areas of economic growth and
impact assessment of IFC investments related to jobs. It also underlined the need to refine and share
the expansion of an airport. Our assessment showed methodologies, and work together to find innovative
that by enabling an increased capacity, IFC invest- ways to evaluate development impact.
ments helped contribute about $288 million to the
economy and supported about 29,000 jobs — d irectly MONITORING DEVELOPMENT OUTCOMES
and indirectly.
In FY17, 55 percent of our investments were positively
To inform our work in fragile and c
onflict-affected rated — d own three percentage points from FY16.
countries, we also conducted a systematic review of The decline largely reflected slower economic growth,
56 published evaluations of private sector develop- depressed commodity prices, market volatility, and
ment projects carried out between 2005 and 2014 in political turmoil in many countries. At the same time,
23 such countries. Our findings showed that invest- IFC has increasingly ventured into some of the world’s
Creating Markets
ments supporting large infrastructure projects or the most challenging areas, where financial and other
development of small and medium enterprises tend risks tend to be higher.
to yield the strongest development results.Larger IFC investments tended to perform better. ••We supported our partners in digital financial
When weighted for investment volume, 69 percent of services to facilitate 572 million non-cash retail
our investments were rated positively. transactions, totaling over $3.7 billion.
••We helped strengthen country financial markets by
Among industry groups, investments in health and working with collateral registries and credit bureaus
education, and in funds performed the best — that facilitated more than $250.6 billion in financing.
with 60 percent of investments rated positively. More than 679,900 micro, small and medium enter-
Investments in the manufacturing sector registered prises were able to receive loans secured with
the biggest performance increase — showing movable property. In addition, we helped create or
a 54 percent DOTS score, up seven points from enhance eight credit-bureau operators.
FY16. The improvement was driven principally
by investments in the industrial and commercial Providing Solutions and Services:
products sector.
••Nearly 20 million people have benefited from
DOTS scores of investments in most other industry using Lighting Global quality-verified solar lighting
sectors declined. The lowest ratings were for invest- products, mostly in Sub-Saharan Africa and in
ments in the tourism, retail, construction, and IDA countries.
real-estate sectors and in the telecommunications, ••Our clients generated and distributed power to
media, and technology sectors. Many of these 104.2 million people, many of them in Sub-Saharan
projects were primarily early-stage investments that Africa and South Asia. They provided phone connec-
experienced delays in planned expansion. tions to 345 million people, mostly in South Asia.
They distributed gas to 60 million people, mostly in
DOTS scores declined in all regions except Europe East Asia and the Pacific.
and Central Asia, where the score rose five points to ••Our clients helped educate 4.9 million students.
56 percent. The performance of investments in Latin Our agribusiness clients supported 3 million farmers
America and the Caribbean declined nine points through improved access to finance and markets
to 54 percent, largely because of the unsatisfactory and through sustainable farming practices. These
performance of investments in financial markets, benefits are expected to improve farmers’ produc-
funds, and infrastructure. Investments in Sub-Saharan tivity and income and enhance their ability to cope
Africa and in the Middle East and North Africa with unexpected events.
regions were partly affected by the political instability ••We worked with firms to adopt new p ractices and
and the fragile status of many countries in which technologies that attracted financing of $1.7 billion,
IFC operated. including $1.4 billion through corporate-governance-
reform projects and $300 million through projects
Among advisory projects, 70 percent of projects that involving resource-efficient technologies.
closed during the year and could be assessed for ••IFC helped governments sign six contracts with
development effectiveness were rated positively — private operators. These transactions are expected
above our target of 65 percent. South Asia was the to create or improve access to infrastructure and
strongest performer, with 92 percent of projects rated health services for 1.5 million people and facilitate
positively on development effectiveness. Projects in $341 million in private investment in infrastructure.
East Asia and the Pacific demonstrated the largest
improvement from the last year — a gain of 28 points. Improving the Business Environment:
Projects in the Middle East and North Africa expe-
rienced a performance decline, partly reflecting the ••In collaboration with the World Bank, IFC supported
challenges of implementing projects in fragile and 50 national and local governments to implement
conflict-affected areas. 116 reforms that helped improve the regulatory and
policy environment for private sector development
CLIENTS’ DEVELOPMENT REACH AND RESULTS and foster competitive markets and job creation.
Ninety-six reforms were in IDA countries, including 26
Across the globe, IFC investment and advisory clients in fragile and c
onflict-affected areas.
were able to reach many people and record some ••These reforms led to $22 million in private sector
remarkable achievements (see page 81). Here are a savings and contributed to an estimated $168 million
few highlights: in new investments.
Improving Access to Finance:
••IFC provides investment and advice to financial
institutions that serve individuals and micro, small,
and medium enterprises. These institutions provided
about 53.7 million micro and 8.3 million small
and medium loans totaling $412 billion. They also
provided 1 million housing finance loans totaling
$29 billion.Development reach by IFC’s clients
IFC Annual Report 2017
PORTFOLIO PORTFOLIO
Jobs CY15 CY16
Employment (millions of jobs)1 2.4 2.4
Microfinance loans2
Number (million) 51.2 53.7
Amount ($ billions) 59.5 60.7
SME loans2
Number (million) 7.6 8.3
Amount ($ billions) 343.7 351.1
Trade finance3
Number (million) 1.8 1.8
Amount ($ billions) 255 270
People reached with services
Power generation (millions of people) 48.0 79.4
Power distribution (millions of people) 50.1 24.8
Water distribution (millions of people) 21.8 14.3
Gas distribution (millions of people) 4
51.2 59.9
Phone connections (millions of people) 262.8 345.3
Patients served (millions)5 31.7 34.0
Students reached (millions) 4.6 4.9
Farmers reached (millions) 3.5 3.0
Payments to suppliers and governments
80 – 81
Domestic purchases of goods and services ($ billions)6 46.8 36.6
Contribution to government revenues or savings ($ billions) 16.6 14.6
These figures represent the total reach of IFC clients as of the end of CY15 and CY16. CY15 and CY16 portfolio data are not strictly
comparable because they are based on a changed portfolio of IFC clients. For microfinance and SME loans, results also reflect
contributions from Advisory Services. While numerous controls are performed on the data provided by clients, they are sometimes based
on estimates, and the understanding of the indicator definitions may vary slightly between clients.
1. Portfolio figures for employment include jobs provided by Funds.
2. Portfolio reach figures represent the micro, small, and medium outstanding loan portfolio of IFC clients as of end CY15 and CY16, for
MSME-oriented financial institutions/projects. CY16 includes the data from 304 MSME clients, including nine clients for which the data
were extrapolated.
3. The total number and dollar volume of trade transactions financed by the Global Trade Finance Program’s network of e merging-market
banks are based on actual data from 68% (number) and 72% (dollar volume) of the network’s active banks in CY16. The figures are
not directly comparable to last year’s due to variance in the number of active banks who submitted survey responses. Numbers reflect
transactions directly guaranteed by IFC as well as those executed by network banks that have been supported by the program. CY15
data has been updated to reflect prior-year data corrections from survey participants.
4. One client in East Asia and the Pacific accounted for 56.6 million people reached through gas distribution in CY16.
5. CY15 total patients served revised due to the restatement of one client value in South Asia.
6.CY15 total domestic purchases of goods and services revised due to the restatement of one client in Sub-Saharan Africa.
Creating MarketsInvestment services DOTS Investment services DOTS
score by performance area, score by region, FY16 vs. FY17
FY16 vs. FY17 % Rated Positively
% Rated Positively IFC Total
55%
Development Outcome
58%
55%
Middle East and North Africa
58%
51%
Financial Performance
57%
39%
Sub-Saharan Africa
43%
53%
Economic Performance
59%
49%
South Asia
51%
54%
Environmental & Social Performance
57%
69%
Latin America and the Caribbean
67%
54%
Private Sector Development Impact
63%
67%
Europe and Central Asia
70%
56%
FY17 FY16 51%
East Asia and the Pacific
59%
Investment services DOTS 62%
FY17 FY16
score by industry, FY16 vs. FY17
% Rated Positively
IFC Total
55%
58%
Tourism, Retail, Property
34%
41%
Telecoms & IT
37%
42%
Oil, Gas & Mining
48%
43%
Infrastructure
54%
57%
Manufacturing
54%
47%
Financial Markets
58%
62%
Agribusiness & Forestry
59%
58%
Funds
60%
75%
Health, Education, Life Sciences
60%
67%
FY17 FY16Advisory services DOTS Advisory services DOTS score
IFC Annual Report 2017
score by performance area, by region, FY16 vs. FY17
FY16 vs. FY17 % Rated Positively
% Rated Positively IFC Total
70%
Development Effectiveness
68%
70%
South Asia
68%
92%
Strategic Relevance
76%
91%
Latin America and the Caribbean
88%
75%
Output Achievement
71%
92%
Sub-Saharan Africa
91%
74%
Outcome Achievement
61%
66%
Europe and Central Asia
67%
70%
Impact Achievement
80%
60%
East Asia and the Pacific
55%
57%
Efficiency
29%
73%
Middle East and North Africa
70%
50%
FY17 FY16 80%
FY17 FY16
Advisory services DOTS score
82 – 83
by business area, FY16 vs. FY17*
% Rated Positively
IFC Total
70%
68%
Financial Sector**
77%
87%
Investment Climate
71%
79%
Cross-Industry Advisory Services
70%
75%
Public-Private Partnerships
69%
41%
Agribusiness
67%
50%
Energy & Resource Efficiency
43%
40%
FY17 FY16
Creating Markets
* In FY17, IFC reporting on development-effectiveness ratings
switched from calendar year to fiscal year. The FY16
development-effectiveness ratings presented in the 2016
annual report are therefore not comparable to the FY16
development-effectiveness rating shown here.
** “ Financial Sector” also includes projects undertaken by the
integrated World Bank Group team in the Finance & Markets
Global Practice.Our Staff
IFC’s employees are diverse. They are our
most important asset. Representing more
than 140 countries, they bring innovative
solutions and global best practices to our
clients. Fifty-six percent of our staff are
stationed in 98 field locations, reflecting
our commitment to decentralization.
Where we work
STAFF AT ALL GRADE LEVELS
United States 1,703 (44%)
Other Countries 2,157 (56%)
Total IFC Staff 3,860
National origin
STAFF AT OFFICER LEVEL AND HIGHER MANAGERIAL CADRE
Part 1 Countries1 1,155 (44%) 130 (61%)
Part 2 Countries 2
1,477 (56%) 82 (39%)
Total 2,632 212
Gender
STAFF AT OFFICER LEVEL AND HIGHER MANAGERIAL CADRE
Female 1,194 (45%) 75 (35%)
Male 1,438 (55%) 137 (65%)
Total 2,632 212
1. Staff with primary nationality from countries that declared themselves as IDA donors at the time of joining the World Bank Group.
2. Staff of all other nationalities.COMPENSATION BENEFITS PROGRAMS
IFC Annual Report 2017
IFC applies the World Bank Group’s compensation IFC provides a competitive package of benefits,
framework. Competitive compensation is essential to including a retirement plan, medical, life, accidental
attract and retain highly qualified, diverse staff. The death, workers’ compensation, and disability insur-
salary structure for staff recruited in Washington, D.C., ance. Medical insurance costs are shared — 7 5 percent
is based on the U.S. market. Salaries for staff hired paid by IFC and 25 percent by the insured.
outside the United States are based upon local
competitiveness, determined by independent local IFC’s pension is part of the World Bank Group plan,
market surveys. Given the World Bank Group’s status and includes two components: first, a defined-benefit
as a multilateral organization, staff salaries are deter- component fully funded by IFC based on years of
mined on a net-of-tax basis. service, salary, and retirement age; second, a cash-
balance component — a mandatory contribution of
VARIABLE PAY PROGRAMS 5 percent of salary plus an optional staff contribution
of up to 6 percent of salary, to which IFC adds
IFC’s variable pay programs consist of several compo- 10 percent annually. IFC also sponsors an optional
nents, including recognition programs and performance U.S.-style 401(k) plan for Washington-based staff and
awards that support IFC’s high-performance culture. an optional savings plan for country-office staff.
These awards are designed to encourage teamwork,
reward top performance, and support IFC’s strategic
priorities, such as projects in fragile and conflict-
affected states. Variable pay is available to all staff at
the grades GA through GI. There is no variable pay for
senior executives at the GJ and GK levels.
Staff salary structure (Washington, D.C.)
As of June 30, 2017, the salary structure (net of tax) and annual average net salaries/benefits for World Bank
Group staff were as follows:
84 – 85
STAFF AT AVERAGE
MARKET GRADE SALARY/ AVERAGE
REPRESENTATIVE MINIMUM REFERENCE MAXIMUM LEVEL GRADE BENEFIT a
GRADE JOB TITLE (US$) (US$) (US$) (%) (US$) (US$)
GA Office Assistant 26,300 37,600 48,900 0.03 38,000 21,078
GB Team Assistant,
Information Technician 32,200 46,000 59,800 0.31 45,738 25,370
GC Program Assistant,
Information Assistant 39,300 56,100 72,900 8.03 58,206 32,286
GD Senior Program Assistant,
Information Specialist,
Budget Assistant 46,500 66,400 86,300 7.06 71,825 39,840
GE Analyst 63,000 90,000 117,000 12.19 82,566 45,798
GF Professional 83,200 118,900 154,600 23.19 108,117 59,971
GG Senior Professional 110,700 158,200 205,700 30.59 149,923 83,160
GH Manager,
Lead Professional 151,200 216,000 280,800 15.89 212,482 117,860
GI Director, Senior Advisor 229,900 287,400 344,900 2.17 281,686 156,246
GJ Vice President 276,900 325,800 374,700 0.42 349,688 193,965
Creating Markets
GK Managing Director,
Executive Vice President 307,900 362,200 416,500 0.10 396,574 286,607
Note: Because World Bank Group staff, other than U.S. citizens, usually are not required to pay income taxes on their World Bank Group
compensation, the salaries are set on a net-of-tax basis. These salaries are generally equivalent to the after-tax take-home pay of the
employees of the comparator organizations and firms from which World Bank Group salaries are derived. Only a relatively small minority
of staff will reach the upper third of the salary range.
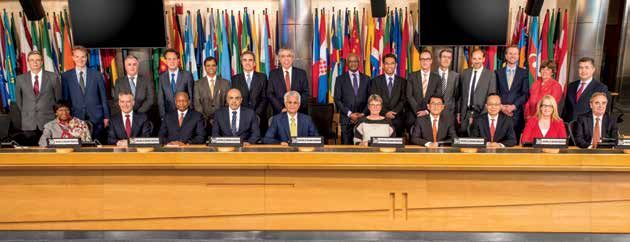
a. Includes medical, life and disability insurance; accrued termination benefits; and other non-salary benefits. Excludes tax allowances.Our Governance OUR PLACE IN THE WORLD BANK GROUP The World Bank Group is a vital source of financial and technical assistance to developing countries. Its mission is to fight poverty with passion and professionalism, for lasting results. IFC is one of five members of the Bank Group, though it is a separate legal entity with separate Articles of Agreement, share capital, financial structure, manage- ment, and staff. Membership in IFC is open only to member countries of the World Bank. As of June 30, 2017, IFC’s paid-in capital of about $2.56 billion was held by 184 member countries. These countries guide IFC’s programs and activities. IFC works with the private sector to create oppor- tunity where it’s needed most. Since our founding in 1956, we have committed more than $215 billion of our own funds for private sector investments in developing countries, and we have mobilized nearly $50 billion more from others. In working to end extreme poverty and boost shared prosperity, we collaborate closely with other members of the Bank Group. OUR BOARD Each of our member countries appoints one governor and one alternate. Corporate powers are vested in the Board of Governors, which delegates most powers to a Board of 25 directors. Voting power on issues brought before them is weighted according to the share capital each director represents. The directors meet regularly at World Bank Group headquarters in Washington, D.C., where they review and decide on investments and provide overall stra- tegic guidance to IFC management. The President of the World Bank Group is also President of IFC.
IFC Annual Report 2017
Standing (left to right): Andrei Lushin, Russian Federation; Hervé de Villeroché, France; Omar Bougara, Algeria; Frank Heemskerk,
The Netherlands; Subhash Chandra Garg, India; Daniel Pierini, Argentina (Alternate); Otaviano Canuto, Brazil; Jean-Claude
Tchatchouang, Cameroon (Alternate); Andin Hadiyanto, Indonesia; Werner Gruber, Switzerland; Fernando Jimenez Latorre, Spain;
Juergen Zattler, Germany; David Kinder, United Kingdom (Alternate); Christine Hogan, Canada; Patrizio Pagano, Italy.
Seated (left to right): Bongi Kunene, South Africa; Jason Allford, Australia; Andrew N. Bvumbe, Zimbabwe; Khalid Alkhudairy, Saudi
Arabia; Merza Hasan, Kuwait (Dean); Susan Ulbaek, Denmark; Kazuhiko Koguchi, Japan; Yingming Yang, China; Karen Mathiasen,
United States; Franciscus Godts, Belgium.
OUR MEMBER COUNTRIES — S
TRONG
EXECUTIVE COMPENSATION SHAREHOLDER SUPPORT
The salary of the President of the World Bank Group GRAND TOTAL 100%
is determined by the Board of Directors. The salary United States 22.19
structure for IFC’s CEO is determined by positioning a
86 – 87
Japan 6.33
midpoint between the salary structure of staff at the
highest level, as determined annually by independent Germany 5.02
U.S. compensation market surveys, and the salary of France 4.72
the World Bank Group President. The compensation United Kingdom 4.72
of our executive leadership is transparent.
India 4.01
IFC’s CEO, Philippe Le Houérou, receives an annual Russian Federation 4.01
salary of $411,000, net of taxes. Canada 3.17
Italy 3.17
China 2.41
174 OTHER COUNTRIES 40.25
Creating MarketsAccountability
INDEPENDENT EVALUATION GROUP
The Independent Evaluation Group (IEG) is an inde-
pendent unit that reports directly to IFC’s Board of
Directors. IEG’s mission is to strengthen the develop-
ment effectiveness of World Bank Group institutions
through evaluations that inform strategies and
future work.
IEG assesses the results of IFC operations and offers
recommendations for improvement. Through its
recommendations, IEG also contributes to internal
learning and improvements by informing new direc-
tions, policies and procedures, and country and sector
strategies for IFC work.
IEG’s most recent annual review of World Bank
Group results and performance assesses develop
ment outcome trends for IFC at a corporate level,
and by region and industry sector. This and other
major reports are available on IEG’s website,
http://ieg.worldbankgroup.org.
OFFICE OF THE COMPLIANCE ADVISOR
OMBUDSMAN
Affected communities have unrestricted access to
the Compliance Advisor Ombudsman (CAO), the
independent accountability mechanism for IFC. CAO
is mandated to address complaints from people
affected by IFC-supported business activities in a
manner that is fair, objective, and constructive—with
the goal of improving environmental and social project
outcomes and fostering greater public accountability
of IFC.
Independent of IFC and MIGA management and
reporting directly to the President of the World
Bank Group, CAO works to resolve complaints using
a flexible, p
roblem-solving approach through its
dispute-resolution arm and oversees investigations of
IFC’s environmental and social performance through
its compliance arm. CAO’s advisory arm provides
independent advice on broader environmental and
social concerns with the goal of systemic improve-
ments in IFC performance.
During FY17, CAO addressed 51 cases related to IFC
projects in 28 countries. More information about
how IFC is engaging with CAO’s work is available at
www.cao-ombudsman.org.Partnerships Australia
IFC Annual Report 2017
Australia committed $63 million — a record high — t o
IFC’s advisory programs in Asia. A longtime supporter
IFC develops innovative and multifaceted of IFC’s activities in the Pacific, Australia is an increas-
partnerships that allow us to scale up our ingly important partner in South Asia through its
support of the Sustainable Development Investment
work in priority areas and focus on markets Portfolio, which aims to address issues of water, food,
with the greatest development needs. Our and energy security. Focusing on gender, Australia
contributed $11 million to a program in Sri Lanka to
partners provide instrumental support — increase the share and retention of women employees
by making financial contributions, providing in participating companies.
co-financing, and creating solutions BHP Billiton Foundation
alongside us. Together, we share our global
IFC and the World Bank signed an agreement with
knowledge and experience by convening BHP Billiton Foundation for the first time, committing
the development community and the nearly $2.6 million to enhance information disclosure
private sector. and improve development outcomes in the extractives
sector. The World Bank Group has identified gover-
nance in this sector as a key development issue.
WORKING WITH DEVELOPMENT PARTNERS The new partnership will work to improve transpar-
ency, analysis, and dialogue to deliver benefits for
IFC collaborates with more than 30 governments, broader communities.
20 foundations and corporations, and a variety
of multilateral and institutional partners. In FY17, Denmark
our development partners committed more than
$268 million to support IFC’s work, demonstrating Denmark pledged its largest commitment to date,
their strong belief in the importance of the private providing $9 million for a global partnership to
sector in development. scale up new technological solutions and potentially
game-changing business models to address climate
IFC and the World Bank held joint consultations change. Through this partnership, IFC aims to support
with a variety of partners to deepen our engage-
88 – 89
first-of-their-kind projects — w
ith a focus on energy,
ment. Our cornerstone event was the Development manufacturing, agriculture, and small and medium
Finance Forum, which was held this year in Accra, enterprises. At least half the projects supported by the
alongside pre-events in Freetown and Abidjan. partnership will be in IDA countries and in fragile and
These events showcased IFC’s thought leadership conflict-affected areas.
on unlocking private sector investment to achieve
strong development. Japan
We work closely with our partners to stimulate Japan committed $15 million for the new Partnership
investment in the most challenging markets. In FY17, for Quality Infrastructure — a global initiative that
we spearheaded several substantial engagements— will provide vital support for infrastructure activities,
including the Transforming Investment Risk conference, including for public-private-partnership transactions.
a first-of-its-kind event organized jointly by the World With Japan’s support, IFC will promote specific objec-
Bank Group and the U.K. Department for International tives in infrastructure—including improving economic
Development. The event focused on unlocking efficiency, reducing lifecycle costs, strengthening safety
investment opportunities in high-potential markets — and resilience, addressing social and environmental
particularly in Africa — by bringing together U.K. impacts, and ensuring local economic development
business leaders and development specialists. and knowledge transfer.
Through trust funds, IFC and our partners continued Switzerland
to provide financing and knowledge for private sector
development. In FY17 the following initiatives high- Switzerland committed $45 million to the Multi-
lighted the concerted efforts of IFC and our partners Country Investment Climate Program to enhance
to collaborate in innovative ways: trade and competitiveness and improve investment
climate reforms in 20 priority countries over the next
eight years. Switzerland also committed an addi-
tional $11 million to the EDGE Green Building Market
Transformation program, focusing on projects in Latin
Creating Markets
America and the Caribbean, Sub-Saharan Africa, and
East Asia and the Pacific.Development partner commitments FINANCIAL COMMITMENTS TO IFC ADVISORY SERVICES (US$ MILLION EQUIVALENT) Summary FY16 FY 17 Governments 201.69 256.76 Institutional/Multilateral Partners 12.25 8.32 Corporations, Foundations, and NGOs 5.19 3.07 Total 219.13 268.15 Governments FY16 FY17 Australia 7.74 62.92 Austria 11.06 6.47 Canada 36.99 0.00 Denmark 2.86 9.17 France 0.00 2.12 Germany 0.22 2.62 Ireland 1.01 0.96 Israel 1.00 0.00 Italy 15.00 5.09 Japan 4.78 21.17 Luxembourg 3.90 3.98 The Netherlands 11.00 11.00 New Zealand 3.56 4.82 Norway 5.68 0.94 Slovak Republic 1.09 0.00 Sweden 5.66 0.00 Switzerland 45.28 68.68 United Kingdom 38.17 38.74 United States 6.69 18.08 Total 201.69 256.76 Institutional/Multilateral Partners FY16 FY17 Climate Investment Funds 1.39 4.70 European Commission 10.61 3.08 MENA Transition Fund 0.00 0.54 SG Hambros Trust Co. Ltd. (for and on behalf of the PIDG Trust) 0.25 0.00 Total 12.25 8.32 Corporations, Foundations, and NGOs FY16 FY17 Bill & Melinda Gates Foundation 2.30 0.00 BHP Billiton Foundation 0.00 2.57 Dow Chemical Company* 0.50 0.00 Grundfos Holding A/S* 1.00 0.00 Marie Stopes International 0.89 0.00 The William and Flora Hewlett Foundation 0.50 0.50 Total 5.19 3.07 *Contributor to the 2030 Water Resource Group.
Portfolio Management Our equity portfolio has grown significantly over
IFC Annual Report 2017
the last few years. To rebalance our asset allocation,
we are implementing a new approach that calls for
At the core of IFC’s approach to portfolio manage- more moderate growth and greater selectivity for our
ment is the aim to build and manage a portfolio that equity investments. This rebalancing is the result of
produces strong financial and development perfor- an analysis that takes into account market conditions,
mance. We achieve this through our strong presence opportunities, expected returns, and risks — and will
on the ground —a network of offices in 101 cities—that be adjusted periodically as required. This new approach
enables us to stay close to our clients and markets, further acknowledges the greater resource needs for
and anticipate and monitor trends. As a result, we are equity relative to debt, and, therefore, we are forming
able to engage with clients and manage our assets specialized equity teams.
proactively.
For projects in financial distress, our Special Operations
Twice a year, Management reviews the entire portfolio Department determines the appropriate remedial
of $55 billion for IFC’s own account, looking both at actions. It seeks to keep the project operational to
broad trends as well as select individual assets, and achieve the development impact intended at its
provides an in-depth review of portfolio results to the onset. It also negotiates agreements with creditors
Board semi-annually. Our investment teams, largely and shareholders to share the burden of restructuring.
based in field offices, complement global reviews with
asset-by-asset quarterly assessments, for both debt Investors and other partners participating in IFC’s
and equity investments. operations are kept regularly informed on project
developments. IFC consults or seeks their consent
At the corporate level, IFC combines the analysis as appropriate.
of our portfolio performance with local market intel-
ligence, and projections of global macroeconomic At the core of active portfolio management is the
and market trends to inform decisions about future need to have timely and accurate information to
investments. We also regularly conduct stress tests drive business decisions. IFC continues to invest in
to assess the performance of the portfolio against information-technology systems to better support the
possible macroeconomic developments, and to iden- management of our portfolio.
tify and address risks. In FY17, in light of substantial
volatility in emerging markets, IFC’s senior manage-
ment convened in-depth reviews for each of our
90 – 91
industry sectors and regions.
At the project level, our multidisciplinary teams,
including investment and sector specialists with deep
industry expertise, closely monitor investment perfor-
mance and compliance with investment agreements.
We do this, among other things, through site visits to
evaluate project implementation and through active
engagement with sponsors to identify potential prob-
lems early on and formulate appropriate solutions. In
addition, we systematically and timely track environ-
mental and social performance, and measure financial
and development results.
Creating MarketsManaging Risks In FY17, IFC continued the transition to the Investment
Risk Platform, our new credit-risk rating system and
economic capital engine. The new systems are aimed
ENTERPRISE RISK MANAGEMENT at better aligning IFC’s practice to internationally
recognized standards, where they make sense given
IFC provides long-term investments to the private our portfolio. The new risk rating system allows for
sector in emerging markets, which includes expanding easier comparison between outside ratings and IFC’s
the investment frontier into the most challenging internal ratings. More granular ratings lead to better
markets. In doing so, IFC is exposed to a variety of differentiation and a better understanding of client
financial and nonfinancial risks. Sound risk manage- credit standing, which allows for more focus on those
ment is crucial in fulfilling IFC’s mission. credits that most warrant additional scrutiny. The
improved predictive power for probability of default
IFC’s enterprise-risk-management framework is and loss-given default lead to more informed invest-
designed to enable the prudent management of ment decisions.
financial and reputational impacts that originate
from our business activities. In this context, IFC’s risk- TREASURY SERVICES
management efforts are designed specifically to help
align our performance with our strategic direction. IFC raises funds in the international capital markets
for private sector lending and to ensure sufficient
IFC has developed risk-appetite statements that set liquidity to safeguard IFC’s triple-A credit ratings.
the direction for our willingness to take on risks in
fulfillment of our development goals. These statements Issuances include benchmark bonds in core currencies
reflect our core values of maximizing development such as U.S. dollars, thematic issuances to support
impact, preserving our financial sustainability, and strategic priorities such as climate change, and issu-
safeguarding our brand. ances in e merging-market currencies to support
capital-market development. Most of IFC’s lending is
denominated in U.S. dollars, but we borrow in many
currencies to diversify access to funding, reduce
borrowing costs, and support local capital markets.
Over the years, IFC’s funding program has grown to
keep pace with our lending — in FY17, new core and
short-term borrowings totaled the equivalent of about
$16.2 billion.
FY17 borrowing in international markets
AMOUNT
CURRENCY (US$ EQUIVALENT) PERCENT
U.S. dollar USD 10,736,886,766.00 66.4%
Australian dollar AUD 1,338,424,500.00 8.3%
Japanese yen JPY 787,304,000.00 4.9%
Russian ruble RUB 647,034,012.90 4.0%
Brazilian real BRL 640,375,075.70 4.0%
Turkish lira TRY 499,593,694.20 3.1%
Indian rupee INR 477,162,653.40 3.0%
Other 1,047,283,816.22 6.5%
Total 16,174,064,518.42 100.0%LIQUIDITY MANAGEMENT CAPITAL ADEQUACY AND FINANCIAL CAPACITY
IFC Annual Report 2017
Liquid assets on IFC’s balance sheet totaled Sound risk management plays a crucial role in
$39.2 billion as of June 30, 2017, compared with ensuring IFC’s ability to fulfill our development
$41.4 billion a year earlier. Most liquid assets are mandate. The very nature of IFC’s business, as a
held in U.S. dollars. The exposure arising from assets long-term investor in dynamic yet volatile emerging
denominated in currencies other than U.S. dollars are markets, exposes us to financial and operational risks.
hedged into U.S. dollars or matched by liabilities in
the same currency to eliminate overall currency risk. Prudent risk management and a solid capital posi-
The level of these assets is determined with a view tion enable us to preserve our financial strength and
to ensure sufficient resources to meet commitments maintain our lending during times of economic and
even during times of market stress. IFC maintains financial turmoil. IFC’s financial strength results in low
liquid assets in interest-bearing instruments managed borrowing costs, allowing us to provide affordable
actively against stated benchmarks. financing to our clients.
In FY17, IFC made substantial enhancements to our The soundness and quality of IFC’s risk management
internal funding and liquidity policies in the form of and financial position can be seen in our triple-A
adding stressed liquidity coverage ratios, a require- credit rating, which has been maintained since
ment for core liquidity, and making adjustments for coverage began in 1989.
encumbered assets. The stressed liquidity coverage
ratios are designed to ensure IFC will have sufficient We assess IFC’s minimum capital requirement in
liquid assets in a period of extensive market and oper- accordance with our economic capital framework,
ational stress for up to a one-year period to cover which is aligned with the Basel framework and leading
both existing cash needs and new growth aspirations. industry practice. Economic capital acts as a common
IFC enhanced our liquidity framework to provide currency of risk, allowing us to model and aggregate
additional quantitative metrics for matched funding. the risk of losses from a range of different investment
products as well as other risks.
TREASURY RISK MANAGEMENT
Consistent with industry and regulatory practice,
Treasury risks are managed through a two-tier risk IFC calculates economic capital for the following
framework: (1) a comprehensive policy framework; and risk types:
(2) a hard e
conomic-capital limit for treasury activi-
••Credit risk: the potential loss due to a client’s default
92 – 93
ties. The policy framework is based on four principles:
or downgrade
(1) Investment in high-quality assets ••Market risk: the potential loss due to changes in
(2) Diversification via position size/concentration limits market variables (such as interest rates, currency,
(3) Tight limits on market risks (credit spread, interest equity, or commodity prices)
rate, and f oreign-exchange risk) ••Operational risk: the potential loss resulting from
(4) Proactive portfolio surveillance inadequate or failed internal processes, people, and
systems, or from external events; operational risk
In line with the changes that are occurring in the attends all IFC activities, including Advisory Services
global financial markets, IFC enhanced our Treasury and the Asset Management Company.
policy framework in FY17. Key initiatives include:
development of an expanded framework for stress IFC’s total resources available consist of paid-in
testing and contingency planning; enhancements capital, retained earnings net of designations and
to IFC’s approach to monitoring of counterparty certain unrealized gains, and total loan-loss reserves.
risk and structured product credit; bilateral collat- The excess available capital, beyond what is required
eral exchanges with derivatives counterparties; and to support existing business, allows for future growth
enhancements to IFC’s model validation framework. of our portfolio while also providing a buffer against
unexpected external shocks. As of June 2017, total
resources available stood at $23.6 billion, while the
minimum capital requirement totaled $19.4 billion.
Creating MarketsOur Sustainability IFC PERFORMANCE STANDARDS
Framework At the core of our Sustainability Framework are IFC
Performance Standards — w hich help our clients avoid,
mitigate, and manage risk as a way of doing business
sustainably. They help clients devise solutions that are
Sustainability is critical to companies’ good for business, good for investors, and good for
the environment and communities.
business success. It’s critical, too, for their
customers, surrounding communities, and Our Performance Standards have become a global
broader stakeholders. benchmark of sustainability practices. The Equator
Principles, which are modeled on these standards,
have been adopted by 91 financial institutions in
IFC research shows that companies perform better 37 countries. In addition, other financial institutions
financially — o
n returns on equity as well as returns on reference IFC’s Performance Standards — including
assets — when their environmental and social perfor- export-import banks and export credit agencies.
mance is strong. Nearly 90 percent of our clients IFC also serves as the Secretariat for the Sustainable
believe that our work is key in helping them reach their Banking Network, a global k nowledge-sharing group
long-term business goals, improve their relations with of banking regulators and banking associations,
stakeholders and local communities, and boost their to help develop guidance and capacity for banks to
brand value and recognition. IFC’s Sustainability Frame- incorporate environmental and social risk manage-
work and our Corporate Governance methodology are ment into credit decision making.
designed to help our clients achieve those objectives.
The Performance Standards guide our environmental
IFC helps clients understand and manage the risks they and social due-diligence process, which integrates the
face, partnering with industry and other stakeholders client’s assessment of environmental and social risks
to find innovative solutions that open up opportunities with an understanding of the client’s commitment
for economically, socially, and environmentally sustain- and capacity to mitigate and manage these risks. This
able private investment—w hich contribute in turn review identifies any gaps between client practice and
to jobs and inclusive growth. This may include lever- IFC Performance Standards in order to agree on a
aging the capacity of other institutions of the World plan of action to ensure compliance. We supervise our
Bank Group to address environmental, social, and projects throughout the life of our investment.
governance challenges that are beyond the ability or
responsibility of a company to solve alone. INTEGRATED GOVERNANCE
In all of our investment decisions, IFC gives the same Corporate governance is a paramount consideration
weight and attention to environmental, social, and in investors’ decision making. But investors are increas-
governance risks as we do to credit and financial risks. ingly paying equal attention to the way companies
This enables us to take informed risks to achieve both behave on a variety of environmental and social
development impact and financial sustainability. indicators. Investors see businesses’ management of
environmental and social issues as a test of how they
would handle all strategic and operational challenges.
It’s essential, therefore, to assess environmental, social
and governance practices in an integrated fashion.
The IFC Performance Standards
1
RISK MANAGEMENT
2
LABOR
3
RESOURCE EFFICIENCY
4
COMMUNITY
Anticipate risks, avoid, Treat workers fairly and Promote energy Protect local commu-
minimize and compen- provide safe and healthy efficiency, use resources nities from worksite
sate for any impacts. working conditions. sustainably, and cut accidents and other
greenhouse emissions. project-related dangers.In FY17, IFC developed comprehensive market guid- 43 percent of IFC’s f acility-related carbon emissions
IFC Annual Report 2017
ance and practical tools to do this in the context of (emissions from electricity, stationary combustion,
emerging markets, drawing on our track record in refrigerants, water-chiller electricity, and purchased
applying our Performance Standards and Corporate steam) and 12 percent of IFC’s total carbon footprint.
Governance Methodology. In addition, emissions just from headquarters elec-
tricity consumption account for 51 percent of IFC’s
One tool—o ur ESG Progression Matrix—guides com- electricity-related emissions.
panies, investors, regulators, c
orporate-governance
evaluators, and other stakeholders in assessing and Projects included raising the c hilled-water set point
improving a company’s environmental, social, and for the heating season, raising the data-center
governance framework. It emphasizes the importance cooling set points, and converting compact fluores-
of continuing progress—rather than static minimum cent lighting to LED lighting in several locations in
standards—in the governance practices of a company. the building. In total, these efforts are expected to
conserve about 545,000 kilowatt hours of energy
The matrix focuses the assessment along six and save IFC more than $64,000 each year. They
corporate-governance parameters — key environ- also contributed to a continuing reduction of IFC’s
mental and social policies and practices, the structure headquarters electricity consumption, which fell by
and functioning of the board of directors, the control 18 percent between FY08 and FY16.
environment, disclosure and transparency, treatment
of minority shareholders, and stakeholder engage- IFC continues to be carbon-neutral for global busi-
ment (which includes civil society and communities ness operations. In FY16, the latest year for which
affected by a company’s operations). data are available, carbon emissions from our global
business operations totaled about 48,279 metric tons
Another tool is the IFC Transparency and Disclosure of c arbon-dioxide equivalent. We purchased carbon
Toolkit and Guidance — which helps companies credits from a portfolio of six projects, including wind
in emerging markets prepare comprehensive and power and small hydropower in India, clean cookstoves
best-in-class annual reports that are appropriate in Uganda, household biodigester energy in Cambodia,
for their size and organizational complexity and and clean stoves and water treatment in Rwanda. IFC
adapted to the context of operation. The objective chose projects that bring tangible development bene-
is to provide useful information for investors and fits to the communities in which they take place.
other stakeholders.
FY16 carbon emissions inventory
94 – 95
We apply this integrated approach beyond the
companies we invest in. We also use it in our advisory
work with regulators and stock exchanges — to help
for IFC’s global operations
them apply higher disclosure standards to corporate METRIC TONS OF CARBON-DIOXIDE EQUIVALENT
listings, reporting requirements, and other dis
closure obligations. Business Travel 34,555
HQ Office Electricity 5,545
OUR FOOTPRINT COMMITMENT Country Office Electricity 4,972
Other 3,207
IFC’s Footprint Commitment is to make sustainability
an integral part of our internal business operations. TOTAL EMISSIONS 48,279
We continue to make energy-efficiency improvements
to our headquarters building, which accounts for
5
LAND RESETTLEMENT
6
BIODIVERSITY
7
INDIGENOUS PEOPLES
8CULTURAL HERITAGE
Avoid involuntary Protect biodiversity Protect the rights, Protect cultural
resettlement and and ecosystems. dignity, and culture of heritage and promote
Creating Markets
minimize the impact indigenous populations. equitable sharing
on those displaced. of related benefits.You can also read