Outlook 2021 Repair and Despair Generali Insurance Asset Management Spa SGR - Generali Investments
←
→
Page content transcription
If your browser does not render page correctly, please read the page content below

Outlook 2021 Repair and Despair Generali Insurance Asset Management Spa SGR

2 | Generali Investments – Outlook 2021

Content

Global View – Repair and Despair           3
Macroeconomic Outlook                      8

Government Bonds                          11

Corporate Bonds                           13

EM sovereign bonds                        15

Currencies                                17

Equities                                  19

Asset Allocation                          22

Forecasts                                 23

Imprint                                   26
3 | Generali Investments – Outlook 2021
Global View – Repair and Despair
2021 will see a ‘repair’ of the deep Covid-19 damages, with the economy set to rebound strongly as society normalises
into summer.
But there is much to despair about. Potential growth will be lower out of this crisis. Employment will recover more
slowly and Covid has fanned inequalities. Investors can also lament about the fall of future investment returns.
Falling policy uncertainty has compressed risk premia into the turn of the year. This process has legs, and more so as
investors face a new certainty: going forward, fixed income returns will be mediocre. This will support risk taking.
The revised central bank strategy creates a new investment paradigm: lower rates volatility, stretched cross-asset
valuations, more frequent corrections and lower diversification benefits. More than ever, hedging strategies matter.
We start the year with an overweight on equities, and a bias towards Cyclical and Value styles. The dollar will depreciate
further, if less fast. EM currencies and equities offer good value. We stay long Credit, but less so. 2021 will not be a
smooth ride; views are turning consensual, and extreme positioning may develop into spring. Use Q1 to build hedges.
“Everyone has a plan: until they get punched in the face.” Mike Tyson’s warning
surely applied to investment in 2020. Our 2020 Outlook ‘The Beauty of Symmetry’ of
course did not predict the pandemic, but the title itself outlined the key role that cen-
tral banks would play. Society was hit by an incredible exogeneous shock: the draw-
The year of black swans down on developed market GDPs was between two and three times that of the Great
ends on a cheerful note for Financial Crisis (GFC). In this context not many would have predicted in early spring
financial markets that most risk assets would end the year very comfortably above water (S&P +14%
as we go to press). Now is the time to repair the damage… and to despair.
A strong recovery, but permanent scars
The powerful policy response, both fiscal and monetary, is clearly accelerating the
Repair = strong recovery in recovery, notwithstanding the hiccups caused by renewed social restrictions on suc-
2021… cessive Covid-19 waves. With vaccines facilitating a normalisation of our social be-
haviours by spring and summer, we predict global growth at 5.2% in 2021. It is not
Graph 1: TOTAL RETURNS 2020 Graph 2: REPAIR: OECD UNEMPLOYMENT RATE; US SAVING RATIO*
Up to 14 December 2020 * As a % of disposable income
exactly a V-shape, as the latter would have implied that output and profits return to
pre-crisis levels as early as end 2020. But we do expect that by end 2021, euro area
(EA) GDP will already retrieve end-2019 levels. US GDP and corporate earnings will
get there even quicker – a remarkable feast indeed. Yet there is much repair to be
done. Employment of course will not recover as quickly (Graph 2a). Saving ratios have
surged (1b) and are unlikely to return to pre-crisis levels as precautionary behaviours
4 | Generali Investments – Outlook 2021

                                                            hamper consumer spending. Impaired corporate balance sheet will also be a drag on
                                                            capital expenditures. There is much repair to be done on sovereign balance sheets
                                                            too, though of course the post-GFC mistake of tightening fiscal policy too quickly will
… Despair = weaker poten-
                                                            not be repeated. The IIF’s Global Debt Monitor highlights a record build-up in gross
tial growth, inequality, pop-
                                                            debt, essentially on the corporate and sovereign side, in contrast to the pre-GFC (con-
ulism…
                                                            sumers and banks). The rescues were much necessary, to avoid an even harsher eco-
                                                            nomic destruction, but have inevitably failed to discriminate between strong and weak
                                                            companies, which risks a ‘zombification’ of the economy. All this will contribute to
                                                            weaker potential growth going forward – which we see as low as 0.9% in the euro
                                                            area, out of this crisis. Secular stagnation is a matter of despair indeed, and so is the
                                                            rising income (and wealth) inequality and declining faith in democracy.

 Graph 3: DESPAIR ASFUTURE EQUITY RETURNS ARE SET TO FALL…                          Graph 4: … AND BBB CORP. WILL GENERATE MEAGRE FI RETURNS

 * Based on 12m forward earnings, smoothed (6mth average)

                                                              Investors too have much to despair about. The S&P has delivered an average
                                                            annual total return of 15% over the past 10 years – amazing. Earnings yields are a
… and lower financial re-                                   good predictor of future returns (Graph 3) and tell us that equity returns will be much
turns                                                       lower in the future (see “Life after Covid: 5-year total return forecasts”). Fixed Income
                                                            returns will decline, too, as both carry and the potential for capital gains (falling yields)
                                                            have melted like snow in the sun (Graph 4). In all, 2021 will be the year of repair but
                                                            the long-term damages of the Covid-2019 crisis should not be underestimated.

                                                            The fall in uncertainty
                                                              In the recovery fully priced in already? Graph 5 for instance shows investors’
                                                            sentiment about the EA economy. ‘6-month Expectations’ have improved sharply
                                                            already, and may be peaking indeed. But the ‘Current Situation’ remains very poor,
                                                            and has much room to improve. As the recovery proceeds in 2021, we expect equity
                                                            returns to remain positive, but lower of course as ‘Expectations’ progressively flatten
                                                            out (Graph 6).
A strong economic re-
bound, ongoing policy sup-                                    Are risk asset valuations already pricing all the good news? We do not think so.
port and falling uncertainty                                There is no question that, with IG credit spreads back to pre-crisis levels and the 12-
support high valuations                                     month forward price earnings ratio of the MSCI World close to 21, valuations are not
                                                            cheap. But this must be seen in the context of 1/ a strong recovery in 2021, 2/ ongoing
                                                            strong policy support and 3/ falling policy uncertainty. The latter is particularly critical
                                                            as uncertainty is the main driver of risk premia.

                                                             The US presidential elections reduced uncertainty as it improved the chances of
                                                            smoother international relations and a return to multilateralism. Arguably the US-
                                                            China cold war will continue, but the US will probably entertain more ‘normal’ relations
5 | Generali Investments – Outlook 2021

                                                                     with its traditional partners, including Europe. Brexit negotiations are ongoing as we
                                                                     go to press, but our central scenario is that the no-deal outcome will be avoided. The
                                                                     vaccines of course, barring any bad surprise on side effects for specific risk groups,
                                                                     make it far more likely that restrictions will be mostly lifted into summer 2021.

 Graph 5: EUR SENTIX CURRENT SITUATION VS 6M EXPECTTIONS                                          Graph 6: SENTIX TO STAY HIGH AND SUPPORT POSITIVE EQUITY RE-
                                                                                                         TURNS

 Since 2007; the bigger the bubble, the more recent                                               Modified (EU) Sentix = (Current + 6m Exp.) / 2 + 0.54 x (6m Exp. – Current)

                                                                       Graphs 7 and 8 show the link between policy uncertainty and financial variables.
                                                                     Policy uncertainty can be measured through news flows, and the work of Baker,
                                                                     Bloom and Davis in this field is useful. The US dollar typically tends to benefit from
                                                                     uncertainty and has been falling hard since end-April 2020 as the outlook became
The certainty of poor Fixed                                          more predictable. The Equity Risk Premia (ERP) have also been falling as uncertainty
Income returns is forcing in-                                        declined. Mind that policy uncertainty still looks in Europe (Graph 8), as the renewed
vestors to chase risk and li-                                        lockdowns, EU budget talks and Brexit tensions have clouded the outlook. We expect
quidity premia                                                       those uncertainties to lift into 2021, offering further support to risk sentiment at the
                                                                     start of the year. Not only policy uncertainty has declined, but a new certainty has
                                                                     developed, which we think profoundly alters the investment paradigm: the certainty
                                                                     of poor Fixed Income returns is forcing investors to chase risk and liquidity
                                                                     premia.

 Graph 7: USD FALLS AS GLOBAL POLICY UNCERTAINTY* DROPS                                           Graph 8: EU POLICY UNCERTAINTY TO FALL, KEEPING ERP** LOW

 * Baker, Bloom and Davis ** Equity Risk Premium, = 12mf Earnings yield - 10y EA av. sov. yield
6 | Generali Investments – Outlook 2021

                                          The new investment paradigm
                                            “This time is different” may be the most dangerous phrase for investors. What is
                                          different, however, is that real yields are trading deep into negative territory. US 10-
                                          year real yields are ranging around -1.0%, vs. near +4% when TIPS were created in
                                          the late nineties and around +1% in 2014-2018. The secular decline of real yields
Secular decline: 10-year                  has been a feature of the past 30 years. It has been driven by secular stagnation, and
real yields down from +4%                 the repeated efforts of central banks to rescue the economy following the internet
to -1% over past 30 years                 bubble, the Great Financial Crisis, the euro area sovereign crisis and the Great Covid
                                          Crisis. They have not only cut rates, but injected massive amounts of liquidity in the
                                          marketplace, with 2020 dwarfing any previous experience (Graph 9). This liquidity
                                          needs to find a home; while the preference for liquidity and security tends to increase
                                          in the aftermath of a deep crisis, investors’ animal spirit quickly comes back and the
                                          hunt for juicy investments benefits riskier assets, particularly so when risk-free invest-
For equities to enjoy single              ments offer abject returns. Graph 10 shows that equity multiples have surged as real
digit returns in 2021, no fur-            yields collapsed. Central banks very much intend to keep real yields depressed, as
ther expansion of multiples               the secular stagnation theory precisely argues that savings and investments cannot
is required                               balance at the full employment level without a depressed level of real rates. Of course,
                                          the high valuation metrics depress the medium-term performance outlook, yet mind
                                          that for equities to enjoy single-digit returns in 2021, no further expansion of mul-
                                          tiples is required: the strong earnings recovery and ‘roll-up’ (forward earnings rise as
                                          the economy recovers) will do the job.

                                                                 Graph 10: FALL IN US REAL YIELDS HAS SUPPORTED PRICE EARNING
 Graph 9: G4 CENTRAL BANKS BALANCE SHEET & MSCI WORLD
                                                                        (PE) EXPANSION

                                             Average Inflation Targeting (AIT) was already a feature in our 2020 outlook, where
                                          we stressed the fundamental implications of central banks making the inflation target
                                          more symmetric. Within this new framework, the last cycle would have never seen any
                                          rate hike. In the current cycle the Fed will keep rates near zero for years. We also
New paradigm: lower rates                 expect the ECB to adopt a new inflation target as it concludes its strategic review this
volatility, stretched valua-              summer; already it has committed to pursuing its PEPP until at least March 2022. This
tions, more frequent correc-              new strategy from central banks creates a new investment paradigm whereby real
tions and lower diversifica-              rates are stuck at very low levels. We see four implications: 1/ Rates are low and rates
tion benefit                              volatility is compressed, which tends to support carry strategies. 2/ Low real rates
                                          trickle down to other asset classes, making asset valuation generally stretched. 3/
                                          Stretched valuation and crowded positions, along with a more fragile market micro-
                                          structure (tiny trading books, passive investment, systematic portfolios etc.) will make
                                          corrections more frequent. 4/ Portfolio diversification is impaired, as there is little
                                          room for risk-free rates to decline and fixed income portfolio to rescue equity portfo-
                                          lios through recessions or risk-off events.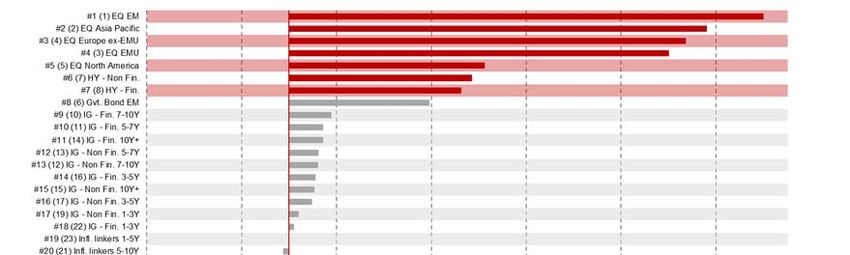
7 | Generali Investments – Outlook 2021

                                                                In this context, the hedging strategy becomes ever more important and needs
                                                              to be placed at the core of the investment function.

                                                              It’s all about bond yields… and investor positioning
                                                                Could bond yields rise and upset the whole investment paradigm? Graph 11
                                                              suggests that bonds yields have lagged other cyclical measures. They have done so
                                                              for a good reason: the anchoring from central banks. We see room for a limited rise
                                                              in yields next year, and more so in the US where inflation is substantially higher than
                                                              in the euro area. But 10-year Treasury yields are still likely to close the year below
                                                              1.25%. Mind the upside risk in case of a blue sweep at the Georgia run-off elections,
                                                              implying bolder fiscal expansion and, as a result, a less proactive Fed (duration ex-
                                                              tension less likely in that scenario). FI returns will be mediocre, and we retain an under-
                                                              weight (UW) in Govies; we see further steepening room, especially in 10-30y sectors.
Starting the year with an eq-                                 Mind that non-EUR sovereign markets offer yield pick-up, both in DM and EM, even
uity OW, smaller Credit OW,                                   on an FX-hedged basis; we see good diversification opportunities there, and more so
government bonds UW                                           for buy-and-hold insurance portfolios (US, Japan, Australia, selected EM).

                                                                 We stick to our OW in Credit, but a smaller one given that there is much less juice
Value in EM currencies and                                    left in this segment. IG spreads have returned to pre-crisis levels and are now likely
equities                                                      to head towards the 2018 lows. We go down the rating scale, down to BBs, and still
                                                              like Hybrids and AT1 for the carry and limited risks. High Yield defaults will rise but
                                                              peak at a much lower level than post-GFC (5-6% in Europe vs. 8-9%).
Mind positioning, and scale
up hedges as volatility pulls                                   We will start the year with an OW in equities, with a bias towards cyclical and
back further in Q1                                            value stocks. We see much room for EM currencies and equities to catch up. The
                                                              anti-cyclical USD remains bearish, but the fall will decelerate as the recovery becomes
                                                              less China-centric.

                                                                2021 will likely not be a smooth rise. The risks include disappointment on the
                                                              vaccine (virus mutation, side effects), a severe Tech regulatory tightening, a hard
                                                              Brexit or renewed US-China animosity. The biggest risk may be positioning. We see
                                                              signs of exuberance, e.g. in the put/call ratio (12a) or record speculative positions on
                                                              Copper. Yet positions are not as stretched as before the flash crash of 2018 (12b); the
                                                              systematic community looks less leveraged and bullish. Still, we will keep a close eye
                                                              on positioning and sentiment: tactical asset allocation matters.

 Graph 11: BUND RESILIENT TO BULLISHECONOMIC SENTIMENT? UST                          Graph 12: US EQUITY CALLS FAR MORE POPULAR THAN PUTS, AAII*
        RESILIENT TO BULLISH CYCLICAL FORCES?                                               BULL/BEAR INDEX HIGH BUT NOT EXTREME

 Copper/Gold price ratio usually a solid cyclical indicator                          * AAII: American Association of Individual investors

                                                                                                                                             Vincent Chaigneau
                                                                                                                                            +33 (0) 15838-1826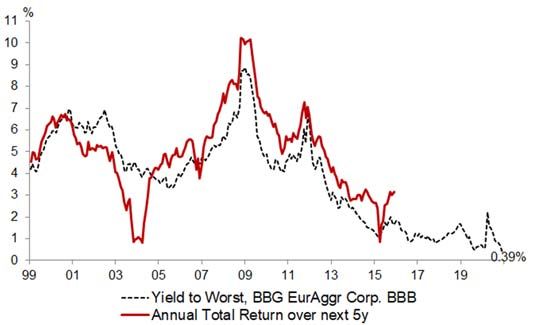
8 | Generali Investments – Outlook 2021
Macroeconomic Outlook
The Covid-19 pandemic is keeping a tight grip on the global economy near term. But the scene is set for a
vigorous growth rebound over spring/summer 2021 thanks to strong progress on Covid-19 vaccines and amid
persistent support from fiscal and monetary policy.
Growth rates of 3.9% in the US and 5.5% in the euro area will help to recoup pre-crisis activity levels over H2
2021, but persistently wide output gaps will keep price pressures muted especially in the euro area.
China’s V-shaped recovery is set to remain on track despite reduced fiscal support. Helped also by a weaker
US dollar and low real rates, most emerging markets will participate to the global rebound despite the dissem-
ination of vaccine lagging the advanced economies.
An annus horribilis for the global economy is drawing to a close with the deepest
recession since WWII. Many economies remain battered and constrained by the
winter resurgence of the Covid-19 pandemic. Fortunately, the prospects for 2021 are
much brighter, with the scene set for a vigorous growth rebound.
This is in the first place due to the fast progress on vaccine development. While this
The global rollout of Covid-
is usually a matter of years, the vaccine by BioNTech/Pfizer has received emergency
19 vaccine is set to be a
approvals after less than twelve months in the UK and the US, with the euro area
game changer, laying the
admision likey to follow soon. With most vulnerable people set to receive vaccinations
ground for a strong global
in Q1, we expect restrictions to be lifted over spring and summer. The resulting
rebound
economic rebound, in particular in countries and sectors most battered in 2020, will
help the global economy to recoup pre-crisis levels of activities already this year.
Existing fiscal support will be withdrawn only very gradually while some new US fiscal
stimulus is still likely even under a split new administration. Key central banks will
maintain their highly accommodative stances for longer as the persistently high output
gap and unemployment will keep price pressures muted, in particular in the euro area.
Emerging markets are likely to lag in the rollout of vaccines, even though some areas
(notably China) have managed to keep the virus under control recently. We expect
Emerging Markets will lag in
China’s economy to grow by 7.8% in 2021, remaining a strong pillar of global eco-
the rollout of vaccines, but
nomic growth. The PBoC will reduce monetary support only very prudently, focusing
will benefit from strong Chi-
on quantitative tools, but not hiking rates before late 2021. The tailwinds from the V-
nese growth, a weak US
shaped recovery in China, a weaker US dollar (a relieve to external debt service and
dollar and low real rates
to global trade) and low real rates will help EM economies to participate to the global
rebound.
Apart from the virus and possible setbacks in vaccination efforts, the Brexit is a
sizeable near-term risk for Europe. With an agreement hanging in the balance at the
time of writing, our projections are based on the assumption of a last-minute deal. A
hard end of the transition period out of the single market, by contrast, would imply a
fallback to WTO rules, disrupting the close trade ties between the UK and Europe and
shaving almost half a percentage point of 2021 GDP in the euro area (and even 1.5pp
in the UK). This would dent, but not derail the 2021 recovery given the strong growth
impulse from a vaccine-led recovery.
Vaccination to pave the way for recovery
Emerging Markets will lag in The speed of the recovery is still surrounded by high uncertainties as the the removal
the rollout of vaccines, but of lockdowns and restrictions hinges on when a critical share of populations becomes
will benefit from strong Chi- vaccinated. At the outset, production capabilities and logistical challenges will be the
nese growth, a weak US constraining factors. The approval of further vaccines (incl. e.g. Moderna and Astra-
dollar and low real rates Zeneca) will be critical for lifting the speed of inoculations of most vulnerable groups.
Later into the year, with more ample jabs available, the willingness of the population
to become vaccinated will become binding for achieving herd immunity. Public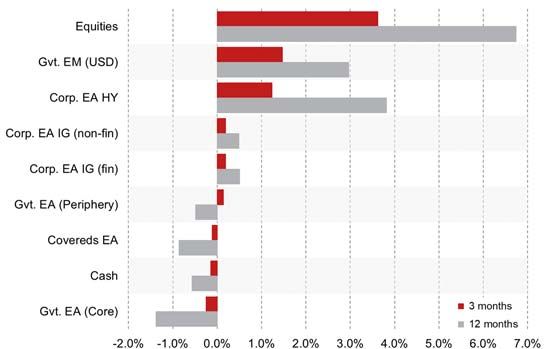
9 | Generali Investments – Outlook 2021

                                                               scepticism is still worryingly high in some countries, incl. the US, France and parts of
                                                               Eastern Europe, but resistance may ease if fears of severe side effects do not mate-
                                                               rialize.

                                                                 We deem it likely that in the euro area the increased stringency measures that were
                                                               adopted in response to the second Covid-19 wave will persist well into January 2021
Restrictions may prevail                                       but can gradually be eased thereafter as the pandemic situation improves and vulner-
well into January, but vac-                                    able groups and front-line health workers get vaccinated. This will allow restrictions
cination progress will allow                                   to be significantly lifted in spring and to be fully abolished in the autumn, allowing not
stringency measures to be                                      only for re-opening of intentionally closed sectors (e.g. travelling, accommodation, art
lifted more meaningfully                                       and entertainment) but also triggering a sharp improvement in sentiment as the risk
from spring onwards                                            of renewed lockdowns will be largely off the table. This will boost consumption and
                                                               investment activity additionally.

                                                                 In the US, less stringent containment measures than in Europe are currently in place
                                                               but vaccinations will have similarly positive effects on confidence. With the vaccina-
                                                               tion being rolled out gradually, the economy will have to endure the fallout from an-
                                                               other wave of infections. Therefore, sluggish consumption growth will lead to stag-
                                                               nating output in Q1 while we expect only a limited cushion from a new fiscal package
                                                               (see below). That said, we see herd immunity to be already reached by mid-year. This
                                                               will allow pent-up demand to raise services consumption, with a sizeable upward im-
                                                               pact on growth in the second half of the year. We expect GDP to rise by 3.9% in 2021.

 Graph 1: A BENT ‘SWOOSH’ RECOVERY                                                     Graph 2: EURO AREA LOCKDOWN AND COVID-19 CASES

  110                                                                            110   180000                                                                                     90

                                                                                       160000                                                                                     80
  105                                                                            105
                                                                                       140000                                                                                     70

                                                                                       120000                                                                                     60
  100                                                                            100
                                                                                       100000                                                                                     50
   95                                                                            95
                                                                                        80000                                                                                     40

                                                                                        60000                                                                                     30
   90                                                                            90
                                                                                        40000                                                                                     20
   85                                                                            85     20000                                                                                     10

                                                                                             0                                                                                    0
   80                                                                            80          01/20         03/20        05/20        07/20         09/20        11/20
        Q4/19                  Q4/20                   Q4/21             Q4/22
                  US          Euro Area             US-Trend      EA-Trend                        New Covid-19 cases, 7-day average                 Stringency index (rhs)

 real GDP, Q4 2019 = 100, GIAM Research forecasts                                      Uni. of Oxford stringency index, EA: GDP weighted average of 11 largest economies (98% of GDP)

                                                               Ongoing support from fiscal and monetary policy
Euro area: Recovery Fund                                         The 2021 upswing will also be supported by persisting policy support. In the euro
and ECB underpin a sup-                                        area, the usual metrics show only a mildly reduced impulse from national fiscal
portive environment                                            measures in most countries in 2021. Crisis-fighting support measures can be scaled
                                                               back without negative effects on activity as the pandemic eases. Thanks to the agree-
                                                               ment on the next EU budget and the Recovery and Resilience Facility, the EU econo-
                                                               mies benefit from centrally provided funds for investment in growth-enhancing sec-
                                                               tors already from next year onwards, while they need to be paid back only from 2028
                                                               onwards. This will benefit especially the Southern European economies that were hit
                                                               particularly hard by the pandemic.

                                                                 The euro area economic recovery will be accompanied by an ongoing highly sup-
                                                               portive ECB policy stance. At its December 2020 policy meeting the Governing Coun-
                                                               cil basically extended its current policy stance throughout 2021. Key measures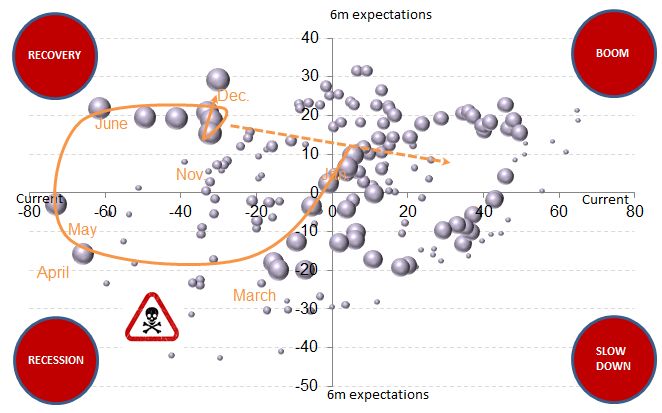
10 | Generali Investments – Outlook 2021

                                                               adopted include the extension of the Pandemic Emergency Purchase Programme
                                                               (PEPP) in terms of duration (to at least March 2022) and volume (by € 500 bn to € 1.85
                                                               tr), more TLTROs at better conditions and the extension of other tools (collateral rules,
                                                               PELTROs) adopted in spring. Thereby, financing conditions will remain highly sup-
                                                               portive. We expect activity to recovery strongly in the second quarter of 2021 and to
                                                               remain well above normal thereafter lifting the annual growth rate to 5.5%, from -7.3%
                                                               before. For 2022 we look for a continuation of the upswing, albeit at reduced momen-
                                                               tum and see output expanding by 3.7%. That said, with the output gap remaining
                                                               wide, price pressures will remain muted even amid the stronger economic rebound.

 Graph 3: THE ECB’S PEPP
                                                                                      Graph 4: US FEDERAL FUNDS RATE AND FINANCIAL CONDITIONS

                                                                                                                                                                           0.4
 2,000                                                                           40
                                                   Dec. 2020: 1850                    2
 1,800                                                                           35                                                                                        0.2
 1,600
                                                                                 30   0                                                                                    0
 1,400                        June 2020: 1350

 1,200                                                                           25
                                                                                                                                                                           -0.2
 1,000                                                                           20   -2

   800   March 2020: 750                                                                                                                                                   -0.4
                                                                                 15
   600                                                                                -4
           cumulated actual                                                                                                                                                -0.6
            purchases
                                                                                 10
   400
   200                                                                           5    -6                                                                                   -0.8
                                                                                        2013                 2015                  2017                  2019
     0                                                                           0

                                                                                                       Effective          Shadow            Fin. conditions

 bn EUR, weekly data on purchases under the PEPP                                      The shadow rate includes the impact of QE, Financial conditions: Chicago Fed index

                                                                 In the US the likely lack of a Democratic majority in the Senate, and the preference
                                                               of the new administration of speed over size will limit the scope of a new fiscal pack-
US: limited fiscal stimulus,                                   age and twist its composition away from direct transfers to household (the measure
the Fed has still scope to                                     with the biggest short-term impact on growth). We expect measures worth no more
act on QE                                                      than US$ 1tn to be passed into law before President elect Biden will be sworn in (Jan.
                                                               20). After that, political gridlock will likely prevent any substantial fiscal measures.

                                                                 The outcome of the runoff election for two Senate seats in Georgia (Jan. 5) could
                                                               change the situation, though. If the Democrats were to surprisingly win both, the 50-
                                                               50 stalemate in the Senate would be resolved by a pivotal vote by vice-president Har-
                                                               ris to the Democrat’s favour, allowing them to enact strong fiscal measures. Concern-
                                                               ing the Fed, under the newly presented average inflation targeting framework, rates
                                                               will in our view not rise from the current almost zero levels before at least mid-2024.
                                                               The Fed may still support growth via asset purchases. The recent decision by the
                                                               Treasury to withdraw capital support to credit purchases narrows the set of tools the
                                                               Fed can use. Yet it will still be able to act through Treasury and MBS purchases.
                                                               Intervention can be direct, by lengthening the duration of the securities bought in or-
                                                               der to flatten the yield curve, or indirectly, by steering market expectations through
                                                               guidance on the future path of QE. But the support to growth may not be that large,
                                                               as financial conditions are already favourable and the most interest rate sensitive sec-
                                                               tors of the economy (first of all construction) are already growing at a strong pace.

                                                                                                      Thomas Hempell / Martin Wolburg / Paolo Zanghieri
                                                                                                                               +49 (0)221 / 4203-5023
11 | Generali Investments – Outlook 2021
Government Bonds
International government bond markets were definitely under the sign of Covid-19 in 2020. Particularly an unprece-
dented monetary policy reaction kept financial markets afloat and will continue to impact government bond yields in
2021.
Hopes for a vaccine-led growth rebound and slightly higher inflation rates are seen to trigger moderately higher yields
over the course of 2021. Rising net supply amid a dovish Fed is seen to lead to a bear steepening of the US yield curve.
Euro area government yields have less scope to rise as the ECB will keep sovereign bond net supply in negative territory.
Still, slowly inching up inflation rates have the potential to lead euro area government yields slightly higher in 2021.
Euro area non-core government bonds are expected to continue their outperformance. Above all spreads have more
leeway to tighten in H1 2021 while higher-yielding non-core bonds are likely to again perform better than core bonds.
Driven by the outbreak of Covid-19 government bond yields continued the down-
ward trend from 2019 into 2020. Although they rebounded from the historical lows
more than 40% of outstanding G10 sovereign debt is currently trading in negative
territory (the respective share for the euro area is even close to 80%).
International government bond markets will remain strongly influenced by fiscal and
monetary policies in 2021. Central banks will remain dovish and are likely to err on the
International government side of caution in order not to derail the economic rebound (confirmed by the Fed’s
bond markets remain domi- new framework ‘Average Inflation Targeting’). As central banks will keep key rates on
nated by extraordinary polit- current low levels well beyond 2021 the short end of the curve will stay anchored for
ical influence in 2021. the time being. Nevertheless, fiscal policy will continue to be very expansionary in
2021 as above all in H1 2021 the Covid-19 pandemic will still leave its marks.
Once the vaccine-induced economic recovery takes hold from spring 2021 onwards
it will be reflected in a rise in yields. Our base scenario assumes that there are no
undesired side effects of the vaccine and that the virus does not mutate. If this is the
case and the global economy does not recover higher yields are not on the cards.
But, in case the recovery kicks in we expect 10-year US yields to rise to 1.20% by
year-end. The increase could be much more pronounced if the Democrats win the
two run-off elections in Georgia as this would imply a Democratic majority in the US
Congress. This means US President Biden would be able to implement a major part
of his economic policy programme and a much more expansionary fiscal policy. How-
ever, even with only a moderate fiscal package the way is paved for a bear steepening
of the US curve.
Limited leeway for euro area yields to rise
The upward movement in the euro area is likely to be more lacklustre than in the US
for several reasons. The common currency area has been hit hard by the second wave
and it will take longer until the pre-crisis GDP level is reached again. Particularly, in-
flation has fallen to an all-time low and will only inch upwards sluggishly.
The ECB appears to be committed to ensure ease financial conditions, support the
Euro area real yields are economic rebound, and to lift inflation towards its medium-term target. It made clear
forecast to remain on a very that an increase in inflation is a prerequisite for a lasting change in its monetary policy.
low level. Any increase in As this is still some way off, we do not see a significant yield increase over the course
nominal yields is likely of 2021. For 10-year Bunds we forecast a yield level of -0.45% until the end of 2021.
driven by higher inflation ex- Hence, the transatlantic yield spread is expected to widen further at the long end of
pectations. the curve (at the short end the widening is more muted as the accommodative policy
of both central banks will to a large extent prevent any meaningful increase).
It is noteworthy that we forecast this meagre nominal yield increase to be most likely
driven by higher inflation expectations. Hence, the pattern of falling/stable real yields
and rising inflation expectations already visible since March is likely to continue.12 | Generali Investments – Outlook 2021
Graph 1: EURO AREA SOVEREIGN BOND ISSUANCE Graph 2: SPREAD VOLATILITY CLOSE TO HISTORICAL BOTTOM
1400 700 200
1,265
1,230
180
1200 600
160
1000
851 500 140
800
685 691 656 120
400
572 574
600 100
300
400 80
165 200 60
200 139
40
0 100
20
-200 -125 -92
0 0
Gross Redemptions Net Net (incl. ECB)
04/08 04/10 04/12 04/14 04/16 04/18 04/20
2019 2020 2021e Weighted average 1-mth rolling trade margin (rhs)
In bn € 10-year sovereign bond spread of Italy, Spain, Portugal, Greece (in bps)
The extremely accommodative ECB policy is reflected in the technical situation of
euro area bond markets, too. As euro area budget deficits will shrink only modestly
Unusual high uncertainty re- compared to 2020 funding needs will remain on a very high level in 2021. Although
garding the euro area bond projections are still fraught with a high degree of uncertainty (e.g. level of funding
issuance, but the ECB is ex- needs, share of funding by T-bills, timing of disbursement of EU Recovery Funds),
pected to take down the gross supply of sovereign bonds will likely shrink only marginally and net supply will
bulk of new bonds. remain at approximately the 2020 level also in 2021 (see graph 1). The ECB will act
flexibly depending on the market environment. Effectively, the central bank will con-
tinue to control the yield level in the entire year 2021. Considering purchases of non-
sovereign government bonds and taking into account T-bills we estimate that the ECB
will buy around €665 bn of sovereign paper in 2021 (with a focus on Q1 amid the
forecast frontloading by euro area treasurers). Hence, the ECB will absorb more than
half of 2021 sovereign bond gross supply and, accordingly, net supply will remain in
negative territory (in contrast to the US).
Higher yielding euro area non-core bonds remain first choice
Supported by progress on fiscal integration the rally of euro area non-core sovereign
Stable environment induces bonds continued in 2020. Particularly, Greek and Italian bonds outperformed. As the
ongoing hunt for yield – In- environment remains benign this pattern is likely to continue in 2021. The implicit yield
vestors are recommended control by the ECB reduces fragmentation risks and has contributed to an extremely
going for carry in euro area low volatility. Not only euro area core yields move in a tight range, but also the spread
non-core bonds. volatility of non-core bonds is close to a historical low (see graph 2). This encourages
investors searching for a yield pick-up to go for carry and to invest in longer-dated
bonds as well. This applies increasingly also to investors outside the euro area.
Accordingly, we see further leeway for non-core bond spreads to narrow. With spec-
ulations about a withdrawal of the ECB not on the radar screens yet non-core bonds
are expected to perform particularly well in H1 2021. This is all the more true as higher
debt ratios are to some extent balanced by lower funding costs, thereby pushing back
debt sustainability concerns for the time being. Some (moderate) spread widening
appears feasible in H2 as an improving economic environment is forecast to raise
voices calling for a reduction of ECB support. However, this is not seen to reverse the
outperformance of euro area non-core bonds in 2021.
Florian Späte
+49 (0)221 / 4203-505213 | Generali Investments – Outlook 2021
Corporate Bonds
The rally in corporate bonds has been impressive and IG indices are back to their pre-crisis levels, while HY spreads
remain 15-20% wider. The compression has been the most pronounced in the long end of credit curves and cyclical
sectors.
Both IG and HY performances over 2020 in total return terms are very close, around 2.5%. We anticipate better pro-
spects for TR performance in HY next year, but spreads will tighten in both universes.
The support from the ECB will remain extremely strong both via the CSPP for EUR5bn per month and the PEPP if
necessary. Christine Lagarde has made it very clear that the governing council will not tolerate any fragmentation of
the credit market.
In term of issuance, 2020 has been counterintuitively a record year but 2021 issuance will be down by 10 to 20%. Net
issuance will be even lower taking into account the purchases by the ECB, representing a strong support for credit.
The valuation of the credit market may look rich under many metrics, credit spreads
are below long term averages. Yet wee keep a postive view on the asset class as
upport from central banks, as well as the intesifying search for yield will likely
contribute to further spread tightening. We exepct for end 2021 tighter spreads across
the board from 10 to 15 bp in IG and 30-50bp in HY.
Indeed, credit spreads remain wider than similarl or less well rated sovereigns like
Portugal and their slope is also offering more upside although credit curves have
flattened very rapidely over the past two months. Moreover the postionning is not
extreme in credit markets, IG funds are back to their January levels while high yields
funds continue to manage less assets than pre-Covid, leaving room for further
normalisation. Although if there is no exhuberance in terms of fund positionning, the
postive view on credit is extremely consensual which is never a good sign.
The ECB is bigger than you
However, we do not want to fight the ECB. Its support will remain gigantic at least
until March 2022. Not only the ECB will continue to buy EUR5bn corporate bonds via
its CSPP program, but they will continue to fight any widening credit spreads or frag-
mentation across countries and sectors. With an estimated pace of EUR93bn pur-
chases per month for the PEPP and flexibility around the monthly pace, the ECB has
enough ammunition to reach this goal. When IG corporate spreads went below 100bp
in OAS, the ECB interrupted the purchase of corporate bonds within its emergency
program. Hence, we consider those 100bp as a threshold, and any widening above
this 100bp threshold will lead the ECB to resume its purchases to prevent any further
widening.
An only mild rise in European defaults expected… but for longer
We also think the outlook for defaults will be less severe than expected at the peak
of the crisis. Simple correlation with diffusion indices would suggest a peak in default
The ECB has made clear it around 10% in early 2021. Macroeconomic models including GDP forecasts, corpo-
will not tolerate any rise in rate leverage and ECB Bank Lending Survey point to defaults around 8% but the fiscal
corporate spreads or frag- support granted to the private sector is very hard to factor into the equation. Hence,
mentation of the credit mar- we think all the guaranteed loans, moratoria and furlough schemes will allow defaults
ket to remain much below 2009 levels around 5-6% vs. 4% today. It is also related to the
very defensive composition of HY benchmarks nowadays versus 2008, with BB rep-
resenting now 70% of the BofAML index versus less than 50% in 2008, while BB
defaults probability remain very low.
The zombification of the European economy is a possibility
However, the support to the corporate world is very expensive and can’t last forever.
We think that with the gradual removal of the stringency measures, governments will
also start to reduce the fiscal support to corporates over the second half of 2021. Only14 | Generali Investments – Outlook 2021
then we will find out what share of the private sector was financed in vain and what
share will return to normal profitability or even sub-normal. Likely, some defaults were
only lagged by the fiscal support, resulting in a default rate likely to stay above the
long-term average for longer. Recoveries may also fall below their long-term average
of 40% as the leverage of the non-financial world was very high before the Covid,
meaning that more debt will be repaid with the same assets. Moreover, while bond
issuers may end-up well thanks to their large liquidity buffers, SMEs will be hit harder
with some possible consequences on the banking sector.
The financial sector to resist deteriorating asset quality in 2021
Financials entered this crisis much better capitalised than in 2008 but it did not pre-
vent them from being very volatile in the first phase of the Covid-related sell-off. None-
theless, the credit channel being key to the preservation of loose financial conditions,
a very strong regulatory support has been offered to financials and banks throughout
Graph 1: BREAKDOWN OF CUM. NET PURCHASES UNDER THE PEPP Graph 2: CREDIT SPREADS VS. PRE-COVID LEVELS
250000 50%
40%
200000
30%
150000
20%
10%
100000
0%
Financial Subordinated…
Non-Financial…
Non-Financial
Financial
Utility
Auto
Single-A Corporate
Real Estate
BB High Yield
Senior Non-Financial
Telecommunications
Capital Goods
Energy
Services
5-7 Year Corporate
BBB Corporate
3-5 Year Corporate
1-3 Year Corporate
High Yield
Retail
Corporate
Leisure
Basic Industry
7-10 Year Corporate
Transportation
Senior Banking
Single-B High Yield
CCC & LowerHigh Yield
Contingent Capital
50000
-10%
0
Asset Covered Corporate Commercial Public Sector Total
Backed Bonds Bonds Paper Securities
-50000 Securities
Mar-May Jun-Jul Aug-Sep Oct-Nov
In € millions OAS spread 22bd of February 2020 vs 14th of December 2020
2020. We had the revision of CRR, the postponement of the stress tests, the confir-
mation that the ECB would not block AT1 coupon payments. In a word, financial cred-
itors have been cocooned while equity holders have been put to contribution. We
think this trend will go-on in 2021 despite the deterioration in asset quality, hence we
keep a neutral stance on financials versus non-financials.
We take moderate risk favouring AT1, hybrids and BBs.
In IG, the potential for tighter spreads remains but it will be challenged by rating
migration. Almost 1/3 of BBB- rated names are on negative outlook, although the very
rapid pace of the recovery should reassure rating agencies, hence we favour BBB
over single As.
In HY, we think the market will outperform, led by the safest compartments namely
the BBs and most solid single-Bs as the idiosyncratic risk will remain elevated until
we have more certainties on the default outlook.
We continue to favour sub- But our favourite risk enhancement alternative remains subordinated bonds, both
ordination risk to credit risk, AT1 and corporate hybrids as we think both extension and coupon risk will remain
across financials and non-fi- low in 2021, while they keep yielding more than similar rated senior instruments.
nancials
Within IG, we keep a cyclical bias and prefer to take risk in defensive sectors via the
hybrids, while we remain more prudent in HY assessing each credit carefully.
Elisa Belgacem
+33 (0) 1 58 38 17 9715 | Generali Investments – Outlook 2021
EM sovereign bonds
The 2021 outlook for EM sovereign bonds has turned more positive supported by a low real yield environment and better
growth prospects. EMs are in a sweet spot and we expect spread to compress further to reach 285bp by year-end.
The rise of long-term US rates is one of the main risks while EM IG valuations are stretched. We favour EM HY, more
specifically the BB bucket.
EMs are still in a default cycle and selection is of utmost importance. HY dispersion will remain high given the hetero-
genous fiscal risk and further downgrades. Likewise, Covid management and vaccine rollout will be differentiating fac-
tors.
After a chaotic year, the EM environment has decisively improved over the past
weeks and EM sovereign bond index will, fortunately, post positive return in 2020,
with most of it coming again from the duration component. Our view for 2021 has
turned more positive and given the risk related to a rise of long-term US rates, we
expect the carry to provide most of the return in 2021. We will expect the EM US index
to compress by 285 bps by year-end, leading to a c. 5.2% total return.
Graph 1: EM SOVEREIGN BONDS IN A SWEET SPOIT Graph 2: EM BB IS CHEAP HISTORICALLY
% since 2010
3.5 % 60 100
3.0 90
55
2.5 80
2.0 70
50
1.5 60
1.0 45
50
0.5
40 40
0.0
30
-0.5
35
20
-1.0
-1.5 30 10
07/05 07/07 07/09 07/11 07/13 07/15 07/17 07/19 0
EURO IG US IG EM IG EM BBB EURO US HY EM B EM USD EM HY EM BB
10Y US real yield Global manufacturing PMI (rhs) HY
Percentile, OAS
In a sweet spot!
The better environment will EM sovereign bonds are currently in a sweet spot, supported by low US real yields
allow further spread com- and high PMIs like in 2013. Moreover, the double shots providing by the US elections
pression. Spreads will not and the vaccine are providing an anchor for EMs. Firstly, the Biden victory is the best
go back to their lows given outcome for EM as it will likely mean a less confrontational US geopolitics and a con-
the fundamental changes tained fiscal stimulus. For sure, a large US fiscal package would have meant a
due to the Covid stronger global growth, but it would have been translated into much higher US rates
that are detrimental for EM sovereign bonds. Secondly, the vaccine positive news flow
has helped EM investors to look through the slowdown in the growth recovery and
the EM debt overhang.
Within this supportive environment, growth normalisation and hunt for yields will
allow further spread compression. Valuations are not stretched for EM sovereign
bonds despite the rally of late. Arguably, the higher EM debt-to-GDP inherited from
the Covid crisis is requiring a premium and so we do not expect EM spreads to revisit
their decade lows. However, it remains that EM sovereign spreads have retraced sig-
nificantly less than other credit indexes: EM USD index is now at its 38th percentile
while EM HY index is even higher at its 57th percentile. Moreover, the BoFA EM USD16 | Generali Investments – Outlook 2021
index includes less distressed names and EM cheapness is even more striking when
looking at the JP Morgan EMBIGD index.
Mind the US rate rise! EM HY in the best position
The expected rise of the US Treasury rate will cap the total return and will pressure
EM HY valuation is less duration, especially the low yielders. Thus, within the EM space, we will favour EM HY
stretched and offers more over EM IG in 2021. Even if on a global basis, EM sovereign index is not expensive,
protection to a US rate rise EM IG has already compressed, and it is close to its all-time lows and its duration is
higher than the EM HY one. Thus, EM IG will offer a limited buffer to a rise of US rates.
If we assume a rise of the 10Y US rate to 1.20%, it will be difficult for EM IG to
surpass a 3-4% return. For EM HY, we expect a 60bp spread compression which will
lead the EM IG-HY spread in the middle of the cycle range. It will provide a total return
close to 10%. A higher total return seems unlikely: EM HY spread will not go back to
its lows in our view, given the fundamental changes which have taken place with the
Covid and the risk of further rating downgrades.
The normalisation of EM HY issuance should have limited impact on spreads. We
will expect EM HY issuance to gradually normalise in 2021 and it could reach 40% of
total issuance, just below its post-GFC average. However, net issuance will decline
substantially, and it will be at its lowest level since 2015.
Selection is the name of the game: focus on EM BB
Given the rising risk of short-term fiscal crisis for the weakest names, we focus on
the BB bucket which has been lagging during the recovery rally, and we will be very
selective. Dispersion at the index level could decline, essentially driven by IG names
which will be uniformly impacted by the US rate rise. However, it should remain high
across HY given the heterogeneous funding needs and fiscal spaces.
Dispersion to remain high The Covid crisis has created scars across EM sovereigns with fiscal deficits ex-
given fiscal risks. EMs are pected to reach 10.7% of GDP in 2020 (+5.6pp) and debt to reach 72% in 2025. Long-
still in a default cycle and so term debt sustainability is not under threat globally but there is a large increase in the
we favour EM BB risk of fiscal crisis over the short and medium-term due to the large funding needs.
Consequently, defaults/restructurations represented 9% of the assets in 2020 and
even if it is expected to decline, it will likely remain above its long-term average. That
said, the EM outlook is not so gloomy and homogenous. The IMF is not pushing for
an austerian approach and is even calling for more fiscal support to ensure a resilient
recovery. Moreover, EMs are in a better position to withstand the shock than in the
past with better external balances.
At the BB level, we will avoid South Africa and Brazil which are facing challenging
long-term debt sustainability. In the 10Y sector, Oman is relatively cheap. It suffers
from a deteriorating debt profile but the required primary balance for debt sustaina-
bility is low. Paraguay and Romania remain attractive.
In the IG space, we like GCC names, especially in the 30Y sector, which could ben-
efit from strong crossover and Asian insurer demand and higher oil prices. In the BBB
sector, Peru, despite political jitters, offers strong macro fundamentals and rating is
not at risk. Moreover, almost half of the index saw a rating downgrade in 2020 and it
can continue as 60% of the index is under a negative outlook. In our view, Colombia
is the most at risk of becoming a fallen angel, in a lesser extent Mexico while in Ro-
mania recent elections provided a relief.
Vaccine rollout will be a dif- Finally, Covid management will remain a differentiating factor. Vaccine rollout will
ferentiating factor be more difficult than in DM and should not happen before H2. Weakest countries
with less efficient government/high level of corruption will likely underperform. Upper-
income countries (Singapore, the UAE) or vaccine makers (China, Russia) will over-
perform. EM HY could also extensively benefit from the vaccine, especially commod-
ity exporters thanks to the recovery.
Guillaume Tresca
+33 (0) 1 58 38 17 5617 | Generali Investments – Outlook 2021
Currencies
Even after its recent leg lower, we expect more USD weakness amid a global reflationary rebound from the pandemic
and less erratic US policies. A sizeable US twin deficit and an eroded yield advantage add to the headwinds.
The EUR/USD is headed to advance further to 1.25 and beyond, helped by EMU progress and capital inflows (C/A sur-
plus, recovering net FDI). With the ECB continuing to eschew further depo rate cuts, its tools to stop the euro’s ascent
seem blunt.
With rates differentiation largely blurred by global monetary accommodation, balance of payment metrics will continue
to play a bigger role, underpinning a rising JPY and keeping a lid on CHF weakness in the cyclical recovery.
We see opportunities in cyclical currencies incl. Scandis (NOK, SEK) and EM FX (e.g. MXN).
The USD enjoyed strong demand amid the peak of the Covid-19 sell-off in March,
but has since reversed sharply, with the trade-weighted USD down 3.2% year-to-date
(Dec 13). Yet the USD still looks moderately dear and the underlying forces driving its
reversal have not yet run their course. The USD is an anticyclical currency that tends
Global recovery and easing to weaken amid global recoveries. The easing of global lockdowns on broader vac-
policy uncertainty to weigh cination efforts will weigh further on the greenback amid the economic upswing. Sim-
on the anti-cyclical USD ilarly, Trump’s trade war against China and allies alike was another USD support.
While new President Biden will maintain a tough stance on China, his trade policies
will be more predictable and less erosive to multinational institutions incl. the WTO.
Easing policy uncertainties will thus drive the USD further down (Graph 1).
Graph 1: USD REVERSAL ON EASING POLICY UNCERTAINTY Graph 2: USD - DOWN BUT NOT CHEAP
450 130
400 election of 130
Trump as 120
US President
350 Nov 2016
110
300 125
250 100
200 120 90
150
80
100 115
70
50
0 110 60
06/16 12/16 06/17 12/17 06/18 12/18 06/19 12/19 06/20 12/20 01/96 05/99 09/02 01/06 05/09 09/12 01/16 05/19
USD TWI (BIS, broad nom.)
Global uncertainty index Effective broad USD (index, nom., BIS) (rhs)
USD DXY
Eroded US yields weighing on USD
These forces are compounded by the US current account deficit of more than 3%
of GDP and high fiscal borrowing needs. For many years, the US were able to attract
The USD needs to weaken capital inflows thanks to a solid yield advantage over other advanced economies. With
to attract capital inflows this advantage eroded – likely for years – in particular at the short end of the curve
amid an eroded yield ad- and the USD still dear, investors will require a discount on the exchange rate – as
vantage and continued re- visible more generally for the G10 space (Graph 4). Meanwhile, a less appealing yield
serves diversification and concerns about the weaponization of dollar dominance as a geopolitical tool will
encourage global reserve managers to diversify their holdings further out of the USD.
Conversely, there is more upside to the still cheap EUR. Net foreign direct invest-
ments have turned positive, complementing capital inflows on the EMU’s persistently
high C/A surplus. Stubbornly low inflation will require strong policy accommodation
by the ECB for years. While the monetary expansion tends to weigh on the exchange18 | Generali Investments – Outlook 2021
rate, the case is slightly different for the EUR. The ECB’s APP and PEPP ensure the
purchase of government bonds for years, while progress on fiscal risk sharing (incl.
Political progress in the the Recovery Fund and progress towards a banking union) is helping to ease worries
euro area and continued about Southern European debt. The ECB is keeping an eye on the stronger euro. But
capital inflows will underpin as long as it eschews a further deposit rate cut, its tools to lean against further euro
the euro strength are blunt. Indeed, the easing of EMU worries on the release of this year’s
PEPP program has supported tighter peripheral spreads and the euro’s rise. Overall,
we thus see further upside to the EUR/USD, which is likely to rise beyond 1.25 in
2021.
Opportunities in Scandis and EMs
The fate of GBP remains closely tied to the outcome of Brexit negotiations, which
hang in the balance at the time of writing after repeated deadline extensions. A thin
last-minute deal would moderately boost GBP (with EUR/GBP moving towards 0.87),
while an elevated C/A deficit and eroded yield advantage will keep a lid on sterling.
Outcome of Brexit talks piv- By contrast, a chaotic no-deal departure would entail sizeable GBP downside, with
otal for GBP, but fundamen- EUR/GBP likely to pass 0.95. Gradually rising yields and the rollout of vaccines will
tals do not look very com- dampen demand for the CHF, though the strong Swiss C/A surplus will keep CHF
pelling weakness very limited. Elsewhere in Europe, we see notable value in Scandis (SEK,
NOK). Even after a rebound, they still look cheap, tend to outperform in cyclical re-
coveries and exhibit a high (inverse) beta to USD weakness.
Graph 3: EUR BENEFITTING FROM EASING EMU DEBT WORRIES Graph 4: G10 EXCHANGE RATES AND CURRENT ACCOUNTS
300 1.02 8
280 1.04
Performance trade-weighted index, ytd in %
6 SEK
260 1.06
240 1.08 4 CHF
220 1.10
EUR
2 AUD
(7/12/2020)
200 1.12
JPY
180 1.14 CAD 0 NZD
-4 -2 0 2 4 6 8 10
160 1.16
-2
140 1.18 USD
120 1.20 GBP
-4
100 1.22 NOK
08/19 10/19 12/19 02/20 04/20 06/20 08/20 10/20 -6
10y spread Italy (in bps) EUR/USD (inv. scale, rhs) C/A balance 2020, in % of GDP (Oxford Econ.)
Despite a risk-friendly outlook, we see more upside for JPY. With the US having
turned into a low yielder, Japan‘s 3% C/A surplus and ebbing net-portfolio outflows
underpin the yen. Amid low Japanese inflation, more favourable Japanese real yields
will also support a lower USD/JPY, while the perspectives for EUR/JPY are flattish.
EM currencies have been lagging in this year’s risk rally. In parts, this is attributable
to significant rate cuts and even QE by EM central banks. Yet by historical standards,
many EM FX look cheap, incl. several high-yielding currencies. Global recoveries tend
to be supportive for EM FX. And the V-shape recovery of China and the likely moder-
ate further extension of CNY strength lends additional support also to commodity
exporting countries. We particularly like MXN, which is still relatively cheap, entails an
attractive carry of about 5% and may benefit further from less erratic US trade policy
under the new Biden administration.
Thomas Hempell
+49 (0)221 / 4203-502319 | Generali Investments – Outlook 2021
Equities
Equity markets extended their rally after the US elections, enjoying a collapse in volatility, good news on the
vaccine and continuing policy support. The latter will stay unchanged at least in the next months.
Low yields and recovering inflation expectations should back the extension of the equity overperformance vs
bonds. Lower policy uncertainty and a further (though incomplete) pullback in volatility will help, too.
Earnings will flow abundantly in the next two years: for the euro area (EA) we forecast profits to grow above
40% in 2021 and +14% in 2022, with risks on the upside.
Our models see high multiples to linger, resulting in 5%-to-10% total returns in the next year.
Under such conditions, Value and Cyclicals will continue to outperform. Overweight Japan, UK and EMs. Stay
neutral on EMU vs US short term (more upside for EMU in 12 months).
Equity markets rallied since March (+66% for MSCI World), benefitting from bold
policy action (monetary and fiscal one) and peaking contagions. The fiscal stimulus
achieved so far is in the range of 1.8 TN USD in Japan, 2.8 TN USD in the US, 2.1 TN
USD in Europe and 0.9 TN USD in China (source: BoFA). Adding the monetary one
we get a current total stimulus on GDP of 64% in Japan, 28% in the US, 21% in
Equity overperformance vs Europe and 8% in China. Overall, this is bolder and faster than what we have
bonds was supported by experienced during the GFC. The second wave Covid contagions in the summer
bold policy action, lower introduced renewed volatility but after the US elections markets prolonged the rally.
spreads and recovering in- This was due to a collapse in volatility (VIX) from 40 to 22, good news on the vaccine
flation expectations and continuing policy support. EMs, cyclicals and Value started to outperform (still
OW for us) and equity funds saw increasing inflows. We remain positive on equities
for the next 12 months, forecasting total returns of 5-10%, much higher than for fixed
income assets.
2021: lingering recovery triggers robust earnings growth
Looking ahead, earnings will flow abundantly in the next 2 years thanks to GDP
growth, higher capacity utilization and ROE and policy support. Our models suggest
Graph 1: EURO AREA: CAPACITY UTILIZATION AND ROE Graph 2: MSCI EMU EARNINGS
15 10 50
40
10
5 30
5 20
0 10
0
0
-5 -10
-5
-20
-10
-10 -30
-15 -40
-20 -15
-50
01/04 01/08 01/12 01/16 01/20 1997 2002 2007 2012 2017 2022
actual model * forecast *
Euro area: 1y change of cap.utilization ROE (abs. ch. yoy, rhs)
* forecast model based on GDP, wages, TW euro & world trade
12-month trailing EPS, in %yoy
that for the euro area (EA) we can expect profits to grow above 40% and +14% in
2021 and 2022, respectively, with risks on the upside (US +17% and 16%). 2019 lev-
els should be reached in mid-2022 for the EA and in 2021 for the US. EA earnings
recovery will lag that of the US due to the lower Technology (12% vs 29%) and higher20 | Generali Investments – Outlook 2021
financials (14% vs 10%) and energy (4% vs 2%) weights. Market multiples should
also remain high vs history. This is the natural consequence of lingering low real yields
and credit spreads and the expectations that they will remain so. Policy uncertainty is
also decreasing: US elections are behind us, EU progress towards economic support
continues and a hard Brexit has lower chance to materialize. Furthermore, we expect
Continuing low yields, pol- the market volatility to continue to slightly drift lower as the economic situation slowly
icy support and strong normalizes and financial conditions stay supportive.
earnings growth will back
the extension of equity out- This in turn should keep at bay the equity risk premium or possibly decrease it from
performance vs bonds current levels. Under such conditions, our models (target PE, DDM, 3-stage eps
growth model, Fed model) see high multiples (i.e. PE) to linger and indicate 5%-to-
10% total returns in the next year. Reality check: using the very long Shiller series of
risk premium for the US (in periods of low inflation) we get a better conclusion: a fair
value for the S&P500 of around 3,800 for the next year (scenario 3, GI, table above).
In sum, the low yield environment, recovering inflation expectations and the steepen-
ing of the US yield curve back the extension of the equity overperformance vs bonds.
the Biden policy - notwithstanding the lack of a unified government - will be more
“reflationary” than Trump’s one, inducing slightly higher US rates and a steeper yield
curve which will not represent a negative, as we forecast good earnings growth ahead,
but will promote instead a style rotation into cyclicals and value. The latter will con-
tinue outperforming Growth and defensives (shorter duration assets outperforming
longer duration ones).
Table 1: S&P 500: SCENARIO ANALYSIS Graph 3: S&P: VALUE INDICATOR
Current
US CAPE-based valuation (adj. for Real 10Y 4,500 4,500
10Y CPI EPS (e/p - 10y
inflation) Rate
real)
Scenario 1 (current input with consensus
0.83 1.20 -0.37 163.5 4.27 4,000 4,000
CPI & 12m fwd earnings)
Scenario 2 (consensus 12m fwd in 1 yr) 1.20 1.90 -0.70 192.6 5.03
3,500 3,500
Scenario 3 (GI 12m fwd in 1 year) 1.15 1.80 -0.65 185.0 4.83
Scenario 4 (downside macro scenario) 0.50 1.00 -0.50 115.0 3.00
3,000 3,000
Scenario 5 (upside macro scenario) 1.75 1.50 -0.15 211.8 5.53
2,500 2,500
using 20% of risk (SD) Scen. 1 Scen. 2 Scen. 3 Scen. 4 Scen. 5
Implied PE Trailing IBES 24.5 28.8 27.7 17.2 31.7
2,000 2,000
Avg S&P500 valuation 3,381 3,981 3,825 2,379 4,379
-7.1% 9.4% 5.1% -34.6% 20.3%
1,500 1,500
Note: Base risk scenario: using 20% of risk premium's stand. deviation (SD).
1,000 1,000
using 40% of risk (SD) Scen. 1 Scen. 2 Scen. 3 Scen. 4 Scen. 5
Implied PE Trailing IBES 22.0 25.9 24.9 15.5 28.5 500 500
Avg S&P500 valuation 3,035 3,574 3,433 2,135 3,930 01/00 01/03 01/06 01/09 01/12 01/15 01/18 01/21
-16.6% -1.8% -5.6% -41.3% 8.0%
Note: High risk scenario: using 40% of risk premium's stand. deviation (SD). Value indicator (12-m fwd earnings / 10-year yield) S&P 500
Valuations are coherent to the risk over the last century
Stay OW EMs, Japan, UK, Value and cyclicals. Aligned US vs EMU
We maintain our preference for Value and Cyclicals sectors and countries. Looking
to the Value sectors, we see relatively strong earnings momentum vs the market. This
We see TRs of 5%-10% in is the case for financials, energy and materials, in particular; less so for industrials.
12 months: keep cyclical Our quant models still see a huge undervaluation for Value but not so much for cycli-
and value bias cals, such as capital goods or commercial & professional services. For this reason,
we bring a small modification to our European portfolio, lowering capital goods (KG)
from OW to N and putting only half of the money we get from KG into banks. The
latter looks particularly vigorous in terms of relative earnings momentum, so we de-
cided to go beyond the neutral position, trying not to raise further our risk exposure
after the rally. OW: Financials, food retail, semis, materials and software. UW: media,
TCM, transportation, and HPP.
As for countries, our OWs are UK (lower hard Brexit risks and deep relative under-
valuation), Japan and EM. EMU could outperform the US in 12 months. But, for theYou can also read