ACUTE SYMPTOMATIC SEIZURES - CLINICAL AND EXPERIMENTAL STUDIES - DIVA
←
→
Page content transcription
If your browser does not render page correctly, please read the page content below
Digital Comprehensive Summaries of Uppsala Dissertations
                from the Faculty of Medicine 1298

                Acute Symptomatic Seizures
                Clinical and Experimental Studies

                IMAD HALAWA

    ACTA
UNIVERSITATIS
 UPSALIENSIS    ISSN 1651-6206
                ISBN 978-91-554-9812-2
  UPPSALA       urn:nbn:se:uu:diva-314770
    2017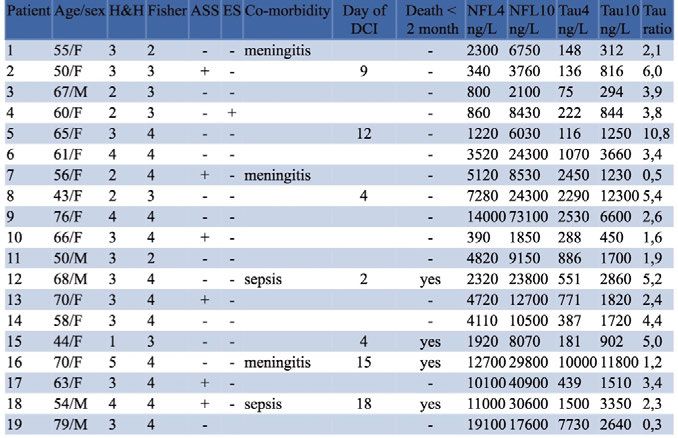
Dissertation presented at Uppsala University to be publicly examined in Gunnesalen i
Psykiatrins hus, Akademiska sjukhusets kärnområde, Psykiatrins hus, Ingång 10, 751 85,
Uppsala, Friday, 24 March 2017 at 13:00 for the degree of Doctor of Philosophy (Faculty of
Medicine). The examination will be conducted in English. Faculty examiner: Professor Guido
Rubboli (Danish epilepsy center, Filadelfia/University of Copenhagen, Dianalund, Denmark).

Abstract
Halawa, I. 2017. Acute Symptomatic Seizures. Clinical and Experimental Studies. Digital
Comprehensive Summaries of Uppsala Dissertations from the Faculty of Medicine 1298.
52 pp. Uppsala: Acta Universitatis Upsaliensis. ISBN 978-91-554-9812-2.

Epilepsy is defined as a condition with recurrent unprovoked seizures. When seizures are
believed to be provoked they fall into another category of situation-related seizures, i.e. acute
symptomatic seizures (ASS). The definition of ASS is a clinical seizure occurring in close
temporal relationship with an acute insult in the central nervous system (CNS), which may
be metabolic, toxic, structural, infectious or inflammatory. The prognosis after unprovoked
seizures and ASS differs with regard to risk of seizure recurrence and mortality.
   This thesis focuses on seizures occurring in relation to common dysmetabolic conditions and
subarachnoid haemorrhage (SAH). Specifically, the occurrence of ASS in patients with different
levels of hyponatraemia and hypoglycaemia was studied. Furthermore an experimental study in
rodents was conducted to explore the relationship between chemically induced status epilepticus
(SE) and hyponatraemia. In addition, seizures in relation to acute SAH were recorded and related
to appearance of development of delayed cerebral ischemia (DCI). Finally, measurement of
neurofilament light (NFL) and tau in the cerebrospinal fluid (CSF) was performed.
   In a large number of patients with hyponatremia a gradual increase (2.5 % – 11 %) in
risk of seizures with declining sodium levels was noted. Seizures were the only neurologic
manifestation of hyponatraemia in patients with moderately decreased sodium levels (> 115
mM).
   In a study of patients with hypoglycaemia, a notably low risk for seizures was found. Absolute
risk for neurological symptoms at glucose < 2.0 mM (95% CI) was 0.25 (0.13-0.41). This is a
finding of potentially great clinical relevance, since seizures in the presence of hypoglycaemia
are often presumed to be acutely symptomatic.
   In the animal study of acute hyponatraemia on kainic acid (KA) induced status epilepticus
(SE) the hyponatraemic animals displayed an increased frequency of epileptiform activity
and had longer duration of seizures. These results support the clinical observations that
hyponatraemia aggravates SE.
   In the study of patients with SAH seizures were frequent (36% of all patients) but did not
predict the development of DCI. Measurement of the CSF biomarker tau at different time points
revealed increased tau concentration between days 4 and 10, and may be associated with DCI.

Keywords: Seizure.

Imad Halawa, Department of Neuroscience, Neurology, Akademiska sjukhuset, Uppsala
University, SE-75185 Uppsala, Sweden.

© Imad Halawa 2017

ISSN 1651-6206
ISBN 978-91-554-9812-2
urn:nbn:se:uu:diva-314770 (http://urn.kb.se/resolve?urn=urn:nbn:se:uu:diva-314770)
To my mother and the soul of my father
List of Papers

This thesis is based on the following papers, which are referred to in the text
by their Roman numerals.

  I.    Halawa I, Andersson T, Tomson T. Hyponatremia and risk of sei-
        zures: a retrospective cross-sectional study. Epilepsia, 2011
        Feb;52(2):410-3.

 II.    Halawa I, Zelano J, Kumlien E. Hypoglycemia and risk of seizures:
        a retrospective cross- sectional study. Seizure, 2015 Feb;25:147-49.

III.    Zelano J, Halawa I, Clausen F, Kumlien E. Hyponatremia augments
        kainic acid-induced status epilepticus in the mouse: a model for
        dysmetabolic status epilepticus. Epilepsy Res. 2013 Sep;106(1-
        2):29-34.

IV.     Halawa I, Vlachogiannis P, Amandusson Å, Elf K, Ronne-
        Engström E, Zetterberg H, Kumlien E. Epileptic seizures and CSF
        concentrations of neurofilament light and tau proteins in patients
        with subarachnoid haemorrhage. Manuscript.

Reprints were made with permission from the respective publishers.
Contents Introduction ................................................................................................... 11 Acute symptomatic seizure ....................................................................... 11 Epidemiology............................................................................................ 12 Causes of acute symptomatic seizures...................................................... 12 Specific causes of acute symptomatic seizures ........................................ 12 ASS in association with hyponatraemia and hypoglycaemia .................... 14 Hyponatraemia and status epilepticus ...................................................... 15 Hypoglycaemia and seizures .................................................................... 15 Status epilepticus ...................................................................................... 16 Animal models of status epilepticus (SE)................................................. 16 Subarachnoid haemorrhage ...................................................................... 17 Delayed cerebral ischemia ........................................................................ 17 Seizures in SAH........................................................................................ 18 Biomarkers in brain injury – neurofilament light and tau ........................ 19 Prognosis and treatment of ASS ................................................................... 20 Aim of the thesis ........................................................................................... 21 Materials and methods .................................................................................. 22 Design and setting (paper I and II) ........................................................... 22 Patient and data collection (paper I and II)............................................... 22 Animal and data collection (paper III) ..................................................... 23 Patient and data collection (IV) ................................................................ 24 Statistical methods .................................................................................... 25 Ethics ........................................................................................................ 26 Results ........................................................................................................... 27 Paper I ....................................................................................................... 27 Paper II ..................................................................................................... 28 Paper III .................................................................................................... 29 Paper IV .................................................................................................... 33 Discussion ..................................................................................................... 36 Hyponatraemia and risk of seizures.......................................................... 36 Hypoglycaemia and risk of ASS .............................................................. 37 Hyponatraemia and SE ............................................................................. 37
Acute symptomatic seizures in SAH ........................................................ 38
    Biomarkers in SAH .................................................................................. 38
    Limitations ................................................................................................ 39
Conclusions ................................................................................................... 41
Future directions ............................................................................................ 42
Summary in Swedish/ Populärvetenskaplig sammanfattning ...................... 43
Acknowledgement ......................................................................................... 45
  Financial support ...................................................................................... 46
References ..................................................................................................... 47
Abbreviations ASS Acute Symptomatic Seizures aEEG Amplitude-integrated EEG CA Cardiac Arrest CI Confidence Intervals CNS Central Nervous System cEEG Continuous EEG CSF Cerebrospinal Fluid CT Computed Tomography EVD External Ventricular Drainage DM Diabetes Mellitus DDAVP 1-deamino-8-D-arginine vasopressin EEG Electroencephalography ES Electrographic seizure GCSE Generalised convulsive status epilepticus ICP Intracranial Pressure ILAE International League Against Epilepsy KA Kainic acid MRA Magnetic Resonance Angioagraphy MRI Magnetic Resonance Imaging NFL Neurofilament light NCS Nonconvulsive seizure NICU Neuro-intensive Care Unit SE Status Epilepticus TBI Traumatic Brain Injury TCD Transcranial Doppler SAH Subarachnoid haemorrhage NFL Neurofilament light
Introduction

Epilepsy is a common disorder, occurring in all countries and all age groups.
When a person has an epileptic seizure it is often believed that he or she
suffers from epilepsy. However, epilepsy is defined as a condition with re-
current, unprovoked seizures. In the most recently updated definition of epi-
lepsy according to the ILAE, epilepsy is a disease of the brain defined by
any of the following conditions: (1) at least two unprovoked (or reflex) sei-
zures occurring >24 h apart; (2) one unprovoked (or reflex) seizure and a
probability of further seizures similar to the general recurrence risk (at least
60%) after two unprovoked seizures, occurring over the next 10 years; (3)
diagnosis of an epilepsy syndrome.[1]
   Epilepsy is classified according to underlying cause; genetic, structur-
al/metabolic or unknown. Seizures are dichotomised into those that are gen-
eralised and originating at some point within the brain, and rapidly engaging,
bilaterally distributed networks. Focal seizures, on the other hand, are be-
lieved to originate within networks limited to one hemisphere.
   When seizures are assumed to be provoked, they fall into another catego-
ry termed situation-related seizures,[2] and the medical investigation, treat-
ment and prognosis of these seizures differs considerably from those of un-
provoked seizures.

Acute symptomatic seizure
Acute symptomatic seizure (ASS), which is also known as reactive seizure,
provoked seizure or situation-related seizure, is defined by the International
League against Epilepsy (ILAE) as a clinical seizure occurring in close tem-
poral relationship with an acute central nervous system (CNS) insult, which
may be metabolic, toxic, structural, infectious or inflammatory[2]. Quite
surprisingly, despite its clinical relevance, ASS has received very little atten-
tion in the scientific literature.
   The prognosis after unprovoked seizures and ASS differs with regard to
the risk of seizure recurrence and mortality; therefore, it is essential to define
the underlying conditions in which acute symptomatic seizures occur.[3]

                                                                               11
Epidemiology
There are few epidemiological studies on the incidence of acute symptomat-
ic seizures. When reported the incidence is 29-39 per 100 000 a year[4, 5].
Acute symptomatic seizures represent about 40% of all afebrile seizures[6].
An age-specific incidence of ASS has been found in different studies,[4,
7] with the first year of life accounting for the highest incidence by far. The
incidence then declines and reaches a nadir of 15 per 100 000 persons/year at
22–34 years of age. After 35, the incidence increases progressively and
reaches 123 per 100 000 persons/year among persons older than 75 years of
age[4, 5].
The risk of experiencing an acute symptomatic seizure during an 80-year
life span is 3.6%, which approaches the risk for epilepsy[8]. The prevalence
of a history of ASS is somewhat lower than the cumulative incidence be-
cause of the high mortality rate associated with many of the causes of ASS
Causes of acute symptomatic seizures
Acute symptomatic seizures can be associated with a primary brain insult or
systemic disturbance. It has been suggested that ASS are events occurring
within one week of stroke, traumatic brain injury, anoxic encephalopathy or
intracranial surgery. Symptomatic seizures also can occur at first identifica-
tion of subdural hematoma, in the presence of an active central nervous sys-
tem (CNS) infection, or during an active phase of multiple sclerosis or other
autoimmune diseases. In addition, ASS may appear in the presence of severe
metabolic derangements (documented within 24 h by specific biochemical or
haematologic abnormalities), drug or alcohol intoxication or withdrawal or
exposure to a well-defined epileptogenic drug [2].
Specific causes of acute symptomatic seizures
Cerebrovascular lesions
Between 5-10% of individuals with a stroke experience a seizure within one
week of an acute stroke. The frequency varies with the nature of stroke, with
a higher incidence observed in haemorrhagic stroke, younger patients and
individuals presenting with higher pre-stroke Rankin scores. Subarachnoid
and intracerebral haemorrhages are also risk factors for ASS [9, 10].
12Traumatic brain injury (TBI)
Severe concussion can be accompanied by brief convulsive movements[11].
The occurrence of seizures has been reported in up to 6% of patients who
experience a traumatic brain injury (TBI)[12-14].
Encephalopathy
Cardiac arrest (CA), respiratory failure, carbon monoxide poisoning or other
causes of hypoxic encephalopathy may provoke acute seizures within one
week. A subgroup of patients who suffers from CA develops post anoxic
status epilepticus, which is associated with poor outcome[15].
Cerebral infections and inflammatory-immune conditions
Acute symptomatic seizures occurring within 7 days of an acute CNS infec-
tion affect 2-67% of patients with encephalitis[16]. Evidence for ASS occur-
ring in the context of autoimmune encephalitis is increasing[17-19]. Seizures
in relation to encephalitis are probably underestimated because non-
convulsive seizures and status epilepticus are difficult to diagnose in con-
fused or comatose patients.
Drug withdrawal and toxic insults
Abstinence seizures in patients who abuse alcohol, benzodiazepines or relat-
ed sedative drugs are not uncommon, especially in adolescents and
adults[20-22]. Indicators of ASS associated with alcohol withdrawal are a
history of abuse and generalised tonic-clonic seizures with other symptoms
of withdrawal, such as tremors, sweats and tachycardia. The seizure must
have occurred within 7-48 h of the last drink. Some neuroactive medications
and illicit drugs may also provoke seizures[23, 24].
Metabolic derangements
Metabolic abnormalities are commonly encountered in clinical daily prac-
tice. The neurological manifestations reflect the severity of the derangement
and require correct diagnosis for emergency treatment of the underlying
metabolic disturbance. Acute and severe electrolyte imbalances can exhibit
with progressive neurological symptoms including seizures and have been
reported in patients with hyponatraemia, hypocalcaemia and hypomag-
nesaemia[25]. Severe low blood glucose is a medical emergency condition.
It can cause a variety of symptoms including confusion, loss of conscious-
ness and seizures[26]. Hyperglycaemia has also been recognised in associa-
tion with seizures[27].
ASS has also been reported in connection with uraemia due to renal fail-
ure and in other rare causes including thyrotoxic storm and porphyria[28].
Cut off values for metabolic disorders where seizures should be consid-
ered acutely symptomatic rather than unprovoked are based, at best, on case
13studies[25]. There are few systemic studies that provide a definite value for each metabolic disorder. However, the Epidemiology Commission of the ILAE has suggested guidelines and proposed cut off values for acute sei- zures to be considered as ASS. These values are presented in the following table[2]: Table 1. Cut off values for metabolic disorders and risk of seizures. Biochemical parameter Value S-glucose
The condition can arise for several reasons, including administration of
drugs such as desmopressin[40] and diuretics, tricyclic antidepressants and
serotonin reuptake inhibitors and side effects from antiepileptic drug treat-
ment [41]. Acute onset hyponatraemia is particularly common in patients
who have undergone any type of brain insult, including traumatic brain inju-
ry, subarachnoid haemorrhage and brain tumours, and is a frequent compli-
cation of all kinds of intracranial procedures. Polydipsia, commonly seen in
patients with psychiatric disorders, is another cause of hyponatraemia with
risk of seizures.

Hyponatraemia and status epilepticus
Hyponatraemia is significantly associated with status epilepticus (SE) refrac-
tory to treatment, indicating the importance of studies on this particular
dysmetabolic condition[42]. There is little experimental data on SE in hypo-
natraemia. Seizures in hyponatraemia have been studied mostly in the con-
text of seizure thresholds or very severe hyponatraemia causing brain oede-
ma, herniation and death. Hypotonic hyponatraemia is known to reduce the
threshold for electrically induced seizures[43, 44], as well as chemically
induced seizures in relation to renal failure[45]. However, these studies have
not clarified the effect of hyponatraemia on SE severity or duration. Little is
known about appropriate treatment strategies for SE and co-existing hypo-
natraemia.

Hypoglycaemia and seizures
Clinical hypoglycaemia is, by definition, a plasma concentration low enough
to cause symptoms or signs including impairment of brain function[46].
Neuroglycopaenic symptoms are a direct result of brain glucose deprivation.
Systemic glucose balance is normally maintained by regulation of endoge-
nous glucose production from the liver and kidneys and of glucose utilisation
by tissue outside the CNS like muscle.
   Under normal conditions, glucose is the exclusive fuel for the brain. Un-
like other organs, the brain cannot synthesise glucose or utilise physiologic
concentrations of non-glucose fuels effectively.
   When the brain receives insufficient glucose to meet its metabolic needs
(neuroglycopaenia), an autonomic response is triggered to mobilise storage
deposits of glycogen and fat. Hepatic glycogen reserves and gluconeogenesis
from the liver and kidney directly supply the central nervous system with
glucose, while the mobilisation of fatty acids from triglyceride depots pro-
vides energy for the large mass of skeletal and cardiac muscle, renal cortex,
liver and other tissues that utilise fatty acids as their basic fuel, thus sparing
glucose for use by the tissues of the central nervous system[47]. Symptoms

                                                                               15
include cognitive impairments, behavioural changes, psychomotor abnor- malities, seizures and coma. Hypoglycaemia is common in patients with diabetes. Hypoglycaemia is a fact of life for many persons with diabetes mellitus type 1 (T1DM). The aver- age patient with T1DM suffers two episodes of symptomatic hypoglycaemia per week, thousands of such episodes over a lifetime, and one episode of temporarily disabling hypoglycaemia, often with seizure or coma, per year. An estimated 2–4% of people with T1DM die from hypoglycaemia [46, 48]. Status epilepticus Status epilepticus (SE) is a frequent neurological emergency with case fatali- ty rates ranging from 7.6 to 39% in population-based studies[49-51]. Several independent predictors of poor outcome have been recognised, including advanced age, de novo presentation, impairment of consciousness before treatment and seizure type, but the most critical factor by far is the underly- ing aetiology[52]. Although much attention has been paid to cessation of seizures by administration of different antiepileptic drugs (AED), it is far more critical to treat the underlying aetiology. Indeed, some aetiologies such as stroke, severe metabolic disturbances, alcohol withdrawal or intoxication, brain tumour–related events and infections need emergent and specific treatments beyond seizure medication[53]. A recently published definition states that SE is a condition with a pro- longed seizure that might lead to long-term consequences including neuronal death, neuronal injury and alteration of neuronal networks, depending on type and duration of SE. The time when the seizure is likely to be prolonged leading to continuous seizure activity is dependent on seizure type, but in most cases > 5 minutes. Long-term consequences are likely to appear if sei- zure duration exceeds 30 minutes. Animal models of status epilepticus (SE) Comprehension of the complex mechanisms underlying seizure generation cannot be fully acquired in clinical studies with humans. As a result, the use of appropriate animal models is essential. Kainic acid (KA) was one of the first compounds used to model epilepsy in rodents[54]. It is an L-glutamate analogue, the systemic or intracerebral administration of which causes neu- ronal depolarisation and seizures. There are several models of SE. Among the simpler ones are KA-induced seizures, which have the advantage of not requiring a kindling setup. Kainic acid is comparably easy to control, robust in the induction of SE and has an increased survival rate, which reduces var- iability.[55] 16
Subarachnoid haemorrhage
Subarachnoid haemorrhage (SAH) is a severe condition with high morbidity
and mortality with an incidence of 9 per 100 000[56]. The signs and symp-
toms of SAH range from subtle prodromal events to severe and sudden
headache[57]. The headache is often associated with nausea, vomiting, focal
neurological deficits and meningism[58]. Altered level of consciousness is
found in many patients. Diagnosis of SAH is best performed by a head com-
puted tomography (CT) scan[59, 60]. Lumbar puncture (LP) is obligatory if
the CT is negative and there is a strong suspicion of SAH[60, 61]. Typical
findings in SAH are elevated opening intracranial pressure (ICP) and an
increased red blood cell count. Spectrophotometry can detect products from
the haemoglobin catabolism; oxyhaemoglobin, methaemoglobin and biliru-
bin.

Delayed cerebral ischemia
The most devastating complication of SAH is delayed cerebral ischemia
(DCI). DCI is defined as new focal or global neurological deficits and/or
new cerebral infarction on computed tomography (CT) that is not caused by
rebleeding or acute hydrocephalus[62]. Signs of DCI occur in about 30% of
patients, typically appear between days 4 and 10 following SAH and are the
major causes of morbidity and death[63, 64]. The pathophysiology of DCI is
not fully understood. The mechanism is a complex of many factors but cere-
bral arterial vasospasm is thought to be a major contributing factor. Other
mechanisms, such as early cell death and the initiation of inflammatory reac-
tion[65], cortical spreading depolarisation[66] and dysfunction of cerebral
autoregulation[67, 68] probably play a major role.
    A major challenge in the management of SAH is early identification of
DCI, thereby enabling therapeutic interventions. Clinical deterioration at-
tributable to DCI is a diagnosis after exclusion of other causes (such as in-
fection, hypotension, hyponatraemia and others), and it is especially difficult
in patients who are comatose or sedated. Risk factors for developing DCI are
poor clinical status with a high grade on Hess and Hunt grading scale and
extent of bleeding (see Fischer scale).

Cerebral ischemia is best detected by clinical monitoring in combination
with Magnetic resonance imaging (MRI) (including diffusion-weighted im-
aging, angiography and perfusion), computed tomography (CT) (angi-
ography and perfusion), transcranial Doppler (TCD) and sometimes digital
subtraction angiography.[62, 69]

                                                                            17
Hunt and Hess grading scale
1 Asymptomatic, mild headache, slight nuchal rigidity
2 Moderate to severe headache, nuchal rigidity, no neurologic deficit
other than cranial nerve palsy
3 Drowsiness/confusion, mild focal neurologic deficit
4 Stupor, moderate-severe hemiparesis
5 Coma, decerebrate posturing
The Hunt & Hess grading scale was developed in 1968 as a clinical tool to predict
the outcome of SAH. Higher grade is considered to associate with severe out-
come[70, 71].
Fisher grading scale for SAH
1 No haemorrhage evident
2 Subarachnoid haemorrhage less than 1 mm thick
3 Subarachnoid haemorrhage more than 1 mm thick
4 Subarachnoid haemorrhage of any thickness with intra-ventricular
haemorrhage or parenchymal extension
The Fisher grading scale was developed in 1980 to predict cerebral vasospasm after
SAH by using the CT scans during 5 days of SAH. It means that localised clotting or
diffuse blood larger than 1 mm is predictive of cerebral vasospasm[72].
Seizures in SAH
Acute symptomatic seizures (ASS) have been reported to occur in 6-24% of
patients with SAH[73, 74]. Continuous electroencelography (cEEG) allows
monitoring of patients with acute aneurysmal subarachnoid haemorrhage for
detection of non-convulsive seizures and non-convulsive status epilepticus.
Both clinical and electrographic seizures (ES) are believed to have a nega-
tive impact on the outcome[75]. Continuous EEG has also been used for
surveillance and early recognition of DCI[76].
18Non-convulsive seizures
Nonconvulsive seizures (NCS) also known as subclinical seizure or electro-
graphic seizure (ES) are identified by continuous EEG monitoring. NCS are
common in comatose patients has been described in 8% to 30% of comatose
patients [75, 77, 78]. NCS is treatable and reversible condition and is consid-
ered to have a negative impact on the outcome in some neurological condi-
tions such as SAH [75].
While EEG is a non-invasive, and largely available test, it is limited by
the absence of a universally accepted classification system and by its suscep-
tibility to sedation and metabolic conditions [79, 80].
Criteria for definition of non-convulsive seizures in this thesis are abnor-
mal paroxysmal events that are lasting at least 10 seconds and are different
from the background, including spikes, sharp waves, or sharp-slow wave
complexes either at a frequency of at least 3 per second or, if lower, of at
least 1 per second and with clear evolution in frequency, morphology, or
location[81] [82].
Biomarkers in brain injury – neurofilament light and tau
A biomarker is a characteristic that is objectively measured and evaluated as
an indicator of normal biological processes, pathogenic processes or re-
sponses to a therapeutic intervention. Significant efforts have been made to
study different biomarkers as potential tools for predicting vasospasm and
outcome after SAH[83]. Biomarkers of neuronal and axonal damage can be
used to diagnose brain injury and predict clinical outcome. Cerebrospinal
fluid (CSF) markers are preferred, owing to their proximity to the brain.
Cerebrospinal fluid is in direct contact with the extracellular matrix of the
brain and reflects biochemical changes that occur in the brain. Cerebrospinal
fluid biomarkers that reflect neuronal damage have recently been studied.
Neurofilament light chain protein is a cytoskeletal constituent of interme-
diate filaments, and is thought to reflect neuronal and axonal injury when
appearing in the CSF. Tau is located in the nerve axons in the brain, prefera-
bly in thin non-myelinated cortical axons. Its function is to bind to microtu-
bules in axons and thereby stabilise these[84].
High concentrations of NFL and tau have been reported in the first days
after the initial injury in SAH and extending into the period of DCI, and
correlate with poor long-term outcome[85] [86].
NFL is a marker that reflects subcortical damage, while tau is more relat-
ed to cortical brain injury[84].
19Prognosis and treatment of ASS Seizures occurring as a consequence of metabolic imbalance or structural brain damage do not entail a diagnosis of epilepsy. Early identification of the aetiology of provoked seizures is necessary for correct management. Treat- ment of ASS differs from unprovoked seizures. Antiepileptic treatment may be needed in the acute phase, but is not usually needed in the long term. Acute symptomatic seizures are unlikely to reoccur unless the underlying acute causal condition reoccurs. The risk of subsequent epilepsy is increased in a subgroup of patients, especially in cases with associated cerebrovascular disorders, head injuries and central nervous system infection[87]. 20
Aim of the thesis

This thesis focuses on studies of occurrence and risks of acute symptomatic
seizures (ASS) in different clinical and experimental settings. The specific
aims are:

    ! To study the risk of seizures at different levels of hyponatraemia.

    ! To study the risk of seizures at different levels of hypoglycaemia.

    ! To explore whether kainic-induced status epilepticus in the mouse
      could be a suitable model for experiments on status epilepticus un-
      der acute hyponatraemia.

    ! To test the hypotheses that seizures are associated with poor out-
      come in patients with subarachnoid haemorrhage.

    ! To explore the association between CSF concentrations of neurofil-
      ament light (NFL) and tau and delayed cerebral ischemia as out-
      come.

                                                                            21
Materials and methods Design and setting (paper I and II) The design was retrospective, cross-sectional observational cohort study in both papers. To identify patients with hyponatraemia, the database of the Biochemical Laboratory at Gävle County Hospital in Sweden, serving a catchment area of approximately 170 000 inhabitants, was systematically searched within a 3- year period (March 2003 to August 2006). The study in paper II was performed at Uppsala University Hospital, which is an academic care centre serving a primary population of approxi- mately 300 000 people with 59 151 patient admissions per year. The data- base of the biochemical laboratory at the hospital was scrutinised for low blood glucose values for one year (January to December 2009). Patient and data collection (paper I and II) Identification of patients In paper I, a total of 363 individuals who had been admitted as inpatients to Gävle County Hospital and had their serum sodium level measured as part of routine hospital procedures were included. Serum sodium levels were cate- gorised as follows:
stroke, CNS infection, traumatic brain injury, anoxic encephalopathy or oth-
er lesions in the CNS). In total, 388 patients were included, and for each case
the corresponding medical records were scrutinised.

Data collection (paper I and II)
The variables recorded for the studies included age, gender, documented
comorbidity, seizure type (ILAE Commission, 1981) and timing, and other
abnormal biochemical and haematological values when available (e.g. glu-
cose, urea, sodium, calcium, magnesium, ammonia and creatinine) and de-
tected within 24 h of the seizure. All data were anonymised prior to analysis.

Animal and data collection (paper III)
Animals
Female mice C57/BL6 mice that were at least seven weeks old (acquired
from Taconic ®) were used. All mice were group housed, maintained on a
12-hour day/light circle and cared for according to current animal regula-
tions.

EEG sampling
Electroencephalography (EEG) was recorded using the cable-tethered PAL-
8200 system (Pinnacle Technology Inc., Lawrence, KA, USA). After anaes-
thesia and placement of epidural electrodes, the mice were treated with bu-
prenorphine for pain relief and allowed to recover for at least three days
prior to EEG recordings. The preamplifier setting was 100x, and the signal
was filtered at 40 Hz. The electrodes were placed according to the manufac-
turer’s instructions in six holes drilled through the skull to the dura (1.5 mm
lateral to the midline, 2 mm anterior, 2 mm posterior, and 5 mm posterior to
the Bregma). Three channels were recorded, which included ipsilaterally
from the left frontal area and bilaterally from the frontoparietal and occipital
areas. Hyponatraemia was induced by intraperitoneal injection of 1-
deamino-8-D-arginine vasopressin (DDAVP) at a dose of 0.5 ug/kg and
diluted in sterile water equivalent to 7.5% of the body weight, which was a
modification of the protocol described by Vajda[88]. For kainic acid treat-
ment, mice were intraperitoneally injected with 20 mg/kg kainic acid
(P6503, Sigma–Aldrich, Stockholm, Sweden).

Blood analysis
Blood analyses were performed immediately post-mortem using an i-Stat®
analyser (Abbot, Sweden). Animals were deeply sedated with an overdose of
isoflurane and decapitated. Arterial blood from the neck was immediately

                                                                             23
collected in test cartridges (GC8+). Electrolytes in six mice from each treat- ment group were analysed after the experiment. EEG analysis EEG recordings were scrutinised for spikes or seizure activity, which were defined as single, short events and high-frequency repetitive patterns, respec- tively, with amplitudes that exceeded the background activity by a factor of at least 2. Seizure activity was also considered present for the remainder of the first observation hour for two mice that died during SE in the first hour after KA treatment, but they were excluded from analysis in the observation hour after diazepam treatment. Patient and data collection (IV) The study was a prospective observational study. Patients with SAH admit- ted to the Neuro-Intensive Care Unit (NICU) at Uppsala University Hospital between July 2015 and July 2016 were consecutively included. The inclu- sion criterion was spontaneous SAH with an aneurysm treated with endovas- cular coiling. Exclusion criteria were surgical treatment of the aneurysm, a previous history of neurological disease including epilepsy and severe trau- matic brain injury. At admission, patients were evaluated clinically and investigated with CT including CT angiography. The severity of the clinical condition at admis- sion was graded according to Hunt and Hess grading scale[89]. The amount of bleeding in the first CT was graded according to the Fisher scale. Clinical seizures were systematically recorded and considered acute symptomatic if they appeared during the acute phase of the brain insult[2]. The patients were treated with neurointervention within the first 48 hours in order to eliminate the source of bleeding. The rest of the treatment was done according to our NICU protocols for SAH[90]. In summary, uncon- scious patients had artificial ventilation and an external ventricular drainage (EVD) in order to monitor and treat the intracranial pressure (ICP). Sedation was done with propofol and opioids. Nimodipine was administered intrave- nously or in the nasogastric tube. Delayed cerebral ischemia is used as a clinical diagnosis and was suspect- ed if there was an onset of new focal or global neurologic deficits or strokes not attributable to other causes. In addition to the clinical examination, DCI was also illustrated by methods including TCD, Xenon-CT and MRI. 24
EEG monitoring
Continuous EEG (cEEG) monitoring was started as soon as possible after
admission to the NICU, usually at the insertion of the EVD. Nine scalp disc
electrodes (ASYS Healthcare/Neuroline EEG) F3, T3, P3, O1, F4, T4, P4,
O2 and Cz were used. The first 72 hours recorded were analysed. Ampli-
tude-integrated EEG (aEEG) trend (based on F3, F4, P3, P4) was used for
seizure detection and all suspected seizures were verified or falsified using
the raw-EEG. Rhythmic or epileptiform activity with spatiotemporal evolu-
tion lasting for at least 10 seconds was regarded as electrographic seizure
activity[82]. One neurologist made a primary interpretation of the recordings
and two neurophysiologists subsequently made a second interpretation of the
suspected seizures.

Measurements of NFL and tau
Samples of 5 ml CSF were drawn from the EVD at days 4 and 10 after SAH.
The samples were mixed, centrifuged and immediately frozen to -800C. NFL
and tau protein concentrations were measured using commercial enzyme-
linked immunosorbent assays (NF-Light, UmanDiagnostics, Umeå, Sweden
and INNOTEST hTAU, Fujurebio, Ghent, Belgium) according to protocols
accredited by the Swedish Board for Accreditation and Conformity Assess-
ment (SWEDAC). The measurements were performed in one round of ex-
periments using one batch of reagents by board-certified laboratory techni-
cians who were blinded to clinical data. Intra-assay coefficients of variation
were below 10%.

Statistical methods
Odds ratios (ORs) with 95% confidence intervals (CIs) were estimated (us-
ing proc logistic in SAS 9.2 and 9.3; SAS Institute) for the occurrence of
seizures at the different predefined categories of serum sodium and glucose
levels.

In paper III, statistical tests were performed in GraphPad Prism©.

In paper IV data was analysed using SAS 9.4 software. Values of mean,
median and standard deviation were calculated. Tau ratio was calculated as
the ratio tau 10/tau 4. Cox regression analysis was performed using the pre-
dictor biomarkers (those included were H&H, ASS, ES, NFL 4, NFL 10,
tau4, tau10 and tau ratio). DCI was analysed as a dependent value.

                                                                           25
Ethics The studies (paper I, II, III and IV) were approved by local ethics commit- tees for human and animal research. 26
Results
Paper I
From the database 363 patients were found to have sodium levels 115 mM. Using
120 – 124 mM as reference odds ratios (95% CI) for having seizures was
calculated
Absolute risks for seizures at different levels of hyponatraemia are given
in Table 2. The point estimate of the OR increased with decreasing serum
sodium levels, although the confidence intervals (CIs) were wide and partly
overlapping.
The 11 patients with seizures and hyponatraemia constituted a very heter-
ogeneous group. Their clinical characteristics are summarised in Table 3. All
had comorbid conditions of different types, and 5 of the 11 had additional
metabolic derangements. The patient with seizures at the lowest serum sodi-
um level (104 mM) died.
Table 2. Absolute risk and odds ratio (OR) with 95% confidence interval (CI) for
having a seizure at different levels of hyponatraemia in relation to serum sodium
levels of 120–124 mM
Serum sodium Patients With Absolute risk OR (95% CI)
(mM) (n) seizure (95% CI)
(n)
120-124 150 1 0.0067 (0.0002–0.0366) Reference
115-119 120 3 0.0252 (0.0052–0.0719) 3.85 (0.40–37.53)
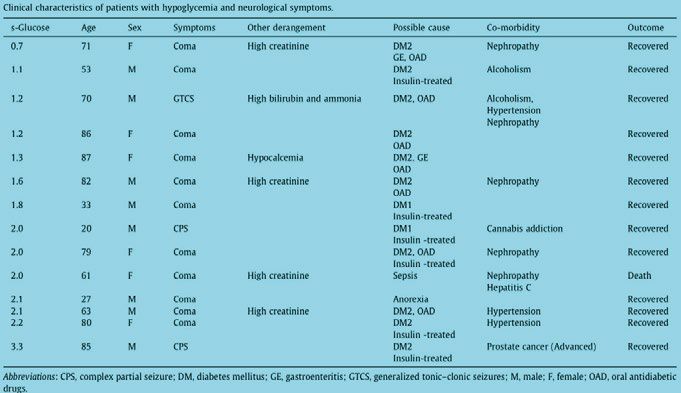
110-114 54 3 0.0536 (0.0112–0.1487) 8.43 (0.859–82.85)Table 3. Clinical characteristics of patients with hyponatraemia Paper II In total, 388 patients were included in the study. 14 patients had disturbances of consciousness, including 3 patients with seizures (see Table 4). Most cases were in the category of 0–2 mM glucose. The majority of cas- es experienced coma; a generalised tonic–clonic seizure was observed only when the s-glucose dropped below 2.0 mM (1.2 mM). Two cases with focal seizures were noted: the s-glucose levels in these patients were 2.0 mM and 3.3 mM respectively. The mean age of patients with neuroglycaemic symptoms was 54 years (range 20–87 years), and the mean age of patients without neuroglycaemic symptoms was 64 years (range 2–95 years). 12 out of 14 patients with neurological symptoms had diabetes mellitus and were treated with insulin alone or in combination with oral antidiabetic drugs. Comorbidity with alcoholism, severe illness such as nephropathy and terminal prostate cancer were contributing factors in the patients with sei- zures. 28
Table 4. Clinical characteristics of patients with hypoglycaemia and neurological
symptoms

The absolute risk for developing neurological hypoglycaemic symptoms,
including coma and seizures, was highest in the category 0–2.0 mM [0.25 CI
(0.13–0.41)] (Table 4.). The absolute risks were 0.02 CI (0–0.06) in the cat-
egory 2.1–3 mM and 0.01 (0–0.03) in the category 3.1–3.5 mM (see Table
5).

Table 5. Absolute risk with 95% confidence interval (CI) for neurological symp-
toms at different s-glucose levels.
Category    Patients with-   Patients with   Patients   Absolute     Confidence
mM          out symptoms     symptoms        in total   risk         Interval
                  n                n              n
0–2.0       30               10              40         0.25         0.13–0.41

2.1–3.0     151              3               154        0.02         0–0.06

3.1–3.5     193              1               194        0.01         0-0.03

Paper III
In this paper, we aimed to rapidly decrease the sodium concentrations in
animals to approximately 125–130 mmol/L. To this end, an injection of ster-
ile water with the addition of dDAVP to an equivalent of 7.5% body weight

                                                                                    29
resulted in sodium levels of approximately 125–130 mmol/L over an obser-
vation period of three hours. We next induced hyponatraemia and SE during
monitoring in a tethered EEG system. The number of high-amplitude epilep-
tiform events (spikes) was significantly increased during the second hour
after induction in mice with hyponatraemia (Fig 1). In 5/9 hyponatraemic
mice, repetitive spiking could be observed. One mouse displayed high-grade
seizure behaviour with loss of postural control and died during induction of
hyponatraemia.
Two hours after hyponatraemia induction, the mice (eight hyponatraemic
and seven controls) were treated with KA (20 mg/kg). The injection rapidly
evoked seizure activity in both groups. Next, we quantified the amount of
time animals spent with electrographic seizures during the hour after the
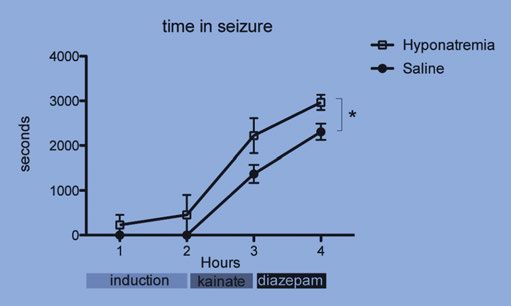
injection (see Fig 2).
Hyponatraemic mice showed a significantly longer duration with seizure
activity than the controls; 2293 ± 270 s vs. 1373 ± 200 s (SEM) (Fig. 3). One
hour after kainic acid treatment, diazepam (20 mg/kg) was administered.
During the hour following diazepam treatment, hyponatraemic mice also had
significantly longer durations of electrographic seizures compared to con-
trols; 3113 ± 129 s vs. 2306 ± 181 s (SEM) (Fig. 3). Two mice with hypo-
natraemia died during SE after KA treatment, whereas all control animals
survived.
30Fig 1. Epileptiform activity during induction of hyponatraemia. (A) Three traces of EEG during induction of hyponatraemia. The top trace shows EEG immediately after injection, and the two lower traces show occurrence of spikes 90 min after injection. (B) Similar recordings from saline-treated mice without spikes. (C) Quan- tification of spikes during induction of hyponatraemia. Hyponatraemic mice (n=8) demonstrated a significantly higher number of spikes compared to saline-treated mice (n=7) during the second hour of observation after injection (**, indicates p
Fig 2. Kainic acid-induced SE. (A and B) Kainic acid-induced seizure activity in
both saline (n=7) and hyponatraemic (n=8) mice. The top trace shows EEG immedi-
ately after the onset of seizures, and the bottom trace shows EEG at 45 min after
injection. (Q) Quantification of seizure activity showed that the latency to seizure
onset was very short in both groups of mice and not significantly different, whereas
the time spent with electrographic seizure activity during the hour after KA injection
was higher in hyponatraemic mice (*indicates p
Figure 3. Summary of time spent in seizure for each hour during the experiment.
Hyponatraemic mice spent more time in seizure during each hour of the experiment.
Hyponatraemia had a significant impact on the time in seizure (*indicates p < 0.05,
two-way repeated measures ANOVA on all mice that survived all treatment stages).
Following the experiment, the animals were euthanised, and their blood was
analysed for electrolyte disturbances. The sodium concentration was reduced
in all analysed mice where hyponatraemia had been induced. No significant
differences could be detected in the post-mortem concentrations of calcium,
potassium, glucose or blood pH (Table 6).
Table 6. Electrolyte and pH after SE-experiment (n=6 per group)
Parameter Saline (+SD) Hyponatraemia p-value (t-test)
Sodium (mg/dl) 143 (+0) 130 (+3.5) 0.0002*
Potassium (mg/dl) 4.5 (+1.4) 4.3 (+1.7) 0.84
Glucose (mg/dl) 195 (+59) 184 (+78) 0.80
pH 7.17 (+0.15) 7.15 (+0.15) 0.87
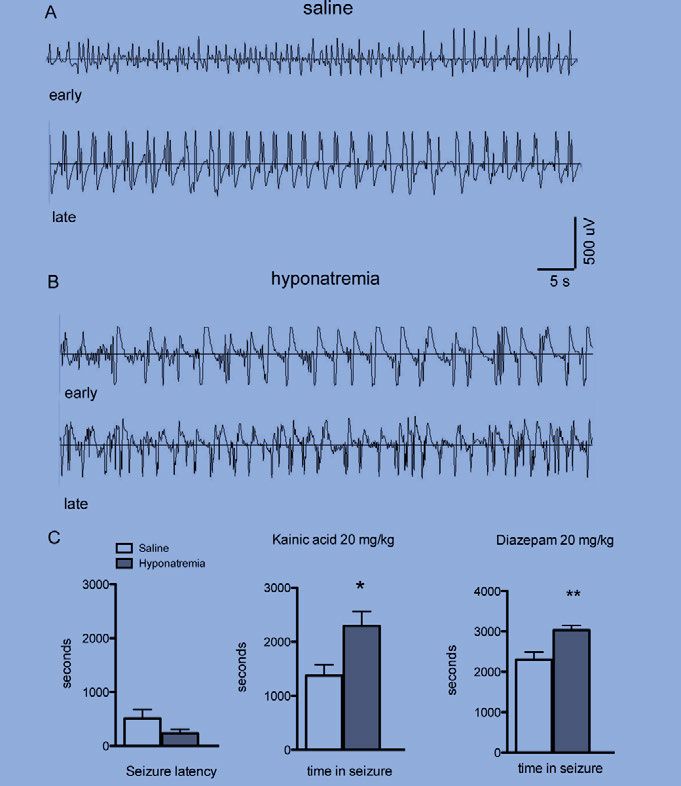
Paper IV
19 consecutive patients (14 women) were included. The mean age was 61
years (range 43-79). Clinical seizures were observed in 6 patients (32%).
Electrographic seizures were seen in 1 additional patient (4.5%). 1 patient
did not have cEEG because of technical problems and was therefore exclud-
ed from the statistical analysis.
The mean CSF concentrations (±SD) of tau4 were 1672±2687 ng/L
(range 75-10000 ng/L) and tau10 2950± 3540 ng/L (range 294-12300 ng/L).
The mean value for tau ratio was 3.5±2.4 (range 0.34-10.8). The concentra-
33tions of NFL 4 were 5612±5366 ng/L (range 340-19100 ng/L) and NFL10
18014±17321 ng/L (range 1850-73100). For details concerning each patient,
see Table 5.
Delayed cerebral ischemia was observed in seven patients (37%). Four
patients (21%) died during the first two months after development of DCI.
Sepsis and bacterial meningitis were the most frequent observed complica-
tions. Complete clinical data are shown in Table 6.
Cox regression analysis between tau ratio and DCI showed a Hazard ra-
tio [HR]=1.33 per point increase in tau ratio, [(CI) 1.055-1.680. p=0.016].
There was no statistically significant association between DCI and any of the
other variables (H&H, ASS, ES, NFL4, NFL10, tau4 and tau10), see Table
7.
Table 7. Clinical data on patients with SAH
Abbreviations: Acute Symptomatic Seizure (ASS), Delayed Cerebral Ischemia
(DCI), Electrographic Seizure (ES), Fisher grading scale (Fisher), Hunt and Hess
grading scale (H&H).
Reference values for lumbar CSF NFL; 40–59 years < 890 ng/L > 60 years 45 yearsTable 8. Association between clinical parameters, CSF concentrations of biomarkers
and DCI.
Variable No of counts Hazard Ratio p-value
(95% CI)
ASS 19 1.4 0.72
ES 18 - -
H&H 19 0.9 0.90
NFL4 19 1.0 0.61
NFL10 19 1.0 0.89
tau4 19 1.0 0.81
tau10 19 1.0 0.10
tau-ratio 19 1.3 0.01*
A Cox regression model was applied to evaluate the significance of acute
symptomatic seizures (ASS), electrographic seizures (ES), Hunt and Hess
severity scale (H&H), concentrations of neurofilament light (NFL), tau and
tau-ratio and development of delayed cerebral ischemia (DCI).
*p < 0.05.
35Discussion
This thesis was focused on seizures occurring in different dysmetabolic con-
ditions e.g. hyponatraemia and hypoglycaemia and in relation to acute SAH.
Such seizures are believed to be provoked (e.i. ASS) and have a different
prognosis from that of unprovoked seizures. Acute symptomatic seizures
reflect the severity of neuronal derangement and often require emergency
treatment. Despite its clinical relevance, little attention has been paid in the
scientific literature to studies of risk of ASS in dysmetabolic situations and
acute brain insults.
Hyponatraemia and risk of seizures
The prevalence of hyponatraemia in the emergency department has been
reported to be 2.7% - 2.9%[91], [92]. However, only 0.8 % of 1321 hypo-
natraemic patients (defined as sodium < 130 mM) had acute symptoms of
hyponatraemia in the survey by Hsu and co-workers. Of these, about half
had seizures. It has been suggested that ASS are rare manifestations with
sodium levels above 120 mM, and that convulsions or coma do not generally
occur until serum levels drop to 95-110 mM[93]. However, the ILAE Com-
mission on Epidemiology recognised the lack of systematic data on the rela-
tionship between metabolic derangements and seizures and suggested arbi-
trary cut off limits for metabolic disturbances, for example levels of hypo-
natraemia and risk of seizures[2].
Seizures occurring in patients with sodium disorders are usually general-
ised tonic-clonic, but focal seizures or other seizure types may be present.
Rapidly evolving electrolyte disturbances are more likely to cause seizures
than those developing gradually. It is therefore difficult to define absolute
levels of cut off values. In this systematic attempt to assess the risk of acute
symptomatic seizures in relation to different levels of hyponatraemia we
found a gradual increase in risk that corresponded to decreasing serum sodi-
um levels rather than a distinct cut off.
Among the patients, 3 of 120 (2.5 %) with serum sodium levels from 115-
119 mM had seizures, as did 3 of 54 (5.4 %) with serum sodium of 110-114
mM. Among patients with sodium levels < 110 mM, 11% had seizures. Us-
ing serum sodium levels between 120 and 124 mM as a reference, we found
36a gradual increase in risk with falling sodium levels rather than a distinct cut
off.
Of the seven patients with seizures at serum sodium < 115 mM, six had
other signs of encephalopathy, whereas no other neurological symptoms
were noted among the four patients with serum sodium higher than 115 mM.
Seizures could thus be the only manifestation of moderate levels of hypo-
natraemia. These data could be of crucial importance to clinicians since ac-
curate identification of ASS is needed and correction of underlying metabol-
ic derangement is important to control seizures and prevent permanent brain
damage.
Hypoglycaemia and risk of ASS
Although it is recognised that hypoglycaemia may cause neurological symp-
toms, only limited epidemiological data are available on the relationship
between the incidence of seizures and hypoglycaemia. In our study of hypo-
glycaemic patients we identified 388 individuals with glucose values ≤ 3.5
mM and 14 had disturbed consciousness including 3 with seizures. This
observation is in line with a publication from a US emergency department,
where 125 patients with symptomatic hypoglycaemia were identified. The
majority of the patients suffered from impairment of consciousness, and only
9 had seizures. Diabetes mellitus, alcoholism and sepsis, alone or in combi-
nation, accounted for 90% of predisposing conditions.
From textbooks and general overviews, we are taught that there are many
causes of ASS, and electrolytic and metabolic disorders are believed to ac-
count for 9% of all cases. The number of cases that can be specifically at-
tributed to hypoglycaemia, however, is unknown. From this study, it is not
possible to predict the true risk estimate for seizures induced by hypogly-
caemia. However, the risk of seizures at different blood glucose levels seems
to be low. The absolute risk for having symptoms was highest in the catego-
ry with very low blood sugar levels < 2 mM[26].
This is a finding of potentially great clinical relevance because seizures in
the presence of hypoglycaemia are often believed to be ASS. In view of our
findings, a thorough diagnostic work-up of patients presenting with seizures
in the presence of hypoglycaemia, especially at moderate levels, is justified.
Hyponatraemia and SE
Status epilepticus is a feared neurological emergency situation. Hypo-
natraemia is a well-known aggravating factor for seizures and is associated
with treatment refractoriness. There are several clinical conditions, such as
dehydration, renal failure and some antiepileptic drug treatments, which
37might have an impact on development of treatment resistant SE. In a review of 375 adult cases of status epilepticus, 10% had a metabolic disorder as the primary etiology and mortality in this subset of patients was as high as 40%.[94] Still, there is little experimental data on SE in relation to hypo- natraemia. In this thesis we wanted to apply an animal model of SE and sub- ject the animals to acute induced hyponatraemia. We found that hypo- natraemia in itself induced epileptiform activity in the form of interictal spikes and electrographic seizures on EEG. Alterations of electrolyte gradi- ents across cellular membranes exert effects on neuronal excitability and synchronisation, and consequently epileptiform activity. Furthermore, hypo- natraemia aggravated the response to the chemoconvulsant kainic acid and hyponatraemic mice had significantly longer episodes with seizure activity in comparison with non-hyponatraemic mice as measured by EEG. With a growing interest in optimising SE treatment, we believe that relevant pre- clinical models will be important for refining treatment protocols for SE. Acute symptomatic seizures in SAH Convulsive and non-convulsive seizures are common complications of SAH. The true frequency of NCS is unknown but has been described in 8% to 30%[78, 95] of comatose patients. It has been shown that seizures (clinical and electrographic) independently predict poor outcome after SAH but a significant relation to vasospasm has never been established. In our study we used continuous EEG monitoring for 72 hours early in the disease course and only found one patient with electrographic seizures. Clinical seizures were observed in six patients (32%). Altogether, seizures were noted in 36% of the patients but their presence could not predict impending DCI. Biomarkers in SAH Subarachnoid haemorrhage has a huge case fatality rate, underscoring the need for prognostic markers that can be used to aid in the identification of patients at high-risk for poor outcome prior to neurological deterioration. Specifically, development of biomarkers for vasospasm has failed. In paper IV we carried out a prospective study to examine CSF concentrations of two potential biomarkers, NFL and tau. Reports of NFL in relation to SAH and DCI are very scarce in the litera- ture[96]. One study[97] reported a significant increase in CSF NFL in SAH patients with secondary events. In our study, NFL showed an increase in all patients, but we were not able to detect any association between levels of concentrations of NFL and poor outcome with DCI. 38
In previous studies[98, 99] it has been shown that SAH was associated
with a significant increase of CSF tau measured at days 1 and 2 and that the
increase correlated to extent of brain injury and poor clinical outcome. How-
ever, a delayed peak preceding the occurrence of clinical vasospasm did not
follow this acute peak. We could not confirm these findings. On the contra-
ry, there was no correlation between tau at day 4 and severity of SAH. This
discrepancy could be attributed to the rather small numbers of patients in
both studies and measurements at different time points. Using tau ratio, a
factor that may reflect ongoing brain damage and risk of DCI, an increase
was noted in a majority of the patients who developed DCI (five out of sev-
en) during the first two weeks. We believe that changes in tau levels between
days 4 and 10 could thus be a sign of excessive cortical damage related to
development of DCI.
   However, we could not detect an increase in tau ratio in the patients that
developed DCI later than day 12, most probably due to the limitation of
sampling time.
   The pathophysiologic mechanism underlying DCI is probably multifacto-
rial, and is not fully understood. It has long been argued that cerebral vaso-
constriction is the major contributing factor. Other additional mechanisms
include spreading depression and “early brain damage”, referring to the
damage that occurs to the brain in the first 72 hours after the initial
bleeding[100]. Although this takes place before the onset of DCI, it seems
probable that the physiological changes increase the energy demand and
thereby influence the likelihood of secondary complications such as DCI.
With this view, a sensitive CSF biomarker for cortical or neuronal damage
would be a valuable tool in treatment aimed at avoiding DCI.

Limitations
In papers I and II there are limitations inherent to the retrospective epidemio-
logic approach. First, although a large database was used, the number of
cases with ASS is small and CIs of our estimates are wide and partly over-
lapping. Second, the study is based on reviews of medical records from two
single centres, and we were not able to confirm the accuracy of clinical data.
It is also possible that there is some underreporting of at least subtle seizures,
which would have required EEG for accurate diagnosis. However, this
would not have affected the comparison between seizure occurrences at dif-
ferent levels of hyponatraemia. A further complication is that the patients
constituted a heterogonous group with respect to age, comorbidities, aetiolo-
gies and other possible metabolic derangements. Finally, in study I we were
not able to separate patients who developed metabolic derangements rapidly
from those who developed them more gradually. It is well known that the

                                                                               39
You can also read