Outlook 2023: A Cyclical Recovery - GROW Research China Market Strategy - Grow Investment Group
←
→
Page content transcription
If your browser does not render page correctly, please read the page content below
GROW Research
                              China Market Strategy                                            November 20, 2022

Outlook 2023: A Cyclical Recovery
     China finetuning “COVID-Zero”; flames of “Dual Circulation” turning blue. The           Hao Hong, CFA
     Chinese authority is finetuning “COVID-0”, at a juncture when negative exports         Hong, CFA
                                                                                             hao.hong@growim.com
     growth for the first time in 29 months and negative retail growth are suggesting
     receding demand both home and abroad. Yet onshore market rebounded strongly
     - from a similar level last seen at the onset of COVID in Mar 2020.
                                                                                            Chinese version:
     China’s export cycle, an intermediate economic cycle running every seven years,        《“展望 2023:或跃
     has peaked in Feb 2021, and has translated to slowing accumulation of current          在渊”》
     account surplus compared with GDP. The export cycle correlates closely with
     China’s stock market cycle via the liquidity created via its export cycle. Thus, a
     peaking export cycle argues against a “secular bull market” suggested by
     consensus.

     Economic cycle near turning point, but arduous property recovery likely. The
     short cycle as measured by the property investment cycle, however, is nearing its
     turning point, but still needs a catalyst to initiate a new cycle over the course of
     next twelve months.

     There are many similarities between now and early 2014. For instance, both
     periods saw Fed tightening and Chinese property struggling, and the authority
     eventually came to the rescue. There are also analogs in the market trajectories
     in both periods. For instance, the Shanghai Composite struggled in the first few
     months in 2014.

     Meanwhile, the US short economic cycle is receding from its peak, but not yet
     appropriately reflecting the recessionary risks confronting the US economy. Given
     the intertwining of the US and Chinese economies, US macro volatility will find its
     way to Chinese markets and onto the world via exchange rate, commodities,
     stocks, and bonds.

     Shanghai ~3-3,500, Hang Seng ~16-23,000, with bouts of volatility. Easing into
     Cyclicals/Growth over Defensive/Value. Our base case is that China will reopen
     gradually with zigzags, its property sector will recover slowly with policy support,
     and a 2023 US recession. If any of these three uncertainties is better than
     expected, such as faster reopening, swift property recovery or no US recession, it
     will add to our base-case payoff.

     China margin cycle is re-expanding and bodes well for the relative performance of
     cyclicals and growth over defensive and value. Intuitively, if China reopens and
     property recovers, cyclical demand should improve. And growth, too.

     Of course, the risk is China stays a hermit, property continues to ail, and a US
     recession. Such triple whammies would render a risk scenario similar to what we
     have been through in 2022 – no need to elaborate further. Even so, the epic
     volatility in 2022 suggests that we should have seen some of the lowest points in
     the Shanghai Composite and the Hang Seng Index in the current cycle.

     It is time to look forward.

Disclosures and disclaimer at the back forms part of this report and must be read.                          1 / 23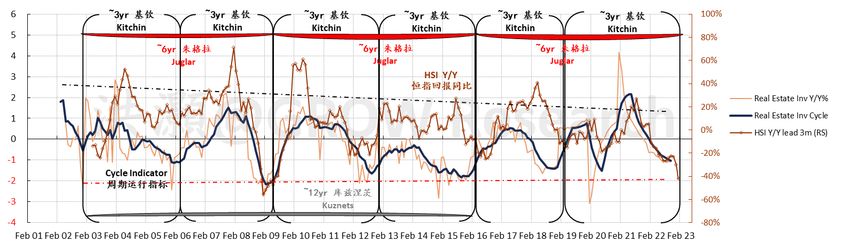
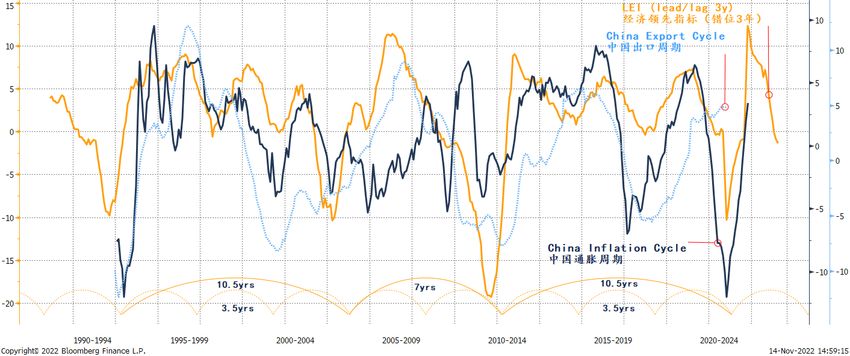
November 20, 2022
GROW Research

“Dual Circulation” Need Re-starting
On Oct 31, 2022, we published a report titled “Mai! Mai! Mai!”. We wrote that “at this
point, excessive pessimism doesn’t help anyone and starts to disagree with our
contrarian-self”. It is a change to our cautious stance on Chinese markets issued twelve
months ago.

Since our report three weeks ago, both on- and off-shore markets surged to some of their
best gains ever, adding well over 4 trillion yuan worth of market cap. Our follow-up tweet
on Nov 1 was kindly dubbed the “Trillion-Dollar Tweet”. All these tectonic shifts suggest
reopening is key, and it is coming.

Figure 1: China’s export cycle has peaked. It correlates closely with the stock market return cycle.

Source: Bloomberg, GROW Research

There is much to cheer about. But amid all the market hysteria, one must sit back to gauge
the sustainability of such resurgence. After all, a technical rebound can be strong but
fleeting, but a bull market needs more than a sentiment change to sustain valuation
expansion. Without improving fundamentals that will support sustainable earnings
growth, investing will once again turn into a game of cutting your trading opponent’s
lunch, rather than sharing a growing pie.

To us, China starts gradually adjusting COVID measures at this juncture is not without
reasons. China’s export growth has turned negative in October for the first time in 29
months. That is, external demand, one prong of China’s “Dual Circulation” strategy, is
starting to fail. In the past two years, China’s economy has remained resilient, owing to
the strength in Chinese exports that confounded most economists, despite COVID-0 and
a frail property market. But the table has begun to turn. And the Fed’s tightening has
started to affect demand for Chinese exports.

Disclosures and disclaimer at the back forms part of this report and must be read.                 2 / 23
November 20, 2022
GROW Research

Meanwhile, retail sales growth, a measure of domestic demand, has also slipped into
negative territory in October. As such, both wheels of “Dual Circulation” begin to get
stuck in reverse. If exports, consumption and investments would not support the
economy, while government spending would be strained by declining land sales, the
outlook for 2023 would appear bleak.

To resist such gloom, it is time for China to reopen.

We can show that China’s export growth, after adjusted for a 3.5-year cycle, is closely
correlated with China’s stock market return cycle (Figure 1). It also ebbs and rises with
China’s current account balance, as well as the relative return between the Hang Seng
Index and the Shanghai Composite (Figure 2).

The peaks of China’s export cycle are 2008 and 2015, the years when China saw the two
infamous bubbles in its stock market history (Figure 2). This is no coincidence, as forex
funds have been an important source of China’s domestic liquidity, and current account
accumulation from the export cycle has become part of the country’s money supply to
drive China’s stock market. In early 2022, China’s export cycle has once again peaked. It
is the argument supporting our cautious and contrarian stance in 2022, and a profound
explanation for China’s dismal stock market performance this year.

Figure 2: China export cycle moves in tandem with current account and HK’s relative return.

Source: Bloomberg, GROW Research

As we wrote, China’s on- and offshore markets soared, and consensus started to chant
“the start of a new secular bull market” again. While we share some of the optimism, the
above discussions about the peaking of China’s export cycle and its correlation with
China’s stock market return cycle offer contradicting evidence to such claims.

That said, China’s export cycle runs about every seven years, but our outlook is about the
next twelve months. While the consensus’s claim about a new secular bull market lacks
fundamentals, shorter-term cyclical moves can still counter a longer-term falling trend.

Disclosures and disclaimer at the back forms part of this report and must be read.            3 / 23
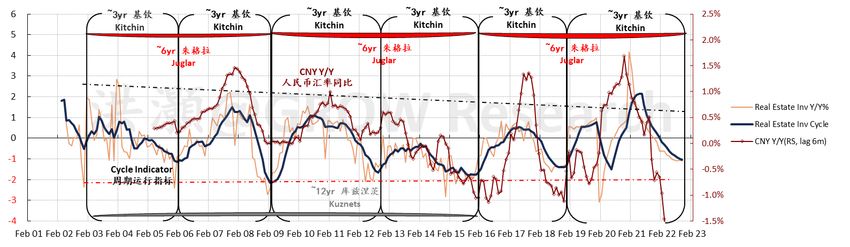
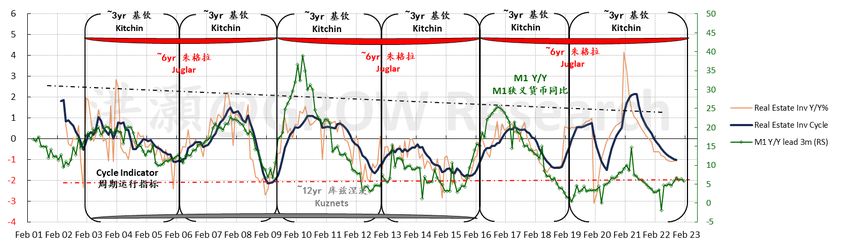
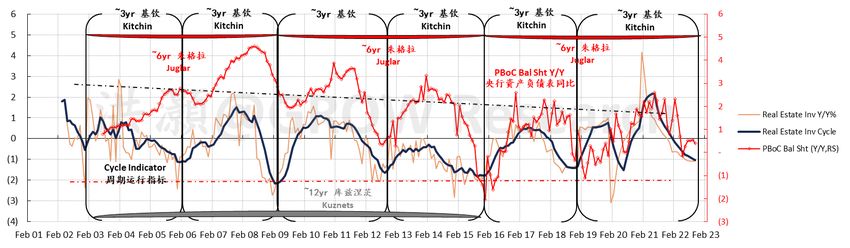
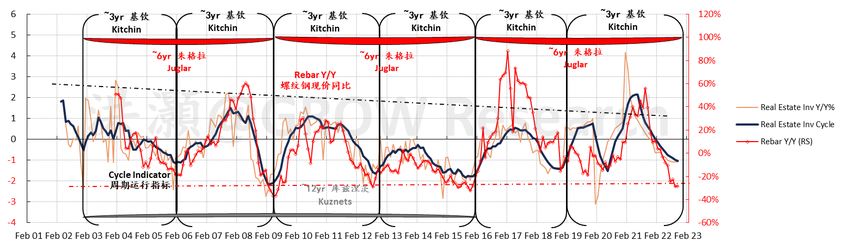
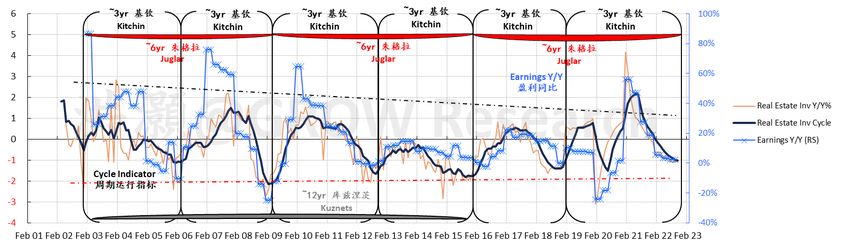
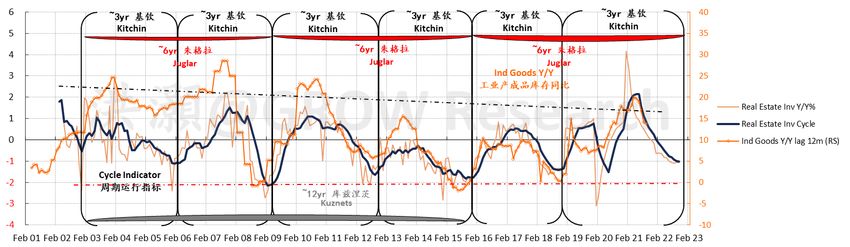
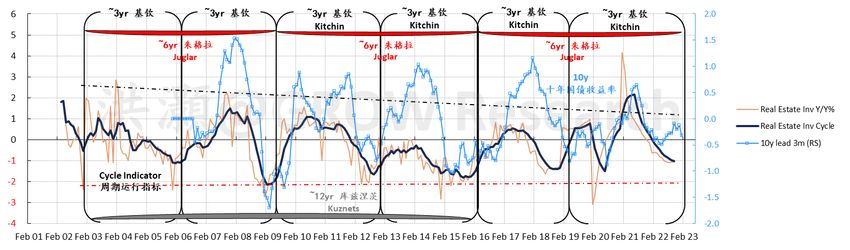
November 20, 2022
GROW Research

China’s Short Economic Cycle Near Turning Point. But…
Many cycles run concurrently within an economy. The margin cycle is one of them. We
measure the margin cycle by the gap between CPI and PPI. We can show that China’s
margin cycle is closely correlated with the export cycle and leads the global economic
cycle (Figure 3).

As data show, China’s margin cycle is expanding. It is because of rapidly falling upstream
prices, rather than the rising pricing power in the downstream. Expanding margin gives
incentive to produce, while weak demand for goods will eventually lead to inventory
buildup – if China continues to unswervingly stick to “COVID-0” despite falling foreign and
domestic demand. Thus, the Chinese economy will soon enter the destocking phase that
will drag on growth.

Meanwhile, the leading indicator for the world economy has declined sharply, but still
not at a level appropriately reflect the challenges that the world is facing (Figure 3). As
such, when China starts to destock in the coming months, the world economy will likely
be affected further. And both prongs of “Dual Circulation” will hurt.

Figure 3: China’s margin cycle is recovering, but export cycle sets to slow.

Source: Bloomberg, GROW Research

Our proprietary model also suggests that China’s property cycle is nearing its turning
point (Figure 4). China’s property cycle is closely correlated with almost all
macroeconomic variables and thus can explain the bulk of variance in the Chinese
economy. For instance, the property cycle moves in tandem with rebar, bond yield, stock
market indices, CNY exchange rate, money supply growth, the PBoC’s balance sheet and
so on (Appendix 1-4).

The property cycle runs every three to four years. If the current cycle started in early 2019,
although punctured by the pandemic in 2020, by now the property cycle should be close
to the beginning of a new cycle, if history is a guide (Figure 4).

Disclosures and disclaimer at the back forms part of this report and must be read.               4 / 23
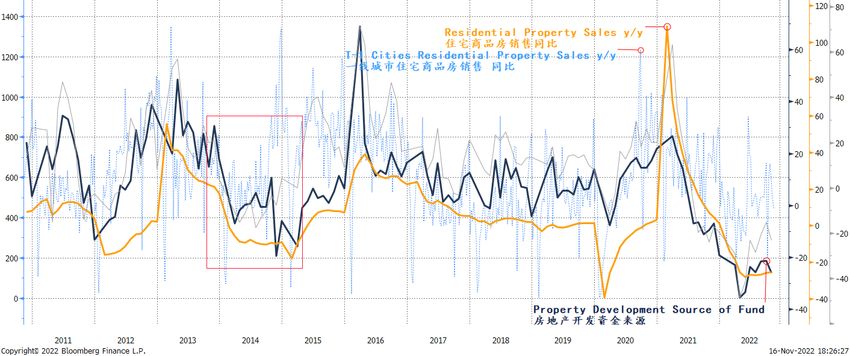
November 20, 2022
GROW Research

Figure 4: China economic cycle nearing a turning point.

Source: Bloomberg, GROW Research

However, just because a cycle is nearing its turning point doesn’t not necessarily mean
that the cycle will just turn by itself. As we always say, economic cycle is not an alarm
clock. It approximates how the economy rises and falls through cycles. Necessary
ingredients, such as credit, must be present for the property cycle to turn.

2022 has been a horrendous year for Chinese developers. As sales slow, cash flow is not
able to cover all development needs. Some building projects are not finished and need
the financial assistance from the government. Offshore USD developer bonds plunged
70%, due to some high-profile defaults.

Disclosures and disclaimer at the back forms part of this report and must be read.          5 / 23
November 20, 2022
GROW Research

We estimate that 2023 will see over one trillion yuan on- and off-shore property bonds
maturing. For the first three quarters of 2022, the top 16 developers generated ~150
billion yuan of EBITDA, a proxy of gross cashflow. If we assume that 2023 sales won’t
recover quickly, and gross cashflow of the industry to be ~400 billion yuan, then
developers will find it difficult to repay over one trillion yuan of debt due, without further
assistance from the government.

Fortunately, the government has announced the expansion of credit lines from 160 billion
yuan to 250 billion yuan. Previously, this line of credit excludes developers. Further, there
is guidance for the commercial banks to lend to developers. And the limits on the
proportion of bank loan exposure to developers have been eased. While the extent of
assistance that developers will need in 2023 depends on the recovery of property sales,
this flurry of government easing measures hints at finetuning of property policy from the
top.

Will it bend?

2013-2014 vs. Now
There are analogs between 2013-2014 and now (Figure 5). Such fractal resemblances in
market trajectories, although could be pure happenstance, can offer some clues as to
how the market reflects the confluences of significant events and changes in economic
fundamentals in the months ahead.

Figure 5: The Shanghai Composite 2013-2014 vs. now.

Source: Bloomberg, GROW Research

In Sep 2012, the Fed announced QE3 without a specific end date. QE3 expanded in Dec
2012, but Bernanke announced “tapering” of QE in June 2013 and started to taper in Jan
2014. By Oct 2014, bond buying had completely stopped. Such hawkish change to the
Fed’s monetary stance, as well as subsequent maneuvers, is similar to what we have been
witnessing in 2022.

Disclosures and disclaimer at the back forms part of this report and must be read.               6 / 23
November 20, 2022
GROW Research

Meanwhile, Chinese property sales slipped in early 2014, due to the restrictive measures
taken in 2013 to curb property speculation. Then, the “9-30 New Policy” (“930 新政”)
cut the down payment requirement and mortgage rate. It also relaxed some purchasing
restrictions such as letting people who owned more than one property to buy if the
mortgage on the first property had been paid off.

Even with increasing policy support, property sales took an entire year of 2014 recover.
In August 2014, property inventory-to-sales ratio was as high as 38 months. It wasn’t until
the interest rate and RRR cuts in 2015, coupled with policies on shanty town
reconstruction by PSL expansion of the CDB, then property sales started to recover
(Figure 6).

Figure 6: China property sales and source of funds at all-time low.

Source: Bloomberg, GROW Research

In sum, both the Fed’s policy and China’s property measures are similar between 2013-
2014 and now. They are the two most consequential central banks in the world. That said,
property sales and source of funds for property development in China now are even
worse than they were in 2014. In 2014, it took much more than a few RRR and interest
rate cuts, as well as the expansion of a policy bank, for Chinese property to recover.

In the first few months of 2014, Chinese stocks didn’t go anywhere, although with
intermittent technical rebounds (Figure 5). If 2023 is similar to 2013-2014, stocks will be
tested again in the coming months.

Disclosures and disclaimer at the back forms part of this report and must be read.            7 / 23
November 20, 2022
GROW Research

Will Cyclicals/Growth Outperform Please?
We have discussed in previous section that China’s margin cycle, as measured by CPI-PPI,
is expanding again. Interestingly, the nadir of the current margin cycle levels with the
lowest point in history in the 1993 cycle (Figure 7). When margin is expanding,
downstream demand will send more orders to upstream, and upstream will produce
more to fill the orders. Eventually, margin expansion will induce an upstream recovery,
and thus a potential upturn of the economic cycle.

Figure 7: China’s margin cycle is closely correlated with relative return of cyclicals and growth.

Source: Bloomberg, GROW Research

If so, cyclical sectors, such as industrials, materials, discretionary, property and infotech,
should outperform. Or their underperformance should narrow. We constructed an equal-
weighted index of the cyclical sectors and compared its relative performance with the
margin cycle. We can show that they are closely correlated, with the relative performance
of cyclicals lagging by about four to six months. And the relative performance of growth
sectors shows a similar relationship (Figure 6). These results confirm our theory of
economic cycle.

While the margin cycle bodes well for the outlook of cyclicals and growth, there is an
important caveat. Note that cyclical sectors include property and infotech, two key drags
on the overall market performance in 2022.

The ills of property stem from developers over leveraging and plunging property sales.
The malaises of infotech are from excess valuation bubble two years ago that is still being
digested, as well as the US ADR audit. As such, while the margin cycle favors these sectors,
they still need a lot of work and are fraught with risks.

Disclosures and disclaimer at the back forms part of this report and must be read.                   8 / 23
November 20, 2022
GROW Research

Market Outlook
Our proprietary EYBY model that tracks China’s economic short cycle of every three to
four years is around its cyclical bottom, consistent with the observations from our
economic cycle model based on the property cycle (Figure 8).

Our EYBY model for the Shanghai Composite forecasts a trading range for the next twelve
months to be around 3,000 to ~3,500. For the Hang Seng Index, our EYBY model indicates
that the ~15,000 level that we witnessed during the brutal selloff in late October should
be a low point of the current cycle, with an upper bound of ~23,000. That said, we
emphasize the this is a very broad range, and its path will be treacherous.

Figure 8: Our proprietary EYBY models for on- and off-shore market are nearing its bottom.

Source: Bloomberg, GROW Research

Disclosures and disclaimer at the back forms part of this report and must be read.           9 / 23
November 20, 2022
GROW Research

Our EYBY model correlates very closely with the underlying index, especially after
adjusting for the bubble years of 2007 and 2015 (Figure 9). For instance, our forecast
trading range for the Shanghai Composite, which was published in November 2021 for
the twelve months to November 2022, was slightly below 3,000 to no higher than 3,800.
Importantly, it was a lone voice for caution against the bullish consensus at that time and
invited censorship scrutiny.

Figure 9: Our EYBY model correlates closely with the actual index movements.

Source: Bloomberg, GROW Research

Disclosures and disclaimer at the back forms part of this report and must be read.            10 / 23
November 20, 2022
GROW Research

Risks to Our Forecast
Our base-case forecast scenario is for a gradual reopening, a slow recovery in the
property sector and a US recession in 2023, which will affect the return in Chinese stocks,
especially the return of the Hong Kong and the offshore market.

Figure 10: Economic cycles between China and the US are closely corelated.

Source: Bloomberg, GROW Research

Figure 11: US economic cycle is rapidly decelerating.

Source: Bloomberg, GROW Research

Interestingly, our EYBY model can be also applied to the US economic cycle. In Figure 10,
we can show that our model is very closely correlated with the US earnings cycle and the
semiconductor cycle. Given the interconnection between the two economies, this
observation should not have come as a surprise.

Disclosures and disclaimer at the back forms part of this report and must be read.            11 / 23
November 20, 2022
GROW Research

While the Chinese short economic cycle, as measured here by our EYBY model, is near its
turning point, the US earning cycle has not yet, though it is rapidly decelerating (Figure
11).

Figure 12: Scenarios in 2023

                                                                                     Prob 4/5                   Prob 64/125
                                                                                     US Recession
                                                        Prob 4/5                                                Payoff 0
                                                        Slow Property Recovery                  Base-Case Scenario

                                                                                     Prob 1/5                   Prob 16/125
                                                                                     US Without Recession
                        Prob 4/5                                                                                Payoff 1
                        Reopening

                                                                                     Prob 3/5                   Prob 12/125
                                                                                     US Recession
                                                        Prob 1/5                                                Payoff 2
                                                        Quick Property Recovery

                                                                                     Prob 2/5                   Prob 8/125
                                                                                     US Without Recession
                                                                                                                Payoff 3

                                                                                     Prob 9/10                  Prob 9/50
                                                                                     US Recession
                                                        Prob 1/1                                                Payoff -2
                                                        Slow Property Recovery

                                                                                     Prob 1/10                  Prob 1/50
                                                                                     US Without Recession
                        Prob 1/5                                                                                Payoff -1
                        No Reopening

                                                                                     Prob 4/5
                                                                                     US Recession

                                                        Quick Property Recovery
                                                                                                      Unlikely Scenario
                                                                                     Prob 1/5
                                                                                     US Without Recession

Source: GROW Research

Disclosures and disclaimer at the back forms part of this report and must be read.                                        12 / 23
November 20, 2022 GROW Research To facilitate our discussion, we have outlined the scenarios for 2023 in Figure 12. There are many uncertainties affecting the investment outcome. The most important ones are: 1) whether China will reopen, 2) how fast Chinese property can recover and 3) whether the US will face a recession. We have discussed the first two uncertainties in details in the above sections. We believe China will reopen and may already in the process. The reopening will be gradual and managed, fitting to the Chinese philosophy of gradualism. And there will be rounds of back and forth, as China “crosses the river while feeling the stones”. Despite the mounting challenges, it is not a question of whether China will reopen, but a question of over how long a period and how best to manage to minimize healthcare costs and potential lives lost. Of course, the probability of reopening cannot be quantified, and must be monitored through propaganda nuances and gradation of local pandemic maneuvers. That said, we note that the rally started on Oct 31, 2022 around the level when the onshore stock market indices were around their lows seen in Mar 2020, the onset of COVID. As such, we assign a probability of 4/5 to the gradual reopening scenario. (This probability is a judgement call, and only shows how comfortable we are with the scenario.) Another uncertainty is how the property sector will recover. We have seen the “three arrows” of policy support, such as supporting bond issuance by developers, guidance for the banks to lend to the sector and even potential participation in the equity issuance of developers. Even so, a comparison between now and the situation of the property sector in 2014 suggests that the recovery will be slow rather than quick. In 2014, it took a few rate cuts and RRR cuts, as well as the re-expansion of a policy bank’s balance sheet to clear the property inventory accumulated from the “Five National Measures 国五条” of property curbs. As such, we assign a probability of 4/5 to the slow property recovery scenario. Our proprietary economic cycle model, with strong track records, points to a looming US recession in the first half of 2023. As the Fed tightens, US demand will fall. US earnings growth, too. Thus, a gradual reopening, slow property recovery and a US recession in 2023 together set our base-case payoff. If the outcome of any of these contingencies are better than expected, then payoff will be even higher. If not, significant market downside will ensue, with payoff below even our base case. Such risk scenario doesn’t need much elaboration. We choose to fill our days with hopes, rather than to live in the shadow of fears. Hao Hong, CFA Twitter: @HAOHONG_CFA https://twitter.com/HAOHONG_CFA Disclosures and disclaimer at the back forms part of this report and must be read. 13 / 23
November 20, 2022
GROW Research

Appendix
Appendix 1: China economic cycle (1/4).

Source: Bloomberg, GROW Research

Disclosures and disclaimer at the back forms part of this report and must be read.   14 / 23
November 20, 2022
GROW Research

Appendix 2: China economic cycle (2/4).

Source: Bloomberg, GROW Research

Disclosures and disclaimer at the back forms part of this report and must be read.   15 / 23
November 20, 2022
GROW Research

Appendix 3: China economic cycle (3/4).

Source: Bloomberg, GROW Research

Disclosures and disclaimer at the back forms part of this report and must be read.   16 / 23
November 20, 2022
GROW Research

Appendix 4: China economic cycle (4/4).

Source: Bloomberg, GROW Research

Disclosures and disclaimer at the back forms part of this report and must be read.   17 / 23
November 20, 2022
GROW Research

Appendix 5: US economic cycle (1/3).

Source: Bloomberg, GROW Research

Disclosures and disclaimer at the back forms part of this report and must be read.   18 / 23
November 20, 2022
GROW Research

Appendix 6: US economic cycle(2/3).

Source: Bloomberg, GROW Research

Disclosures and disclaimer at the back forms part of this report and must be read.   19 / 23
November 20, 2022
GROW Research

Appendix 7: US economic cycle(3/3).

Source: Bloomberg, GROW Research

Recent Reports

 20221106                     “A Trillion-Dollar Tweet”
 20221030                     “Mai! Mai! Mai!”
 20221016                     Whose Confidence Is Gold?
 20221009                     Saving Hong Kong
 20220925                     Can Property Save the Day - Again?
 20220919                     “Chill” about CNY Beyond 7

Disclosures and disclaimer at the back forms part of this report and must be read.   20 / 23
November 20, 2022
GROW Research

Required Disclosures
This report has been prepared by GROW Asset Management (HK) Limited (“GROW AM”).
GROW AM, its subsidiaries, branches and affiliates are referred to herein as GROW. For
information on the ways in which GROW manages conflicts and maintains independence
of its research product; historical performance information; certain additional disclosures
concerning GROW research recommendations; and terms and conditions for certain third
party data used in research report, please contact GROW. The figures contained in
performance charts refer to the past; past performance is not a reliable indicator of
future results. Additional information will be made available upon request. GROW AM is
licensed by Securities and Futures Commission to conduct Type 9 (asset management)
activities. Analyst Certification: Each research analyst primarily responsible for the
content of this research report, in whole or in part, certifies that with respect to each
security or issuer that the analyst covered in this report: (1) all of the views expressed
accurately reflect his or her personal views about those securities or issuers and were
prepared in an independent manner, and (2) no part of his or her compensation was, is,
or will be, directly or indirectly, related to the specific recommendations or views
expressed by that research analyst in the research report. For a complete set of disclosure
statements associated with the companies discussed in this report, including information
on valuation and risk, please contact GROW.

Global Disclaimer
This document has been prepared by GROW Asset Management (HK) Limited (“GROW
AM”). GROW AM, its subsidiaries, branches and affiliates are referred to herein as GROW.
This Document is provided solely to recipients who are expressly authorized by GROW
to receive it. If you are not so authorized you must immediately destroy the Document.
GROW research is provided to our clients. When you receive GROW research through,
your access and/or use of such research is subject to this Global Disclaimer. When you
receive GROW research via a third party vendor, e-mail or other electronic means, you
agree that use shall be subject to this Global Disclaimer. If you receive GROW research
by any other means, you agree that you shall not copy, revise, amend, create a
derivative work, provide to any third party, or in any way commercially exploit any
GROW research provided, and that you shall not extract data from any research or
estimates provided to you via GROW research or otherwise, without the prior written
consent of GROW.

In certain circumstances (including for example, if you are an academic or a member of
the media) you may receive GROW research and you understand and agree that (i) the
GROW Research is provided to you for information purposes only; (ii) for the purposes of
receiving it you are not intended to be and will not be treated as a “client” of GROW for
any legal or regulatory purpose; (iii) the GROW research must not be relied on or acted
upon for any purpose; and (iv) such content is subject to the relevant disclaimers that
follow. This document is for distribution only as may be permitted by law. It is not
directed to, or intended for distribution to or use by, any person or entity who is a citizen
or resident of or located in any locality, state, country or other jurisdiction where such
distribution, publication, availability or use would be contrary to law or regulation or
would subject GROW to any registration or licensing requirement within such jurisdiction.
This document is a general communication and is educational in nature; it is not an

Disclosures and disclaimer at the back forms part of this report and must be read.              21 / 23
November 20, 2022
GROW Research

advertisement nor is it a solicitation or an offer to buy or sell any financial instruments or
to participate in any particular trading strategy. Nothing in this document constitutes a
representation that any investment strategy or recommendation is suitable or
appropriate to an investor’s individual circumstances or otherwise constitutes a personal
recommendation. By providing this document, none of GROW or its representatives has
any responsibility or authority to provide or have provided investment advice in a
fiduciary capacity or otherwise. Investments involve risks, and investors should exercise
prudence and their own judgment in making their investment decisions. None of GROW
or its representatives is suggesting that the recipient or any other person take a specific
course of action or any action at all. By receiving this document, the recipient
acknowledges and agrees with the intended purpose described above and further
disclaims any expectation or belief that the information constitutes investment advice to
the recipient or otherwise purports to meet the investment objectives of the recipient.
Past performance is not necessarily indicative of future results. Neither GROW nor any of
its directors, employees or agents accepts any liability for any loss (including investment
loss) or damage arising out of the use of all or any of the Information. Prior to making any
investment or financial decisions, any recipient of this document or the information
should take steps to understand the risk and return of the investment and seek
individualized advice from his or her personal financial, legal, tax and other professional
advisors that takes into account all the particular facts and circumstances of his or her
investment objectives. Any prices stated in this document are for information purposes
only and do not represent valuations for individual securities or other financial
instruments. Different assumptions by GROW or any other source may yield substantially
different results. No representation or warranty, either expressed or implied, is provided
in relation to the accuracy, completeness or reliability of the information contained in
any materials to which this document relates (the "Information"). The Information is not
intended to be a complete statement or summary of the securities, markets or
developments referred to in the document. GROW does not undertake to update or keep
current the Information. Any opinions expressed in this document may change without
notice and may differ or be contrary to opinions expressed by other business areas or
groups, personnel or other representative of GROW. Any statements contained in this
report attributed to a third party represent GROW's interpretation of the data,
information and/or opinions provided by that third party either publicly or through a
subscription service, and such use and interpretation have not been reviewed by the third
party. In no circumstances may this document or any of the Information (including any
forecast, value, index or other calculated amount ("Values")) be used for any of the
following purposes: (i) valuation or accounting purposes; (ii) to determine the amounts
due or payable, the price or the value of any financial instrument or financial contract; or
(iii) to measure the performance of any financial instrument including, without limitation,
for the purpose of tracking the return or performance of any Value or of defining the
asset allocation of portfolio or of computing performance fees. By receiving this
document and the Information you will be deemed to represent and warrant to GROW
that you will not use this document or any of the Information for any of the above
purposes or otherwise rely upon this document or any of the Information. GROW has
policies and procedures, which include, without limitation, independence policies and
permanent information barriers, that are intended, and upon which GROW relies, to
manage potential conflicts of interest and control the flow of information within divisions

Disclosures and disclaimer at the back forms part of this report and must be read.               22 / 23
November 20, 2022 GROW Research of GROW and among its subsidiaries, branches and affiliates. For further information on the ways in which GROW manages conflicts and maintains independence of its research products, historical performance information and certain additional disclosures concerning GROW research recommendations, please contact GROW. Research will initiate, update and cease coverage solely at the discretion of GROW, which will also have sole discretion on the timing and frequency of any published research product. The analysis contained in this document is based on numerous assumptions. Different assumptions could result in materially different results. GROW specifically prohibits the redistribution of this document in whole or in part without the written permission of GROW and in any event GROW accepts no liability whatsoever for any redistribution of this document or its contents or the actions of third parties in this respect. Images may depict objects or elements that are protected by third party copyright, trademarks and other intellectual property rights. The key symbol and GROW are among the registered and unregistered trademarks of GROW. All rights reserved. Disclosures and disclaimer at the back forms part of this report and must be read. 23 / 23
You can also read