Paterson Public School No. 15 Travel Plan - Safe Routes to School Program 98 Oak Street Paterson NJ 07501
←
→
Page content transcription
If your browser does not render page correctly, please read the page content below
Safe Routes to School Program

        Paterson Public School No. 15 Travel Plan
                        98 Oak Street Paterson NJ 07501

Prepared By:

EZ Ride
144 Park Place East
Wood-Ridge, NJ 07075
(201) 939-4242
www.ezride.org

December 31, 2020
DISCLAIMER

This publication was prepared with funding from the New Jersey Department of Transportation
(NJDOT) and the Federal Highway Administration (FHWA). This document is disseminated
under the sponsorship of NJDOT and FHWA in the interest of information exchange. NJDOT and
FHWA assume no liability for its contents or use thereof.

                                             2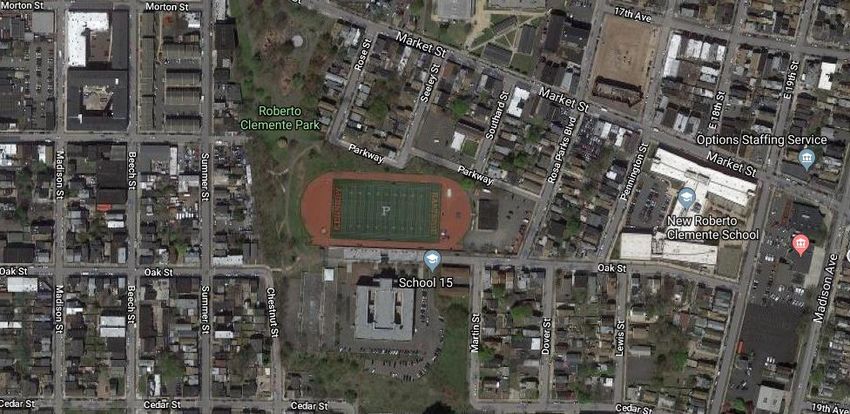
Table of Contents

Executive Summary……………………………………………………………….……………..……….….…….....4

1. Walking and Cycling to Health ………………………………………………………….………..….…...…6

1.1 The Challenge ……………………………………………………………………………….….….…….…..….…6
1.2 The Program……………………………………………………………………………………..….…….…..….…6
1.3 The Team and Taskforce…..………………………………………………..………….…..….……..….…..7

2. District & School Profile………………………………………………………….…………..……….……....10

2.1 Passaic County Health Profile – 2016 Community Health Assessment.....……………..11
2.2 Paterson Public School No. 15 …………..……..………………………………………………..…….… 15

3. Journey to School ………………………………………………………………………….…….......……….…15

3.1 Current Student Travel Environment.…………………………………………………..……………...16
3.2 Pedestrian Safety…………………………………………………………………..………………...………….19
3.3 Walkability Assessment ………………………………………………………….……………….……….….20

4. Action Plan & Recommendations……..………………………………………………….……….………28

                                      Appendices

Appendix A: Design Guide …………………………………………….…………………………………………33

Appendix B: Infrastructure Funding Resources …………….…………………………………………39

                                            3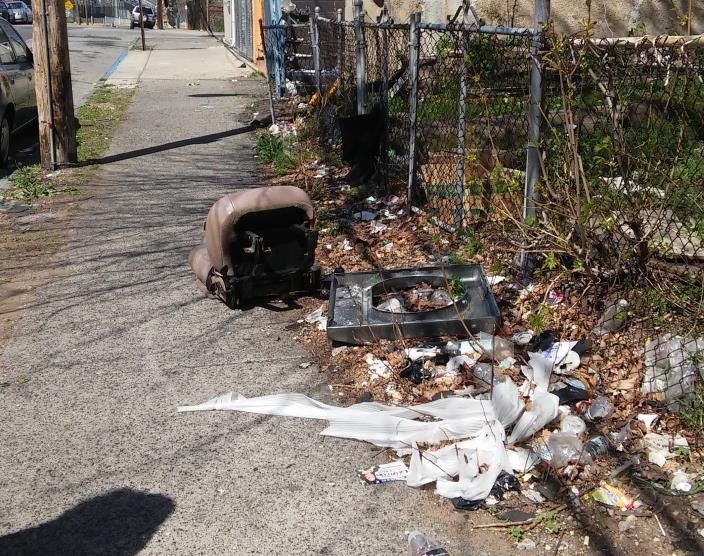
Executive Summary
A Safe Routes to School (SRTS) Travel Plan is a resource to encourage and increase the number
of students walking or bicycling to school. It provides directions for schools, students, families
and the city to build a safer walking and biking environment for residents.

School Travel Plans are site specific and describe the needs of each particular school being
studied. The plan includes observations, ideas and an action plan to address issues and
problem areas. The Plan covers five aspects of the Safe Routes to School program – Education,
Encouragement, Enforcement, Evaluation, and Engineering.

The School Travel Plan outlines the timeframe and funding priorities to support a coordinated
schedule of streetscape improvements. In fact, the New Jersey Safe Routes to School (SRTS)
infrastructure funding program requires applicants to have an approved School Travel Plan in
order to apply for a grant.

1. Goals
The goals of the Paterson Public School No. 15 Travel Plan are:
    a. Identify any issues that impact safety on the key routes used by students
    b. Provide a list of suggestions to improve the travel environment around the school
    c. Identify ways to reduce traffic congestion
    d. Categorize the suggestions in terms of cost and time needed to make repair
    e. Implement solutions to encourage more students to walk and bike to school

2. Task Force

This School Travel Plan is the product of a productive partnership. The Paterson Public School
No. 15 SRTS Task Force came together through the involvement of local stakeholders. Including
the community is an important part of ensuring the sustainability of the SRTS initiative and the
enactment of the Action Plan.

3. Community Barriers to Health

In partnership with the North Jersey Health Collaborative, the Passaic County Committee, as
part of their 2016 Community Health Needs Assessment, identified five priority issues:

1. Access to HealthCare
2. Caregiver Health
3. Heroin
4. Diabetes
5. Cardiovascular Disease

                                                4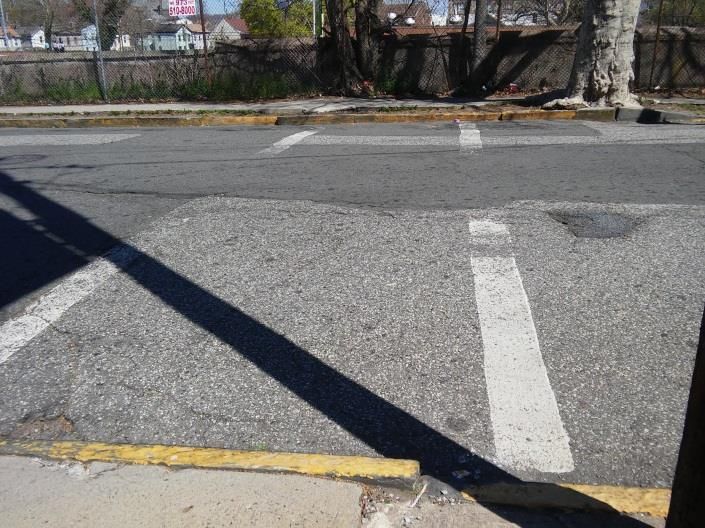
4. School Travel Data
In June 2015, the Paterson Public School No. 15 teachers conducted a School Travel Tally to
determine how students travel to and from school. On average, 53 percent of students walk to
school, 22 percent of students are driven to school, 3 percent carpool, 20 percent use the
school bus, and 1 percent of students ride bicycles to school.
5. Barriers and Opportunities Identified for Safer Walking & Biking
The Safe Routes to School Task Force, and Community Partners from the City of Paterson
conducted a walkability assessment of the road conditions around Paterson Public School No.
15 on May 19, 2016. The major intersections near Paterson Public School No. 15 include:
Market Street and Rosa Parks Street.
Key opportunities for street and safety improvement around Paterson Public School No. 15
include: restriping high visibility crosswalks, fixing or installing truncated dome pads, repairing
or installing sidewalks, enforcing owners to keep sidewalks clear and clean, repairing roadways,
painting high visibility crosswalks, and making repairs/improvements to the basketball court
and park.
6. Action Plan
The Safe Routes to School program categorizes the Action Plan into the “Five E’s:” Education,
Encouragement, Enforcement, Evaluation and Engineering. This is a useful tool because it helps
the school prioritize next steps. In a particular community, some of the E’s may be more
urgently needed than others, so the school can execute the recommendations in any order they
choose. This School Travel Plan recommends a number of improvements that can be made to
encourage safe walking and biking. The action plan can be used to support SRTS and other
Federal or State grant applications to fund municipal roadway improvements.
Key Actions/Recommendations in Action Plan include:
Repair or install sidewalks along Essex St., Main St., Oak St., Pennington St., Parkway
Slow traffic speeds around the school
Ensure property owners or city maintain property (owned and abandoned)
Ensure adherence to parking rules on Essex St., Market and Summer St., Oak St., Main
St., Pennington St., Rose St., and Parkway
Install pedestrian lighting around Oak Street, the Basketball Court, and the Park
Paint high visibility crosswalks at Essex St. & Summer St., Market St. & Summer St., Oak
St. & Main St., Oak St. & Pennington St., Market St. & Pennington St.
Installing or repairing curb ramps at Essex Street and Summer Street, Oak Street and
Main Street, Parkway and Seeley Street
Repairing Oak Street, Main Street, Parkway and Seeley Street
Installing truncated domes at Essex Street & Summer Street, Oak Street & Main Street
5
1. Walking and Cycling to Health
1.1 The Challenge

Over the past few decades, a number of societal and environmental changes have limited
children’s access to safe places where they can walk, bike and play. For example, increased
traffic, neighborhoods that lack sidewalks and urban sprawl have contributed to a sharp decline
in the number of students who walk or bike to school. Nationally, while 42 percent of children
walked or biked to school in 1969, only 13 percent of children did so in 2001. Additionally, the
popularity of television and video games as a means to entertain children has contributed to a
more sedentary lifestyle. As a result, children and adolescents are less physically active than
they were several generations ago.

The decrease in walking and biking to school and fewer physical forms of play has resulted in an
alarming increase in childhood obesity. During the past four decades, the obesity rate for
children ages 6 to 11 has more than quadrupled (from 4.2 to 17 percent), and the obesity rate
for adolescents ages 12 to 19 has more than tripled (from 4.6 to 17.6 percent) in the United
states.

Developing policies and practices to address these environmental and social barriers to daily
physical activity are critical to reducing and preventing obesity among children. Supporting
“active transport” (or walking and bicycling) to school presents an excellent opportunity to
increase daily physical activity among youth. 1

1.2. The Program

Safe Routes to School (SRTS) is a federal program that encourages, teaches and enables
children to safely bicycle and walk to school. The program aims to help children be more
physically active with the intent to reduce chronic disease and prevent and reduce obesity.
SRTS focuses on increasing the number of children walking and bicycling to school by building
and repairing infrastructure such as sidewalks, crosswalks, and bicycle lanes. The program also
encourages changes in travel behavior, supports increased enforcement of traffic laws around
schools, and educates communities on the benefits and safety aspects of active transport. This
report summarizes research on active transport to school, physical activity levels and health
outcomes. It also explores the factors that influence walking and biking to school, including the
impact of SRTS programs.

In the 2013 book, Designing Healthy Communities, Dr. Richard Stockton and Stacey Sinclair note
that “walking to school is good for children’s cognitive health and learning ability. It improves
children’s concentration, boosts moods and alertness, and enhances memory, creativity and
overall learning”.

1
    Walking and Biking to School, Physical Activities and Health Outcomes, Robert Wood Johnson Foundation
                                                         6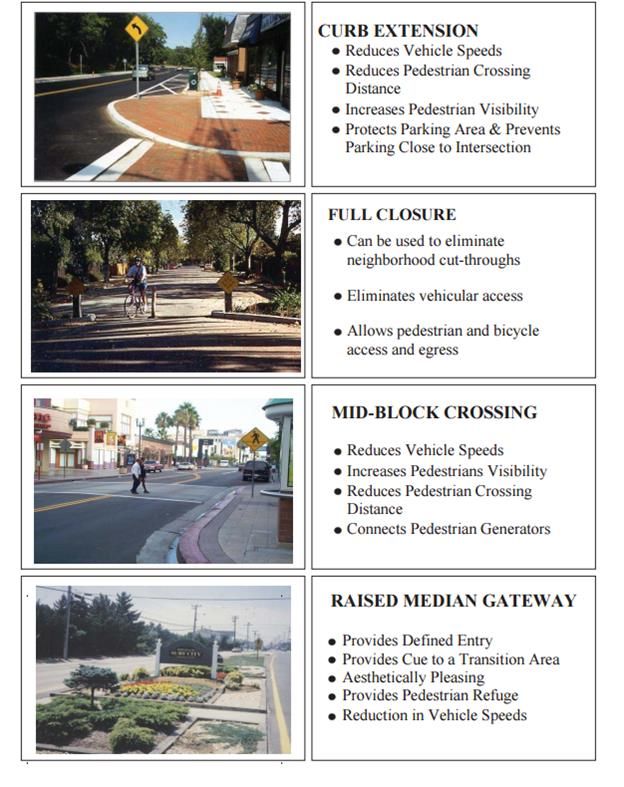
The SRTS Program is a collaborative effort of multiple stakeholders that include community
members, elected officials, city planners, and police departments. SRTS brings a community
closer together by implementing programs such as walking school buses, walkability
assessments, bicycle rodeos and pedestrian safety presentations. The benefits of SRTS extend
far beyond the schools into the community as a whole.

An SRTS Walkability Assessment and School Travel Plan “maps out” specific ways to improve
pedestrian and bicycle travel to increase the number of students who walk and bike to school
and to improve safety. A School Travel Plan is a report about the Walkability Assessment and
identifies the following:
   ●   Where students currently walk and bike?
   ●   Where students would walk and bike if they could?
   ●   What changes need to be made so that students can and will walk and bike to school?

The School Travel Plan identifies short term solutions for immediate action and implementation
as well as long term solutions that may require planning and additional funds. Benefits of
developing a School Travel Plan include:

   ●   Creating partnerships between the school and surrounding community
   ●   Generating ideas and actions so walking and bicycling is safer
   ●   Building community excitement and support
   ●   Making an application for a SRTS grant more competitive by demonstrating a
       connection between goals, actions and targets.

1.3. The Team
The New Jersey Department of Transportation (NJDOT) funds and administers the SRTS
program in New Jersey, and the Voorhees Transportation Center (VTC) at Rutgers’ University
provides technical and administrative support.

EZ Ride and SRTS

In New Jersey, Transportation Management Associations (TMAs) have taken the lead in
coordinating the implementation of the SRTS programs. TMAs are non-profit organizations
whose mission is to implement transportation programs and services like carpools, vanpools,
shuttles, biking and walking that reduce congestion and improve air quality. EZ Ride is one of
eight Transportation Management Associations (TMAs) in New Jersey and primarily serves
Bergen, Essex, Monmouth, Passaic and Union counties.

EZ Ride initiated SRTS programming in Paterson in 2014. EZ Ride members presented to
students at School No. 15 in February 2014, at Dale Avenue Elementary School, and Frank
Napier Academy School No. 4 in 2014-15. More recently, the team provided a Pedestrian Safety
Presentation at Paterson School No. 28 to 200 Pre-K- grade 3 students in January 2016. The
team returned to School No. 28 in March 2017 to present to approximately 320 students.
                                                7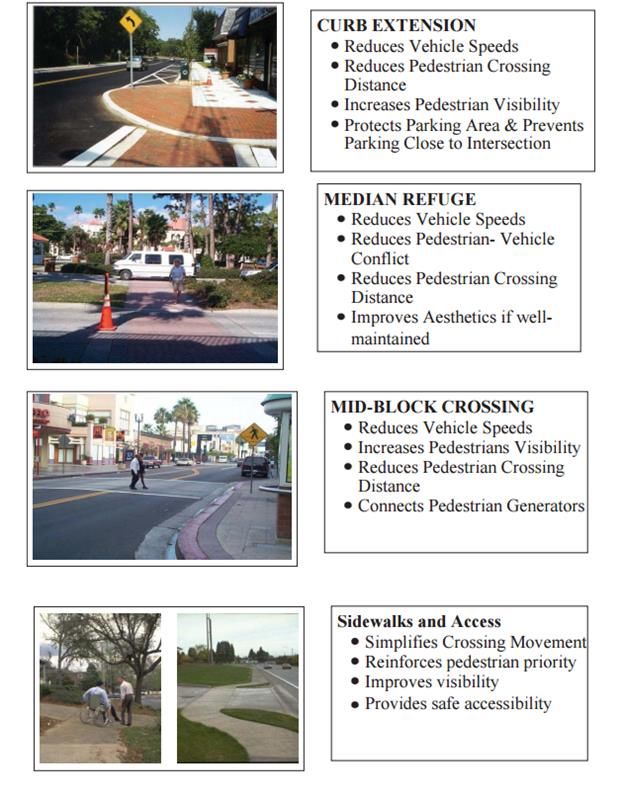
EZ Ride helped the District pass an SRTS policy in 2020 and also made SRTS pedestrian and bike
    safety presentations to students at Paterson Schools No. 5, 10, 12, 13, 16, 21, 25, Roberto
    Clemente Elementary, and New Roberto Clemente Middle School in the 2019-20 academic
    year.

                         Paterson Public School No. 15 Travel Plan Task Force
            Organization           Role/Responsibility                      Contact

Paterson Public School No. 15       Program Activity       Ramona Garcia
                                    and Implementation     Principal
                                                           Paterson Public School No. 15
                                                           98 Oak Street Paterson, NJ 07501
                                                           rgarcia@paterson.k12.nj.us
SRTS Champion                       Program Activity       Yesi Alejo
                                    and Implementation     Full Service Community School Coordinator
                                                           School 15
                                                           98 Oak Street Paterson, NJ 07501
                                                           T:973-321-0150 ext 21504
                                                           yalejo@paterson.k12.nj.us
EZ Ride -                           SRTS Program           Lisa Lee
                                    Assistance,            Deputy Director
Transportation Management                                  Safe Routes to School Regional Coordinator
Association                         Community              EZ Ride
                                    Resource, Safety       144 Park Place East Wood-Ridge, NJ 07075
                                    Education              201-939-4242
                                                           llee@ezride.org
EZ Ride -                           SRTS Program           Mateusz Pitrus
                                    Assistance,            Safe Routes to School Assistant Coordinator
Transportation Management
                                    Community              EZ Ride
Association
                                    Resource, Safety       144 Park Place East Wood-Ridge, NJ 07075
                                    Education              201-939-4242
                                                           mpitrus@ezride.org
Alan M. Voorhees                    Web- based             Leigh Ann Von Hagen, AICP/PP
Transportation Center               resources, Technical   Senior Research Specialist
                                    Assistance, SRTS       Alan M. Voorhees Transportation Center
                                    Recognition            Bloustein School-Planning and Public Policy
Edward J. Bloustein School of       Program, Helpdesk      Rutgers, The State University of NJ
Planning and Public Policy,         assistance, SRTS       33 Livingston Ave. New Brunswick, NJ 08901

                                                   8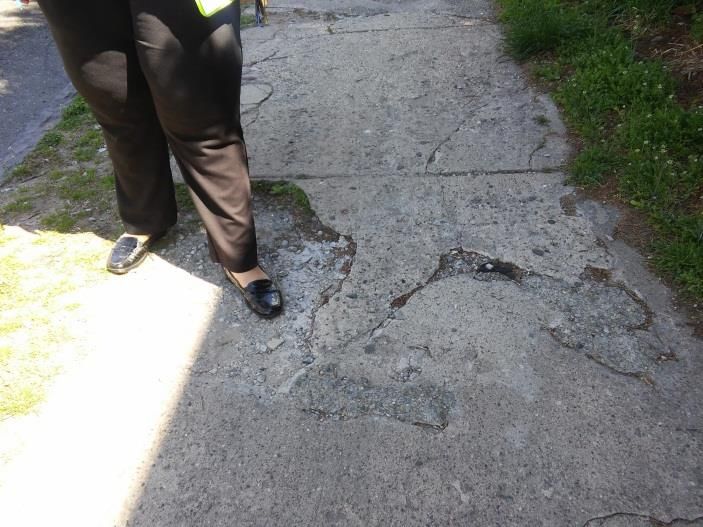
Rutgers The State University of   Tools, Tips and        848-932-2854
New Jersey                        Training               lavh@ejb.rutgers.edu

NJ DOT                            Grant Funding, State   Elise Bremer-Nei, AICP/PP
                                  SRTS Resource. SRTS    NJ Department of Transportation
                                  Best Practices         Office of Bicycle and Pedestrian Programs
                                                         P.O. Box 600 Trenton, NJ 08625-0600
                                                         609-530-2765
                                                         elise.bremer-nei@dot.nj.gov

                                                    9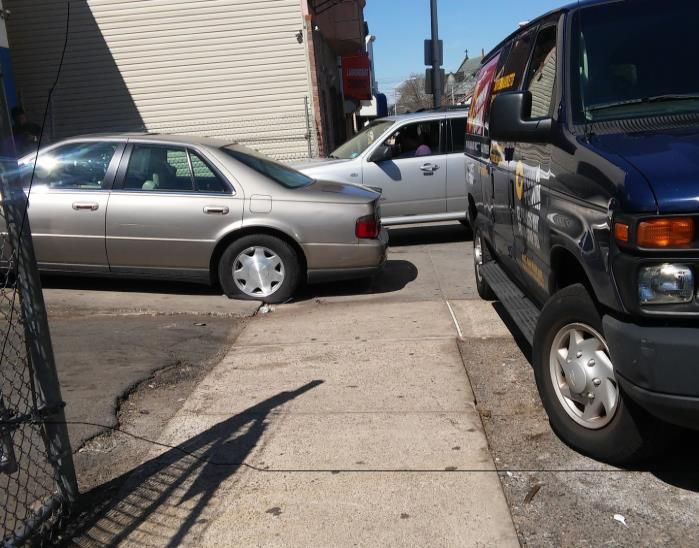
2. District & School Profile

A school profile for Paterson Public School No. 15 was developed using data from the School
District website, the National Center for Education Statistics, New Jersey School Performance
Report, and the Paterson School No. 15 website.

                      Table 1: Paterson School District – Student Demographics
                                                Ethnicity
                                        Hispanic                            18,833
                               Black or African-American                     6,000
                                         Asian                               1,528
                                         White                               1,417
                           Native Hawaiian/Pacific Islander                    0
                           American Indian/Alaskan Native                      0
                                  Two or More Races                            0

                                                Male                       14,333
                                               Female                      13,444

                          Primary (Pre-Kindergarten – Grade 5)             15,700
                              Middle School (Grade 6 - 8)                  5,977
                               High School (Grade 9 - 12)                  6,100
                           Special Needs Students (Gr PK-12)               4,111
          Source: NJ Performance Report, 2018-19

Academic Performance

A District Factor Group (DFG) is an indicator of the socioeconomic status of citizens in
school districts of New Jersey. DFGs were first developed by the New Jersey Department of
Education in 1975 for the purpose of comparing student performance on statewide
assessments across demographically similar school districts. This rating is based on
neighborhood criteria such as poverty rate, incidence of crime and violence, and limited
municipal resources due to low tax revenues. NJDOT has directed that SRTS programs in
disadvantaged communities should be given high priority.

The Paterson School District has been classified by the NJ Department of Education as District
Factor Group “A,” at the very top of the listing indicating that Paterson is one of the most
disadvantaged and underserved communities in NJ.

The NJ School District Performance report notes that only 79.2 percent of Paterson public
school students graduate from High School as compared to the state average of 90.6 to 94.9
percent of high school graduates. Moreover, 67.8 percent of students are economically
                                                        10
disadvantaged, 14.8 percent have learning disabilities, and 24.6 percent are “English as a
Second Language” learners. As shown in Table 2 below, there are two main languages spoken
at home by students at most of the Paterson Public Schools: English and Spanish.
In addition, the District reported that the languages spoken by their students at home include
English at 42.8 percent, Spanish at 49.1 percent, Bengali at 4.1 percent, Arabic at 3.2 percent,
and other at 1 percent.
Table 2: Student Language Diversity (2018 – 2019)
Language Diversity
Percent of students who speak the following languages at home
Spanish 49.1%
English 42.8%
Bengali 4.1%
Arabic 3.2%
Other 0.9%
2. Community Profile
2.1 Paterson and Passaic County Health Profile –Community Health Needs
Assessment
In partnership with the North Jersey Health Collaborative, the Passaic County Committee, as
part of their 2016 Community Health Needs Assessment, identified five priority issues:
1. Access to HealthCare
2. Caregiver Health
3. Heroin
4. Diabetes
5. Cardiovascular Disease
Passaic County is ranked 14 out of 21 Counties for health outcomes in New Jersey according to
CountyHealthRankings.com, and Passaic County is ranked 19 out of 21 Counties in clinical care
according to CHNA 2016.
11Chart 1: Median Household Income for Paterson, NJ
$80,000
$72,222
$70,000
$60,000 $55,755
$50,000
Paterson
$40,000
$31,552 New Jersey
$30,000 United States
$20,000
$10,000
$-
Paterson New Jersey United States
City-Data, 2015
The median household income in Paterson is over $40,000 lower when compared with the
state and approximately $24,000 lower when compared with the United States.
As per the 2016 CHNA, for Passaic County income inequality is at 47% with 13.6 % of the
population living below the poverty level. 18 percent fall beneath the ALICE (asset-limited,
income-constrained and employed) survival threshold.
Access to Care
Chart 2: Health Insurance Coverage Comparison for County, State and United States
120.00%
96.7% 98.1% 98.5%
100.00% 90.5% 92.7% 90.0%
83.5% 80.1%
80.00% 74.2%
60.00%
40.00%
20.00%
0.00%
Passaic County New Jersey United States
Under 18 Years 18-64 years 65 years or over
12American Community Survey-2015
Location of providers, language spoken, cultural competency, hours of service, and health
literacy practices all influence access to care.
Diabetes
In Passaic County 33.3 % of Medicare Beneficiaries have been treated for diabetes, however
only 83.5% of Medicare patients with Diabetes had a blood sugar test in the past year. The age -
adjusted death rate due to hypertensive heart disease is 11.5 per 100,000. Males are more
affected: 13.7 males per 100,000 vs. 9.3 females per 100,000.
Obesity
Chart 3: Obesity Rate in Passaic County – 2015
40.0% 31.2%
30.0% 24.1%
17.2%
20.0% 13.2%
10.0%
0.0%
Passaic County United States
Low-income pre-school(ages 2-4) Adults
CHNA - 2016
While the adult obesity rate is significantly better than U.S average, the preschool obesity rate
is among the worst in the nation. 1 in 4 residents are obese. Increasing levels of physical activity
and encouraging activities such as walking and biking can help /students and residents lose or
maintain weight and lower their blood sugar, blood pressure, and blood cholesterol levels.
Promoting walking and biking can potentially help residents and students with long term health
outcomes.
13Media Viewing Habits & Exercise
The American Academy of Pediatrics recommends that children spend a maximum of two hours
per day on entertainment media like television, computers, and video games. The HHS 2008
Physical Activity Guidelines for Americans recommend that adults get at least thirty minutes of
moderate to vigorous activity daily and that children get at least sixty minutes of moderate to
vigorous physical activity daily.
Passaic County does not offer its residents adequate opportunities for physical activities with a
poor physical environmental ranking of 14. The walkability ranking of Paterson is 81 out of 100
(best) based on Walkscore.com data2.
Access to Fresh Produce
In addition to high obesity rates, Passaic County is above average on child food insecurity and
adult food insecurity. About 24.1 percent of Passaic County children lived in a household that
experienced food insecurity in the past year. There is a lack of large grocery stores in Passaic
and the Farmers Market density is below the U.S. average at 0.01 markets per 1,000 residents
indicating less access to fresh produce.
2
https://www.walkscore.com/NJ/Paterson
14Impact of SRTS
Based on the data above, it is clear that promoting walking and biking to school is a good
method to increase physical activity for students and residents and to reduce the impacts of
obesity and diabetes and to prevent cardiac disease.
2.2 Paterson Public School No. 15
Paterson Public School No. 15 is a public elementary school located in Paterson, NJ. 604
students in grades Pre- K through 5 were enrolled during the 2018 – 2019 school year. Over 71
percent of the students are economically disadvantaged and 41 percent are ESL learners.
Chart 7. Paterson Public School No. 15 Enrollment Data by Grade, Group and Ethnicity
Source: NJ School Performance Report , 2018-19
3. Journey to School
In the 1960s, about 50 percent of children in the United States walked or bicycled to school.
Over the last few decades, concerns about vehicle traffic, safety for the children, and longer
commutes have forced more and more parents to drive their children to school. This results in
more traffic on the road and fewer children who walk to school. Today, on average only about
15 percent of children walk or bike to school. Map 1 provides a two mile area of the residential
area surrounding Paterson Public School No. 15.
15Map 1: Two Mile Area Surrounding Paterson Public School No. 15
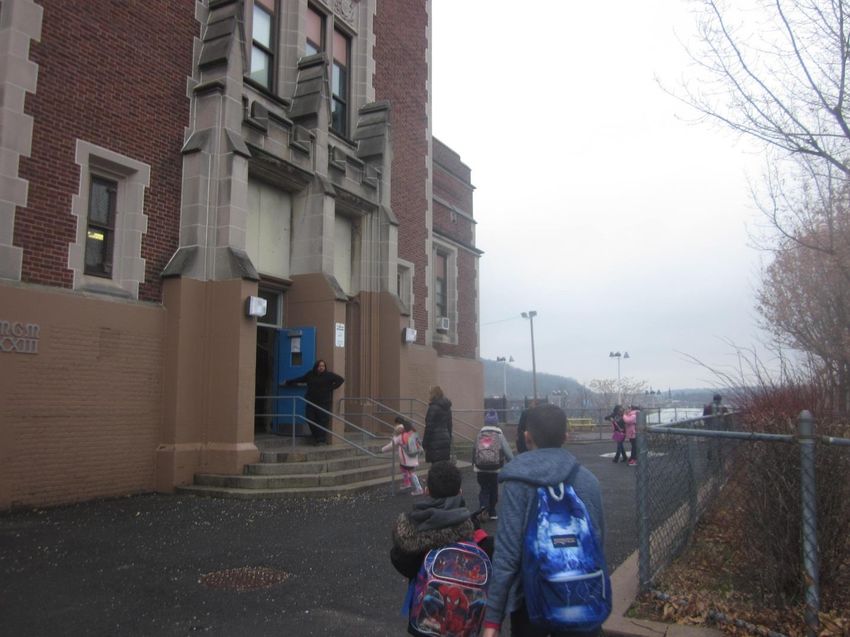
3.1. Current Student Travel Environment
The school is located near the Roberto Clemente Park. One of the routes selected goes through this
same park. The area near the school is mostly residential. The school is only a block away from Market
Street, which is home to several businesses. The school is also very close to Paterson High School and
the New Roberto Clemente Middle School.
16Map 2: Area Surrounding School
School Hours
The school day for students starts at 8:20 am and ends at 3:00 pm Monday through Friday.
Students can attend extended learning programs after school 3:00 pm to 5:00 pm. Only special
needs students receive busing.
Drop-off/Pick- Up Procedure
There is a drop off area for parents and buses designated on Oak Street since it was changed
into a one-way street to alleviate traffic.
Crossing Guards
There is one crossing guard assigned to the Market Street and Pennington Street intersection
near Paterson Public School No. 15.
Student Travel Mode
In June 2016, the teachers at Paterson Public School conducted a Travel Tally to document how
the children get to and from school. Tallies were taken by teachers three times during one
week. A total of 1,918 trips during the morning and afternoon were documented and the data
was analyzed by the NJ Safe Routes to School Resource Center at the Voorhees Transportation
Center, Rutgers University. The bar graph below displays the results from this report.
17As shown in Table 2, the analysis found that 80 percent of children walk to school, one percent
carpool to school, 15 percent are driven in family vehicles to school, and four percent take the
school bus to school. 81 percent walk home, one percent carpool home, four percent ride the
school bus home. No students reported riding bikes to school or home.
Table 2. Current Commute Mode
Mode Arrival Dismissal
Walk 80 percent 81 percent
School Bus 4 percent 4 percent
Driven in personal car 15 percent 14 percent
Public Transit 0.3 percent 0.3 percent
Carpool 1 percent 1 percent
Bike 0 percent 0 percent
183.2 Pedestrian Safety
EZ Ride conducted an analysis of the pedestrian-related accidents within a one-mile radius of
the school over a 10-year period from 2005 to 2015 based on police incident reports. The
reported incidents were plotted on Map 2.
Map 3: Pedestrian Crashes within One Mile of Paterson Public School No. 15, 2005-15
Source: Plan4Safety 2005-2015 Crash Data, Googlemaps, Freemaptools.com
Paterson School No. 15
Pedestrian Crash Location
19Table 3. Pedestrian Crashes by Age, In Paterson (2005-2015)
Age 2005 2006 2007 2008 2009 2010 2011 2012 2013 2014 2015 Total Percent
0-10 41 42 35 36 36 29 9 4 4 7 14 257 13%
11-17 50 40 37 34 38 29 13 5 10 8 16 280 15%
18-35 50 66 53 79 58 56 42 20 16 34 38 512 27%
36-60 72 67 68 80 85 72 45 19 27 58 61 654 34%
60+ 17 28 21 20 24 34 9 1 9 13 40 216 11%
Total 230 243 214 249 241 220 118 49 66 120 169 1,919 100%
For Paterson, there were 1,919 pedestrian crashes between the years 2005 - 2015. On average
there were approximately 174 pedestrian crashes per year. While the majority of the crashes
(approximately 72 percent) involved pedestrians aged 18-60, approximately 28 percent (537) of
the total incidents involved children in the 0-17 age group.
3.3 Walkability Assessment
A Walkability Assessment evaluates the sidewalks, roads, crosswalks, lighting, signs, signals, and
walking environment along a predetermined route. A walkability assessment identifies road
improvements that can be made and notes what is currently done well. The SRTS Task Force
took photos of areas on the route. Comments and recommendations are listed with each photo
and are summarized in the Action Plan at the end.
The community assessed two different routes near Paterson Public School No. 15. Map 4 shows
the walking routes which were assessed.
20Map 4: School 15 Walkability Assessment Overview
211. Common Problems
1.1 Crosswalks need to be seen to alert drivers that pedestrians are crossing. High visibility
crosswalks provide greater safety for students crossing streets
No Visible Crosswalks
Low Visibility/Faded Crosswalks
Route 1
Route 1
- Essex Street and Summer Street (across
- Essex Street and Summer Street (across
Summer Street)
Essex Street)
Route 2
- Market Street and Summer Street
- Oak Street and Pennington Street
Route 2
- Parkway and Seeley Street
- Oak Street and Main Street
- Market Street and Pennington Street
- Market Street and Rosa Parks Boulevard
- Market Street and Southard Street
221. Common Problems
1.2 Truncated Dome pads are designed to aid visually impaired pedestrians and alert them
that they are leaving the safety of the sidewalk and entering the street. Their alignment
provides direction for pedestrians to use the crosswalk and arrive safely at the opposite
corner. The Americans with Disabilities Act (ADA) requires that new construction include curb
ramps for those in wheelchairs and truncated dome pads for blind or visually-impaired
pedestrians.
Misaligned Truncated Dome Pad
No Truncated Dome Pads
Route 1
Route 2
- Essex Street and Summer Street
- Oak Street and Main Street
- Market Street and Summer Street
- Oak Street and Pennington Street
- Parkway and Seeley Street
231. Common Problems
1.3 Sidewalks should provide a safe and accessible place for pedestrians to walk. Width,
surface quality and obstructions impact pedestrians’ ability to travel. Those using wheelchairs
are especially concerned about sidewalk quality. It’s important to consider sidewalk surface
and width in areas frequented by seniors and veterans who use wheelchairs/scooters.
Cracked, Uneven Sidewalk
Route 1 Narrow Sidewalk
-Essex Street Route 1
- Essex Street
Route 2
- Market Street (electrical box)
- Main Street next to School #15 (sidewalk
ends; rocks and dirt are tripping/slipping Route 2
hazards)
- Oak Street, behind School No. 15
- Oak Street
- Pennington Street
- Pennington Street
- Parkway and Seeley Street
241. Common Problems
1.4 Curb Ramps: Ramps provide access for those in wheelchairs /using strollers to access the
sidewalk and street. Street quality also impacts pedestrian travel.
No Curb Ramp/ No level area before curb
ramp
Route 2
- Oak Street and Main Street
- Parkway and Seeley Street
251. Common Problems
1.5 Other issues: Some issues impact how pedestrians feel about their neighborhood and
safety. Pleasant surroundings and good pedestrian lighting promote more walking.
Litter Abandoned Lots/Property
Route 1 Route 2
- Essex Street - Main Street behind School No. 15
- Market Street and Summer Street (broken - Rose Street
hydrant, garbage)
- Parkway
Route 2
- Market Street and Southard Street
- Main Street next to School No. 15
- Oak Street
- Pennington Street
- Market Street and Rosa Parks Boulevard
- Market Street and Southard Street
- Rose Street
- Parkway
261. Common Problems
1.5 Other
Miscellaneous Roberto Clemente Park & Basketball Court
Route 2 Route 1
- Oak Street and Pennington Street: School - Asphalt is broken and cracked leading to
Zone sign outdated mustard yellow color court
- Market Street: Vehicle (above) has flat - Steps leading to park are in disrepair and
tire and is blocking sidewalk. Dark blue van present falling risk at Rosa Park Street
is also parked on sidewalk entrance
- Market St. & Southard St.: green Toyota - The asphalt path in the park is uneven in
parked blocking crosswalk areas, littered with garbage, and covered
with debris and/or sticks
- Market Street: cars parked partially on
sidewalk - Main Street entrance is littered with
garbage
-Rose Street and Parkway: cars parked on
lot - Walls are covered with graffiti and can be
repainted
274. Action Plan & Recommendations
The Safe Routes to School Action Plan is organized into the “Five E’s”: Education,
Encouragement, Enforcement, Engineering and Evaluation. Additionally, each element of
the Action Plan considers two parameters – time and cost as shown below. Together, they
comprise a set of directions to help the community prioritize their action steps to increase
safety for students. The tables below identify preliminary recommendations specific to the
Paterson Public School No. 15 and its immediate area. To realize the full benefit of the SRTS
program, it is suggested that this School Travel Plan be used to apply for infrastructure
grant funds to fully implement all the action steps. A grants list is provided in Appendix B.
Timeframe Definition Cost Definition
Short-term = less than 3 months Low = Less than $2,000
Mid-term = between 3 to 6 months Medium = between $2,000 and $10,000
Long-term = longer than 6 months High = more than $10,000
1. Education: Programs to educate students, parents and the public about safe walking
and biking
Education Actions Responsibility Time Frame Cost
Invite EZ Ride to provide SRTS bicycle and School, EZ Ride Short-term, Mid- No cost
pedestrian safety presentations, and bike skill term, Long-term
events to students in all schools annually
Reinforce bus/drop off/pick up procedures via School Short-term, Mid- No cost
Robo Call and school news in September and term, Long-term
January annually
Create and update Family Handbook that School, District, Long-term No cost
supports walking/biking to school, and defines Parent Liaison,
arrival/dismissal procedures with map and
text that defines drop-off/pick-up areas, anti-
idling law, and rules for driving on local streets
in school zone
Invite speakers from NJ Transit Rail Safety School, EZ Ride Short-term to Mid- No cost
Education Program to present at all schools term
Conduct “Drive Safe and Slow” Campaign School, City Short-term, Mid- No cost
twice a year. Notify parents/guardians and term, Long-term
school staff by publishing
information/updates in the Parent/Family
Handbook, School Newsletters and website
Ask Police Department to give a talk re driving Police, School, Short-term, Mid- No cost
safety and Street Smart tip cards to parents PTO, term, Long-term
28at Back to School Night or PTO meetings
Integrate walking and bicycling safety School/PE staff, EZ Short-term, Mid- No cost
education into classroom PE/Health Ride term, Long-term
curriculum (can invite EZ Ride)
Leverage Social Media to promote walking School RN, Tech Short-term, Mid- No cost
and bicycling for health, spread awareness of Team, PTO, term, Long-term
school zone and enforcement activities, and Community
to provide anti-idling law education to parents
to reduce asthma, community members,
delivery trucks/commercial vehicles
2. Encouragement: Programs to encourage or promote walking and biking
Encouragement Actions Responsibility Time Frame Cost
Hold student poster contest on Walking School, EZ Ride Short-term No cost
and Biking to school
Circulate School Travel Plan Report via School, PTO Short-term No cost
School website and PTO meetings
Host Bike/Walk to School Days throughout School Health Short-term, Mid- No cost
the school year Council PTO, term, Long-term
Participate in International Walk to School School Health Short-term, Mid- No cost
Day in October, National Bike to School Council, PTO, EZ Ride term, Long-term
Day, and NJ Walk and Bike to School Day
Utilize the school website to advance Safe School Tech Mid-term, Long- No cost
Routes to School safety messages Coordinator term
Adopt Complete Streets and implement City, BOE Short-term, Mid- No cost
SRTS District Policy to promote term, Long-term
walking/biking and ensure all road projects
and maintenance comply. SRTS policy
removes District liability
3. Enforcement: Activities to improve safety and security for those walking and biking
to school
Enforcement Actions Responsibility Time Frame Cost
Conduct bicycle registration at Back to School, Police Short-term, Mid- No cost
School night term, Long-term
Investigate EZ Ride training to recruit School Liaison, PTO, Mid-term, Long- No cost
parent volunteers to develop Walking Police, EZ Ride term
School Bus and have parents watch out for
kids’ safety while walking
Ask police to set up radar signs that post Police Department, Short-term, Long- No cost
drivers speeds and remind people to not School Safety Liaison term
29speed as it’s school zone – do this 3x/year
in Sept., Jan., and May
Investigate and slow traffic speeds around Police Short-term, Mid- Low
the school term
Ask City to post police near school routes Police, School, City Short term No cost
to give tickets to speeding and double Mid term
parked vehicles and those parked on Long Term
sidewalks quarterly
Ensure property owners or city maintain City Police Short-term – Long No cost
property (owned or abandoned) and Term
ensure adherence to parking rules on Essex
Street, Market and Summer Street, Oak
Street, Main Street, Pennington Street,
Rose Street, and Parkway
4. Engineering: Infrastructure upgrades that improve walking and biking environment
Engineering Actions Responsibility Time Frame Cost
Install bike racks and skateboard racks School Mid-term, Low
near school entrance
Paint “SLOW SCHOOL ZONE ” on City or County Short-term Low
roadways surrounding school Engineering/Planning
Add radar speed limit, pedestrian City or County Short-term Low
crossing signs where needed at outskirts Engineering/Planning
of school zone
Repair or install sidewalks at the along City, County or State Mid-term, Long- Medium-
Essex Street, Main Street, the Basketball Engineering/Planning, term High
court, Oak Street, the path in the Park, Police
Pennington Street, Parkway, and Seeley
Street
Install pedestrian lighting at intersections City or County Mid-term, Long- Medium
where kids frequently cross near the Engineering/Planning, term – High
school, Oak Street, the Basketball Courts, DPW
and by the Park
Add bike lanes or share the road City or County Mid-term, Long- Low
markings/signs Engineering/Planning, term
DPW
Paint or Repaint high visibility crosswalks City or County Short to Mid-term Low -
at Essex Street and Summer Street, Engineering/Planning, Medium
Market Street and Summer Street, Oak DPW
Street and Main Street, Oak Street and
Pennington Street, Market Street and
30Pennington Street, Parkway and Seeley
Street
Installing or repairing curb ramps at Essex City or County Short to Mid-term Medium-
Street and Summer Street, Oak Street Engineering/Planning, High
and Main Street, Parkway and Seeley DPW
Street
Repairing Oak Street, Main Street, City or County Short to Mid-term High
Parkway and Seeley Street Engineering/Planning,
DPW
Fixing or installing truncated dome pads City or County Short to Mid-term Medium
at Essex Street and Summer Street, Oak Engineering/Planning,
Street and Main Street, Oak Street and DPW
Pennington Street, Park way and Seeley
Street
Add pedestrian signal heads and push City or County Short to Mid-term Low to
buttons or rapid flashing beacon signals Engineering/Planning, Medium
where there is heavier traffic DPW
Repaving/ repairing paths and repainting City DPW Short to Mid-term Medium
walls at the Basketball court
5. Evaluation: Efforts to monitor and evaluate progress towards the achievement of SRTS
goals
Evaluation Actions Responsibility Time Frame Cost
Continue to conduct student travel tallies School, District, EZ Ride Mid-term, Long- No cost
every year to measure how effective the term
SRTS program has been to increase the
number of students walking, biking or
carpooling
Determine if Complete Streets and SRTS City, District Mid-term, Long No cost
policy has been implemented and to term
what degree
Survey parents and students to see if School, District, No cost
they feel safety is better Wellness Council
Improve communications between school PTO, Parent Liaisons, Short-term, Mid- No cost
officials and families establishing a School Tech term, Long-term
convenient mechanism to share Coordinator
information and get feedback
31Conclusion
Community priorities around Paterson Public School No. 15 are safety for students and
reducing the speed of traffic in the school zone by adding more high visibility striped
crosswalks, SLOW SCHOOL ZONE pavement markings, radar speed limit, and school zone signs.
Repairing damaged roadways and sidewalks is crucial to promote safe walking for students and
residents. Adding high visibility striping and crosswalks needs to be done as soon as possible as
the assessment revealed that school zones and crosswalks are not visually evident for drivers
and there have been many pedestrian crashes in the vicinity of the school zone. Other
suggested improvements include enforcing parking laws and ticketing vehicles who are
obstructing sidewalks and adding bike lanes.
EZ Ride is proud to work with the community to improve safety and bring SRTS educational and
encouragement programs to the schools. The school community’s desire to collaborate to help
protect students and encourage safe walking and bicycling is admirable and deserves support.
This School Travel Plan was prepared for Paterson Public School 15 and it is hoped the school
will continue to schedule biking and pedestrian safety programs for students in the coming
years. This report can be used by the District, County or City to apply for SRTS infrastructure
grants, Transportation Alternatives Set-Aside Program (TAP) grant, or other DOT/safety grants
(Bikeways, Safe Routes to Transit) to make the sidewalks and neighborhood safer for students
and residents to walk and bike in Paterson.
32Appendix A
Typical Opportunities for Improvement
33Typical Bicycle/Pedestrian Treatments
34Typical Bicycle/Pedestrian Treatments
35Typical Bicycle/Pedestrian Treatments
36Typical Traffic Calming Devices
37Typical Traffic Calming Devices
38Appendix B: Funding and Building Resources to Build Infrastructure
Source: Together North Jersey (TNJ): Funding and Resources Database
https://togethernorthjersey.com/?page_id=24974#home/
Program Name Program Description Eligibility Eligibility Source
Description
21st Century To provide municipalities and New Jersey County, New Jersey
Redevelopment counties with the funding municipal or county Municipal Economic
Program necessary to redevelop "stranded governments, and Development
assets," which are underutilized redevelopment Authority
or vacant office or retail spaces, agencies
usually located far from transit
Biking in New NJDOT offers engineering New Jersey Municipal New Jersey
Jersey - guidelines, a Master Plan for communities Department of
Planning roadways that are compatible Transportation
Resources with bicyclists and walkers and a
resource center for statewide
projects
Community The Community Development Larger cities and County, US Housing
Development Block Grant (CDBG) program is a urban counties Municipal and Urban
Block Grants flexible program that provides Development
communities with resources to
address a wide range of unique
community development needs
Congestion To advance readily Local, County, County, NJTPA
Mitigation and implementable and innovative State, and Regional Municipal,
Air Quality projects and services that governments State
Initiatives improve air quality and reduce
Program congestion in the NJTPA's air
quality maintenance and non-
attainment areas
Environmental Eligible entities, including Non-profit County, US EPA
Workforce nonprofit organizations, to organizations and Municipal, Environmental
Development deliver environmental workforce local government Non-profit Workforce
and Job development and job training agencies in organizations Development
Training Grants programs that recruit, train, and communities and Job
place local, unemployed and historically affected Training Grant
under-employed residents with by economic Fund
the skills needed to secure full- disinvestment,
time employment in the health disparities,
environmental field and environmental
39contamination,
including low-
income, minority,
and tribal
communities
Future in NJFIT changed the way NJDOT New Jersey Municipal New Jersey
Transportation does business in New Jersey by Communities. Department of
using a comprehensive and Transportation
cooperative approach to
transportation and land use
planning. Working with
community planners, we can
keep jobs, goods and services
within reach of every New Jersey
citizen and reinvest in our
infrastructure by shaping
transportation to fit into the
environment of our communities
Geraldine R. Funds Arts, Education, no restrictions State, County, Geraldine R.
Dodge Environment and Informed Municipal, Dodge
Foundation Communities initiatives that are Private, Non- Foundation
innovative and promote profit
collaboration and community- organizations,
driven decision making Other
Local Planning Local Planning Services (LPS), an Municipalities Municipal New Jersey
Services office within DCA, works with Department of
communities to achieve local land Community
use and planning goals. As part of Affairs
DCA's commitment to provide
technical assistance to
municipalities, our professional
planning staff offers
comprehensive planning services
at no-cost to local governments.
LPS Can provide a variety of
planning services: master plans
and redevelopment plans, land us
land mapping, economic
development plans, and special
municipal projects
40Neighborhood This program provides direct Municipalities Municipal New Jersey
Preservation financial and technical assistance Department of
Program to municipalities over a three to Community
five year period to conduct Affairs
activities associated with the
preservation of designated
neighborhoods based on
strategic revitalization's plans
within those municipalities.
New Jersey The aim of the initiative is to Non-profit New Jersey
Healthy prevent chronic disease and organizations, Healthy
Communities improve health by advancing Other Communities
Network - environment, policy, and system Network
Community change; and enhancing the built
Grants Program environment to support healthy
eating and active living.
Supported projects are creating a
culture of health by increasing
food access and opportunities for
physical activity in communities,
schools, places of worship, early
care and education,
neighborhoods, and
municipalities.
The Network also facilitates a
statewide community of practice
to share best practices, provide
networking and professional
development opportunities, and
encourage collaboration. Within
this community of practice,
grantees will be connected to
people and organizations with
shared goals and agendas and be
recognized as a leader in building
healthy communities
Our Town The Our Town grant program Communities Municipal National
Grants supports creative place making Endowment
projects that help to transform for the Arts
communities into lively,
beautiful, and resilient places
with the arts at their core.
People for Bikes The People For Bikes Community Communities Municipal People for
41Community Grant Program provides funding across the US Bikes -
Grants for important and influential Community
projects that leverage federal Grants
funding and build momentum for
bicycling in communities across
the U.S. These projects include
bike paths and rail trails, as well
as mountain bike trails, bike
parks, BMX facilities, and large-
scale bicycle advocacy initiatives
Safe Routes to Provides federal and state County, municipal County, New Jersey
Schools funding to projects that enable governments, Municipal Department of
children in grades K-8 to walk and school districts, and Transportation
bicycle more safely to school. schools
Safe Routes to Safe Routes to School (SRTS) is a Communities in County, New Jersey
Schools federal, state and local effort to New Jersey Municipal Department of
enable and encourage children, Transportation
including those with disabilities,
to walk and bicycle to school.
SRTS facilitates the planning,
development and
implementation of projects that
improve safety and air quality, as
well as reduce traffic and fuel
consumption around school
Safe Routes to The Safe Routes to Transit Counties and County, New Jersey
Transit program was established in 2006 municipalities. Municipal Department of
with state funding to enable Transportation
counties and municipalities to
improve safety in the vicinity of
transit facilities and to make
routes to bus stops and rail
stations safer for bicyclists and
pedestrians
Street Smart Communities that participate in Municipalities and Municipal North Jersey
Program the Street Smart Program work to communities in Transportation
raise awareness of pedestrian New Jersey Planning
safety laws by hosting events, Agency
handing out information, and
through social media. Local police
step up enforcement during the
campaign to ensure motorists
42and pedestrians are obeying the
laws. All communities are urged
to participate
Sustainable Sustainable Jersey identifies New Jersey Municipal
Jersey Grants resources to help municipalities municipalities Sustainable
and Resources develop a comprehensive New Jersey
sustainable community program.
This includes financial resources
in the form of grants and
incentives, and technical support
in the form of trainings, access to
support organizations, and
guidance material
43You can also read