Paul Nex1, & Eimear Deady2 - 1 University of the Witwatersrand 2 British Geological Survey
←
→
Page content transcription
If your browser does not render page correctly, please read the page content below
Paul Nex1, &
 Eimear Deady2
1 University of the Witwatersrand
   2 British Geological Survey
What is a Critical Metal /Mineral / Material?
Serious answer: “Critical metals are metals whose availability is essential for high-
technology, green and defence applications, but vulnerable to politically or
economically driven fluctuations in supply. At present, this designation applies
particularly to the rare-earth elements (REE), tantalum (Ta), niobium (Nb), lithium
(Li), molybdenum (Mo) and indium (In)”
(~2010 http://criticalmetalsmeeting.com)

Text in red would not have been in earlier definitions: Any definition depends on the
country you are in, the technology / industry you are interested in, your perceived risk
of future supply, and perceived demand. ALL of these are subject to change. (Nex, 2015).
Critical metals in Africa are not necessarily the same as those in Europe! This has
obvious implications for Global vs National criticality and how it is assessed.

(BTW, What happened to cobalt and graphite!!)

Cynical answer: Any metal or material that can be so declared to enhance the ‘spin’
produced by a junior exploration company OR to increase the chances of obtaining
research funding in the academic environment OR to enable producing companies to
increase prices OR to justify in-depth studies by government departments / NGOs.
What is the “Hype Cycle”
Developed by Fenn (1995)
working for the Gartner Group
to describe the performance of
emerging technologies.

Somewhat “Zen-like” in
terminology

Not really a cycle and doesn’t
predict what happens to the
emerging technology – there is
only one outcome.

Possibly better envisaged as a
feedback loop rather than a
cycle.
A myriad of paths is possible – the peak of inflated expectations could be a blind summit!
Time scales will vary
Hype cycle applied to commodities:
do cmdty prices, share prices and citations reflect the same trends?

Welmer & Dalheimer 2012 Min Dep (Raw Materials)
Looking at world production, world price and also
citations in Web of Science. The results of your labours.
2011 EU Critical Metals List
2010 Senkaku Boat
Collision Incident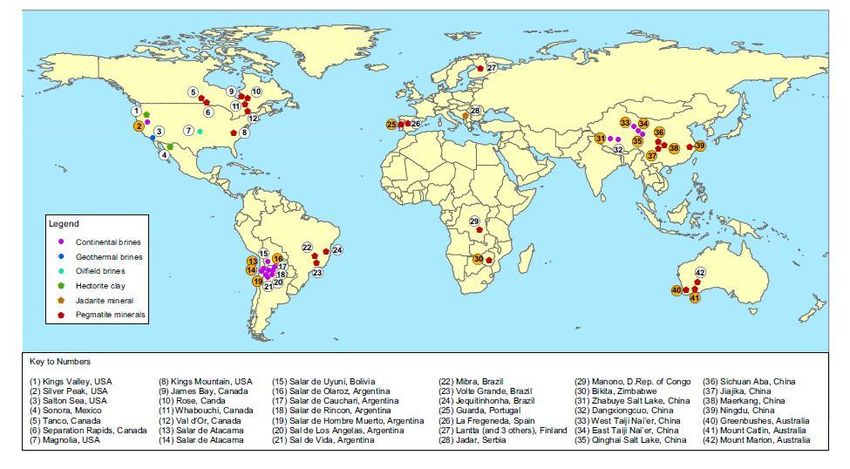
The report that started it all?

                                  EU 2010 Report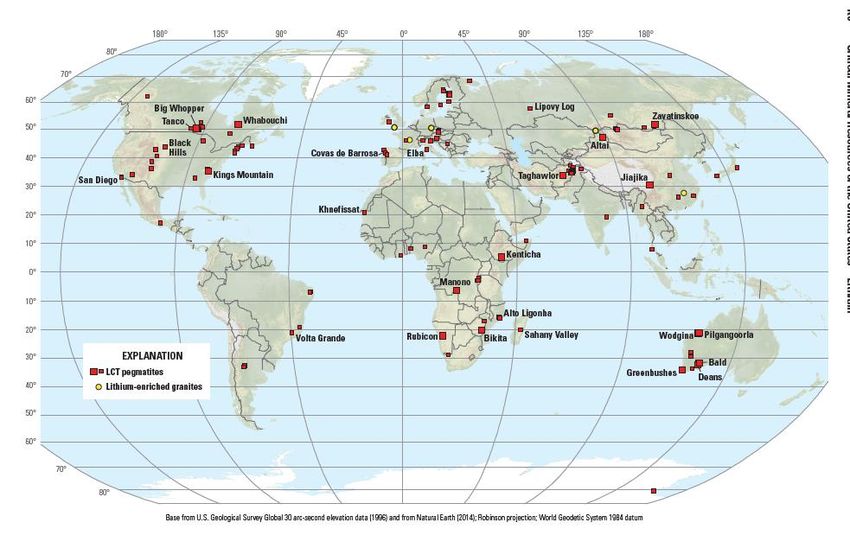
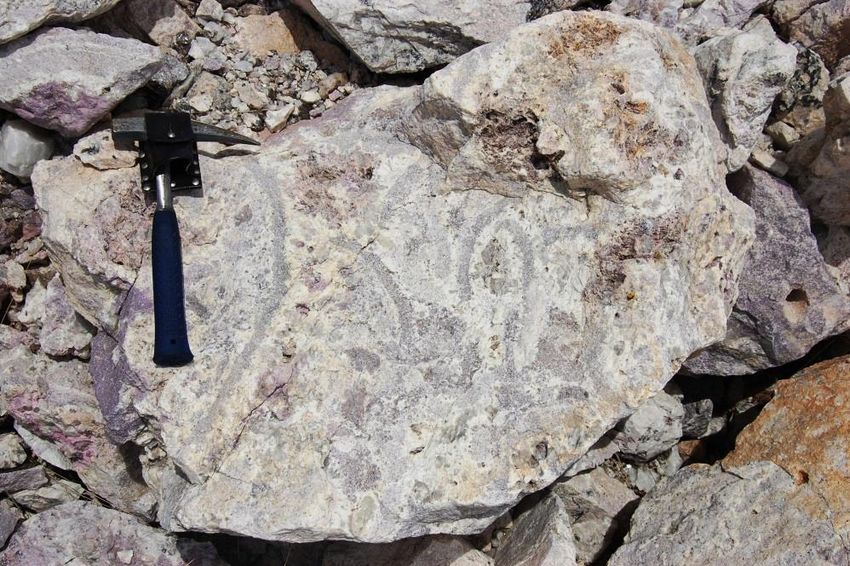
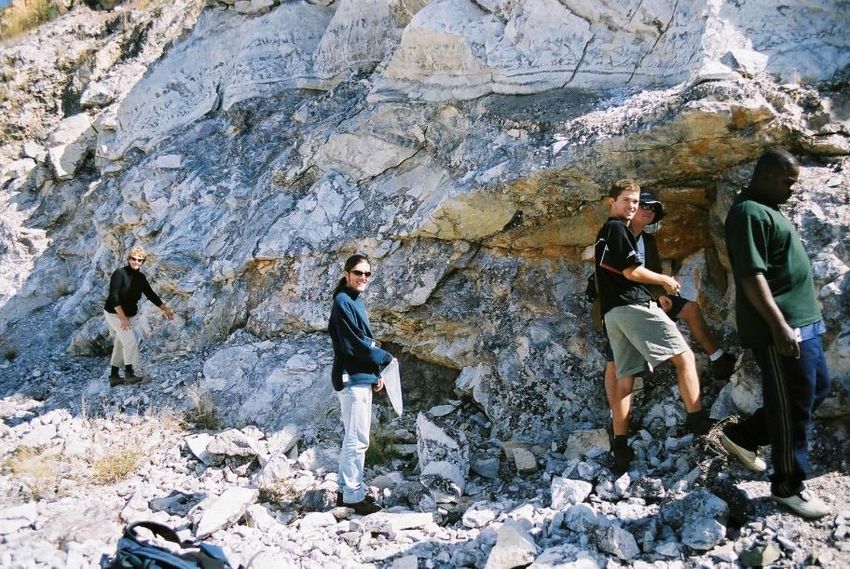
Tantalum
Obtained typically from tantalite;
rare-metal pegmatites (LCT), some
production from pyrochlore in
carbonatites, co-production from
tin deposits until the tin crisis of the
early 1980’s.
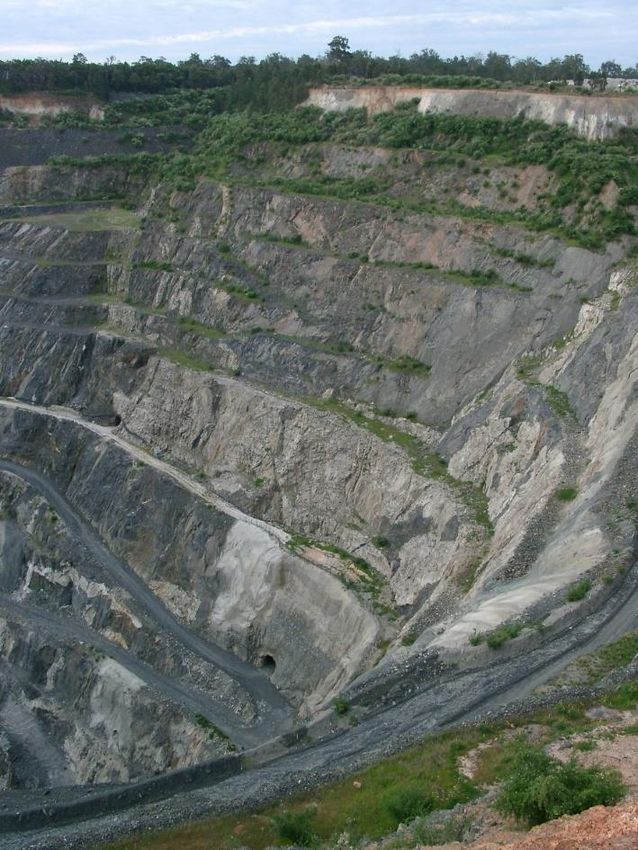
Greenbushes
Principle use in electronic (Australia)
capacitors; cell phones, hard drives,
hearing aids, pacemakers.
Production and price not
transparent – individual contracts
between producers and processors,
Published statistics frequently
combined with niobium.
Until mid-2000’s production
dominated by TANCO (Canada)
and Wodgina / Greenbushes (Sons
of Gwalia, Australia)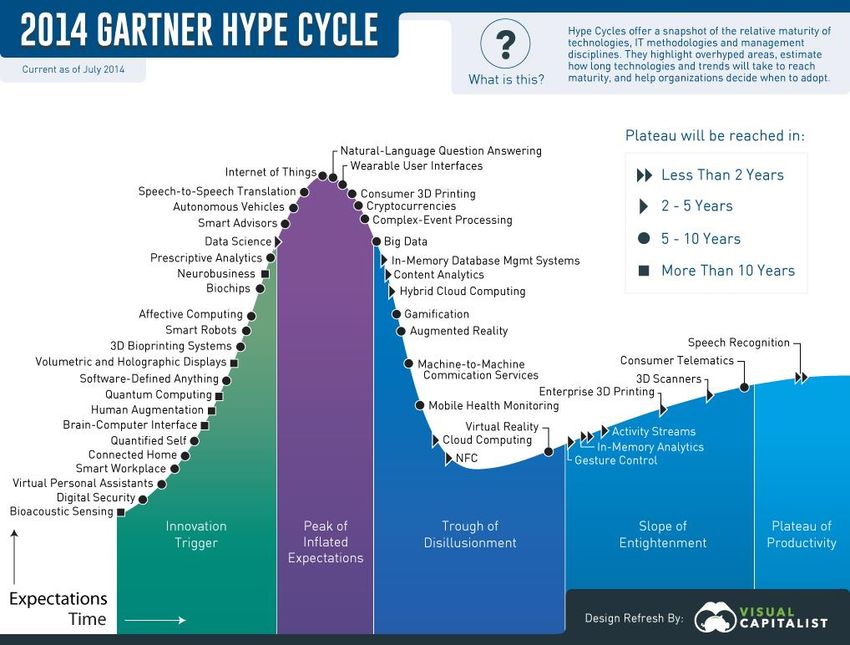
3 hype cycles?
                                                         2004 Sons of Gwalia
                                                         bankrupt

                                                                                 2006-2015 volatility

                   Electronics Industry, Panic buying,
                   Stockpiling (Cunningham 1998)
                                                  1998-2000
                                                  cell phones

                                                         Stockpiles depleted, increased demand

Production Data USGS 2017                                     Price data: metalary.com (1999-present) and USGS 1999 (pre-1998)
According to Roskill (2016) in the
early 2000’s
“rapidly growing demand for
tantalum was based on the wholly
unfounded belief that a tantalum
shortage was imminent.”
Demand decreased, no shortage,
prices tumbled –
Classic “Hype Cycle” Price increases (3rd hype cycle) 2010-2014 probably
due to a combination of factors:
Tanco, Greenbushes and Wodgina closures, Care
& Maintenance (2008-2011), production now
NB: Prices post-collapse gradually dominated by Central African pegmatites
increased and were above pre-hype (Rwanda), reopening of Greenbushes & Wodgina?
levels, production also increased, to
reach – “The Plateau of Designation as a conflict mineral and the Dodd-
Productivity” Frank Act of 2010.
Other new projects are not active mines (yet?)
(Abu Dabbab, Nuweibi, Upper Fir, Kanyika): there
are still plenty of untapped resourcesGreenbushes / Wodgina
DRC
Rwanda
USGS Factsheet, Bleiwas et al 2015 (Only production data, no prices)Combined with Web of Science Citations
REE
Not rare, just difficult to
extract.

1965-1985: Most production
from Mountain Pass                                         Glenover
                                                           (South Africa)
1984: China starts
producing

From 1988: > 80% of the
world’s REE produced in
China

2002: Mountain Pass closes

2010: Senkaku Incident

2012: >200 Junior
exploration companies
looking for REE deposits
                                                   Nkombwa (Zambia)
Castor & Hedrick, 2006; Paulick & Machacek, 2017
Relating the hype cycle and critical metals is not new!!
Hocquard 2010 BRGM Presentation at Ifri Round Table Brussels
(Institute Francais des Relations Internationales)Peak REE Price (2011) Production data from USGS and BGS, Price data from BGS
AFRICAN REE DEPOSITS WITH ESTABLISHED RESOURCES
                (data from Technology Metals Research http://www.techmetalsresearch.com/ 2016)

Deposit              Country        Source              Mt          %TREO         Contained      % HREO
                                                                                  REO (kt)
Ngualla Hill         Tanzania       Carbonatite              195        2.26           4400         0.33

Zandkopsdrift        South Africa   Carbonatite           42.48      2.08-2.28           949        1.69

Tantalus             Madagascar     Ion-adsorbtion        560.6         0.09             561        4.37
                                    Clays
Songwe               Malawi         Carbonatite              31.8     1.38-1.62          469        1.67

Glenover             South Africa   Carbonatite           10.37         2.23             231        1.45

Kangankunde          Malawi         Carbonatite              2.53       4.24             107        0.19

Steenkampskraal      South Africa   Vein                  0.665         14.0              93        1.79

Wigu Hill            Tanzania       Carbonatite              3.3        2.16              61        0.10

Xiluvo               Mozambique     Carbonatite              1.1        2.05              23        1.81

Lofdal               Namibia        Carbonatite              6.16       0.29              18       20.50

Mrima HIll           Kenya          Carbonatite           159.4      3.61-4.40             6        2.20

Added to resource inventories between 2010 and 2016                                                  2015 Nex
Paulick & Machacek, 2017
From 2011-2015 defined mineral resources of REE outside of China doubled:
40 Mt to 98 Mt
Canada 38 Mt
Greenland 36 Mt
Africa 10 Mt
Castor & Hedrick 2006Commodity Prices and Stock Prices show sympathetic trends - unsurprisingly
Galileo Resources (Glenover)
Great Western Minerals (Steenkampskraal)
Molycorp (Mountain Pass)
Mkango Resources (Songwe)
Namibia Critical Metals (Lofdal)
From a commercial perspective timing is everything.
If you miss the first hype cycle you might catch the
next one
Share price graphs from Google Finance Is it a good time to buy REE stocks?Lithium
Bikita
(Zimbabwe)
Obtained from brines or pegmatites
EV’s – Li-ion batteries
Climate Change
Legislation
Rubicon & Helicon (Namibia)Production data from BGS World Mineral Statistics (NB recalculated from mineral data to lithium where necessary). Price data from metalary.com
The Edelson Institute

 The exploration expenditure figures are difficult to quantify but there
 was definitely a hard-rock lithium exploration boom in 2017-2018.
Project       Company                                  Ore        Grade    Contained
                                                                            (Li2O)   LiO2
Zim       Bikita        Bikita Minerals        Kesler, 1978      10.8 Mt    1.4%
                                               Clarke, 2011      10.8 Mt    0.58%
Zim       Kamativi      CAT Strategic Metals   2018 (NI43-101)   26.3 Mt    0.28%    0.073 Mt

Zim       Acadia        Prospect Resources     2017 (SAMREC)     40.5 Mt    1.44%    0.583 Mt

Zim       Zulu          Premier African        2017 (SAMREC)     20.1 Mt    1.06%    0.213 Mt
                        Minerals
Namibia   Helicon &     Desert Lion Energy     Historical        1.1 Mt     1.4%
          Rubicon
DRC       Manono-                              Historical        7.86 Mt    0.76%
          Kitolo
DRC       Manono-                              Historical        35 Mt      0.6%
          Kitolo
DRC       Manono        AVZ Minerals           2018 (JORC)       259.9 Mt   1.63%    4.236 Mt
          Project
Ghana     Egyasimanku   IronRidge Resources    Historical        1.48 Mt    1.66%
          Hill
Mali      Goulamina     Birimian               2017 (JORC)       32.9 Mt    1.37%
                                               2018 (JORC)       103 Mt     1.34%    1.380 Mt
                        Total                                    449.8 Mt            6.412 Mt

The newly determined hard-rock resources in Africa equate to approximately 3
Mt of Li. (Global production of Li is in the region of 80,000 tpa)
Unsurprisingly the same trends are seen in share prices
(Data from Google Finance)
AVZ Minerals
(Manolo)
Birimian
(Goulamina)
Prospect Resources
(Arcadia)
One major effect of the hype cycle is a stimulus to exploration
and an increase in the resource base – this is a GOOD thingUSGS 2017
2016 BGS Lithium Profile
Benson, 2017
Africa is under-represented and where is Bikita?Published Resources and Reserves are not sufficient for forecasting
– although its what we use.
Reserve Base (RB)
RB in Tg (1012 g)
Not Stock-exchange
compliant!!
Resource Base derived
from Upper Crustal
Abundance
Figure from Graedel &
Nassar (2013 GSL SP393)Disruptive Technology
The 4th Industrial Revolution
Buzzwords or Reality – who is going to gamble?
BMW and Daimler, two giants in the automobile sector, are pooling their resources
in a joint mobility effort that spans autonomous cars, ride-hailing, electric scooters,
car-sharing, and electric car charging. The two companies announced on Friday
that their intention is to spend $1.13 billion on the venture, an eye-popping sum
designed to make the rest of the industry sit up and take notice.
https://www.theverge.com/2019/2/22/18235941/daimler-bmw-mobility-joint-
venture-billion-dollars 22nd February 2019
Is it a co-incidence that the potential lack of REE caused tremors in the car industry
– perhaps they don’t want to be caught in an uncertain future again.
How many of you will own a vehicle in 50 years time?Commodity / Critical Material hype cycles reflect short term fluctuations
based on the perception of shortages and often optimistic forecasts of
demand, panic buying and/or optimistic expectations of price increases.
Long term trends are more reliable and provide much better indicators of
growth.
Are you suffering from inflated expectation or wallowing in the trough
of disillusionment.
Perhaps we need to be on the slope of (Scottish?) enlightenment.
Adam Smith James Hutton
(1723-1790) author: The Wealth of Nations (1726-1797)
“The Father of Geology”You can also read