Performance analysis of service users' perception of mobile network quality in the learning settings - IOPscience
←
→
Page content transcription
If your browser does not render page correctly, please read the page content below

Journal of Physics: Conference Series

PAPER • OPEN ACCESS

Performance analysis of service users’ perception of mobile network
quality in the learning settings
To cite this article: A. A Oje and S. O. Edeki 2021 J. Phys.: Conf. Ser. 1734 012032

View the article online for updates and enhancements.

                               This content was downloaded from IP address 46.4.80.155 on 10/02/2021 at 00:32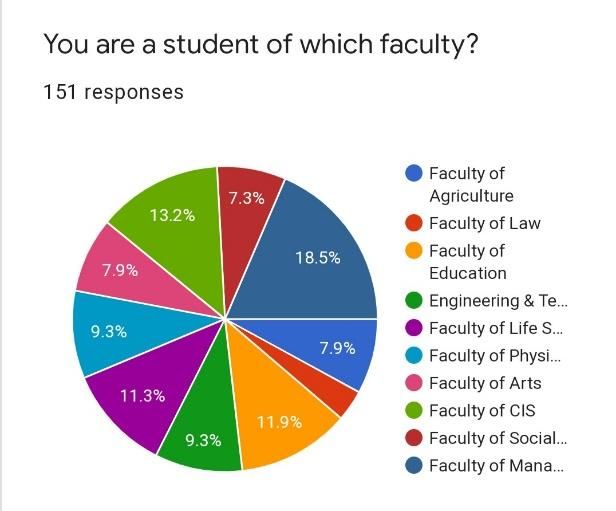
International Conference on Recent Trends in Applied Research (ICoRTAR) 2020              IOP Publishing
Journal of Physics: Conference Series            1734 (2021) 012032 doi:10.1088/1742-6596/1734/1/012032

Performance analysis of service users’ perception of mobile
network quality in the learning settings

                     Oje A. A1 and S. O. Edeki2*

                     1
                         National Space Research and Development Agency, Abuja, Nigeria
                     ,2
                         Department of Mathematics, Covenant University, Ota, Nigeria

                     Contact Emails: oje.aa@outlook.com, *soedeki@yahoo.com

                     Abstract. This paper aims to provide information about the mobile network operators as
                     presented by the users. The research tool used is a questionnaire that was distributed physically
                     as well as online using google forms. One hundred fifty (150) questionnaires were distributed,
                     and 101 recovered. There were 50 respondents online. The results obtained about the number
                     of subscribers per Mobile Network Operator (MNO) reflects the data published by the Nigeria
                     Communication Commission (NCC), this by interpretation, proves the validity of the
                     research data.

                     Keywords: Mobile Network Operator (MNO); Quality of Service (QoS); Cellular Network,
                     User Perception of Network, Questionnaire

1. Introduction
The Internet penetration level has risen geometrically from 2005 to date [1]. This implies that there is a
corresponding increase in the number of people that subscribe to Mobile Network operators all over
the world. Nigeria is not left behind in this growth. The mobile market share, claimed by the Mobile
Network Operators (MNO) is provided to interested readers by the Nigeria Communication
Commission (NCC). The data shows that as of December 2015, the total number of mobile network
subscribers stood at 19,519,154, and by the end of 2018 had risen significantly to over 111 million
subscribers [1]. However, there was a decline in the number of subscribers at the end of 2016. Below
is a graph showing the subscriber level as at March 2019, which is over 173million subscribers. Over
70% of these subscribers are connected to the 4 major Mobile Network Operators [1]. The percentage
of subscribers in Figures 1-2.

              Content from this work may be used under the terms of the Creative Commons Attribution 3.0 licence. Any further distribution
              of this work must maintain attribution to the author(s) and the title of the work, journal citation and DOI.
Published under licence by IOP Publishing Ltd                          1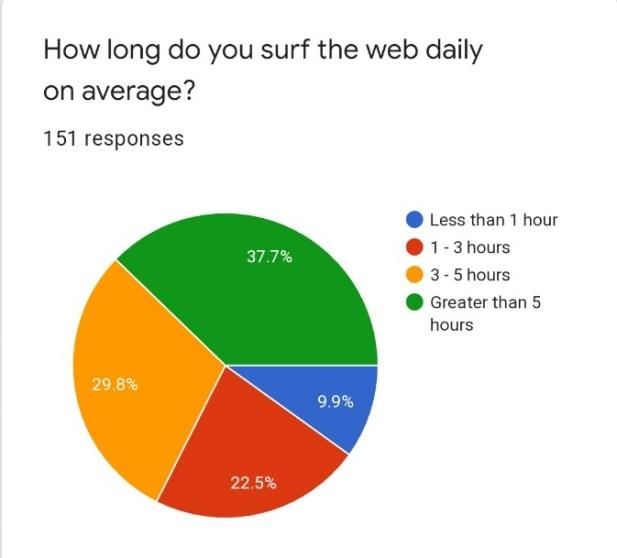
International Conference on Recent Trends in Applied Research (ICoRTAR) 2020              IOP Publishing
Journal of Physics: Conference Series            1734 (2021) 012032 doi:10.1088/1742-6596/1734/1/012032

               Figure 1: Pie chart showing the percentage of subscribers per MNO [1]

                        Figure 2: Graph showing the subscriber teledensity [1]

1.1 Research Motivation
The information they say is power, and according to lots of writings by scholars and projection by
information experts, it is a common saying now that information is the new Oil well of the Twenty-
first Century. Having adequate information about what to do and what not to do serves as a guide and
saves one from unnecessary stress. This is one problem that is common to societies. The population of
Students in the University of Ilorin keeps increasing on a yearly basis and thereby increasing the
number of internet users in various cities of the country. There are four major Mobile Network
Operators (MNO) in Nigeria serving throughout the country of which one chooses at will to subscribe
to whichever network one so desires. A guide can be published per location and will aid user
decisions. It can also be used to track user perception of the network from time to time. Of great

                                                    2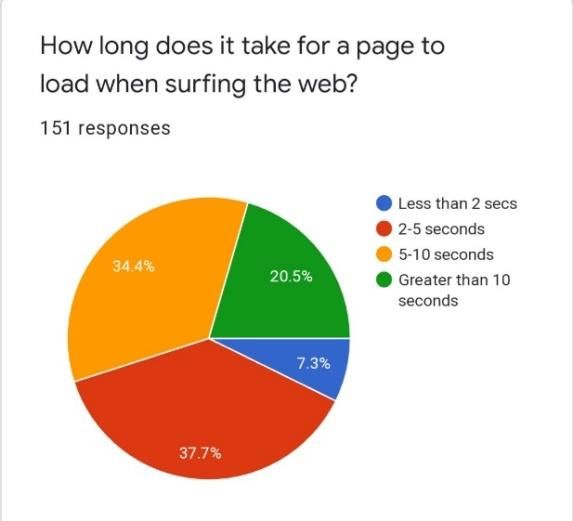
International Conference on Recent Trends in Applied Research (ICoRTAR) 2020              IOP Publishing
Journal of Physics: Conference Series            1734 (2021) 012032 doi:10.1088/1742-6596/1734/1/012032

importance in mobile networking are the quality of services, access to usage, performance evaluation,
effective personnel, and so on [2-19].

2. Overview of Related Network and services providers
A group of researchers highlighted in their own article that QoE can be defined by three pillars. These
pillars include Network Pillar, Context Pillar, and Human Pillar. They hence developed a conceptual
framework to measure QoE of a Cellular Network [2].

Mebawondu and some other researchers did a driving test on the performance of MNOs in the Ondo
State. The wanted to see if the MNOs were performing optimally in the area. The results presented in
the paper showed that the services offered are below the benchmark defined by NCC [3]. One of the
students [1] carried out network testing of the major mobile Network operators of cellular mobile
services. He covered three parts of the school, which are; The Senior Staff Quarters, The Junior Staff
Quarters, and the Main Campus environment. His test was based on a voice call on the 3G network.
He used TEMS Investigation 15 to collect data, then MapInfo and Microsoft Excel for the analysis of
the network quality. At the end of his analysis, he compared the result obtained with the threshold set
by NCC.

3. Methodology

The method of data collection that is adopted must be directed at providing solutions to a problem. It
includes numerical and empirical pieces of evidence, which can be proven right or wrong. Data used
for the analysis in this type of research can either be primary or secondary sources. Qualitative
research requires that the objectives and procedures are carefully designed and planned. Precision,
accuracy, and objectivity are of importance when carrying out quantitative research. Achieving the
above-stated requirements means that specific tools are to be used. These tools include but are not
limited to Microsoft Office Excel, SPSS. The steps involved in the quantitative research include a
Review of existing literature and theory, statement of hypothesis or research questions, Determination
of appropriate methodology and research design, Data collection, Data analysis and interpretation,
Presentation of Results. For this project, Questionnaires were distributed to students physically, and an
Electronic questionnaire was also generated to be sent to students departmental and faculty WhatsApp
group for filling. The questionnaire result gotten was 150 in total. This result was analyzed using
Microsoft Excel.

The following questions were asked from respondents (University of Ilorin Main Campus students)

    i.   Do you get to see 3G, H, H+ or 4G when you switch on your data connection?
   ii.   How long do you surf the web daily on average?
 iii.    How many hours do you spend on social media?
  iv.    How long does it take for a page to load when surfing the web?
   v.    Does your browsing session end abruptly while browsing (out of every 100)?
  vi.    How would you rate the speed at which you browse the web (5 being the highest)?
 vii.    How would you rate the customer service when you call to complain?
viii.    How do you find the data charges (subscription deduction rate)?

                                                    3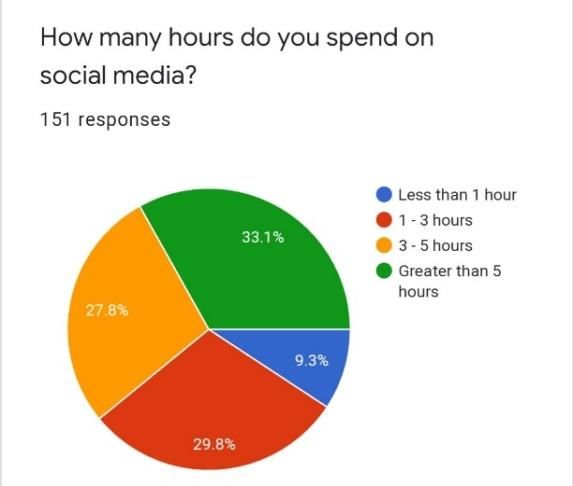
International Conference on Recent Trends in Applied Research (ICoRTAR) 2020              IOP Publishing
Journal of Physics: Conference Series            1734 (2021) 012032 doi:10.1088/1742-6596/1734/1/012032

4. Result Analysis

The following are the results from the questionnaire distributed within the school, as well as from the
responses gotten online. The distribution of results generally from the questionnaire showed that the
highest percentage of results is from the Faculty of Management Sciences, giving 19% of the entire
results. The next hierarchy, with 13% of respondents, is the Faculty of Communication and
Information Science. Other faculty respondents with percentage are Faculty of Life Science with 12%,
Faculty of Education with 12%, Faculty of Engineering and Technology with 9%, faculty of Physical
Science with 9%, Faculty of Arts with 8%, Faculty of Agriculture with 8%, Faculty of Social Sciences
with 7% and lastly Faculty of Law with 3%. The results are presented in Figures 3-11.

                     Figure 3: Image Showing Distribution of respondents by faculty

One of the questions asked is which network the subscribers prefer to use when browsing when they
are in their respective faculty. When analyzed by faculty, the most preferred network to use for
browsing in each faculty is analyzed as follows.

In the Faculty of Engineering and Technology is MTN, followed by Airtel and then GLO. None of the
respondents selected 9Mobile as their most preferred network for browsing. In the Faculty of
Agriculture, the results from the faculty of Engineering and technology are replicated as the largest
portion of the subscribers prefer to use MTN as well, followed by Airtel then GLO. Here also, no one
liked using 9Mobile to browse.

In the Faculty of Arts, MTN took the leading position again with Airtel trailing behind them, and
9Mobile follows. None of the respondents here preferred using GLO to browse when in the faculty
area.

In the Faculty of Communication and Information Science, MTN has the highest share of being the
most preferred network for browsing in that area, followed closely by Airtel. GLO and 9Mobile have
an equal percentage of internet subscribers in this location.

In the Faculty of Education, the result is similar to that of the faculty of Communication and
Information Science as MTN leads, followed by Airtel. GLO and 9Mobile had an equal percentage of
lines by the respondents.

                                                    4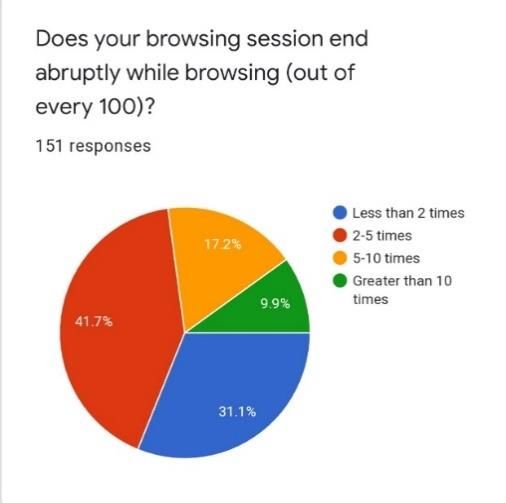
International Conference on Recent Trends in Applied Research (ICoRTAR) 2020              IOP Publishing
Journal of Physics: Conference Series            1734 (2021) 012032 doi:10.1088/1742-6596/1734/1/012032

In the faculty of Law, MTN lead followed by Airtel and 9Mobile with an equal number of respondents
selecting them, Glo was not chosen.

In the Faculty of Life Sciences, again, MTN took the lead, followed by Airtel and then 9Mobile with
the least. GLO was not selected by any respondent here.

In the Faculty of Management Science, which had the highest number of contributions of respondents,
reports here show that Airtel leads as the most preferred network for browsing in the location. It is
followed in second place by MTN. 9Mobile has the least percentage as the preferred network, while
GLO was selected by none of the respondents.

In the Faculty of Physical Sciences, Airtel again took the lead, relegating MTN to second place.
9Mobile was not the choice of any respondents. GLO was chosen as the choice by very few
respondents.

In the Faculty of Social Sciences, Airtel took the lead as the most preferred for internet connectivity.
MTN followed close while 9Mobile and GLO were the least rrespondents'choices.

In summary, MTN led with an overall of 46%, Airtel with 41.3%, GLO with 6.7%, and 9Mobile with
6%. When we compare this result with the NCC published result, we see that it matches perfectly as
MTN and Airtel are the most preferred network for browsing by Nigerians in general.

                              Figure 4: Pie chart showing Network usage

Another Question that was analyzed is the rate at which students of the University of Ilorin surf the
web. The responses from the respondents show that 37.3% of the students spend above 5 hours online,
which was the highest fraction of this category of questions. 30% spend between 3-5 hours surfing the
web, 22.7% spend 1-3 hours online, and 10% spend less than one hour surfing the web.

                                                    5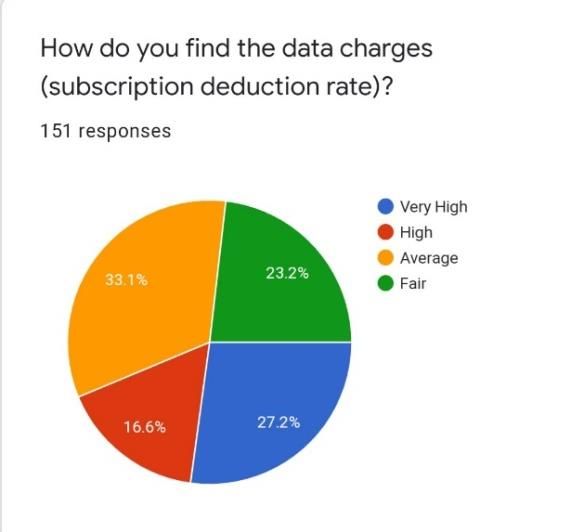
International Conference on Recent Trends in Applied Research (ICoRTAR) 2020              IOP Publishing
Journal of Physics: Conference Series            1734 (2021) 012032 doi:10.1088/1742-6596/1734/1/012032

Figure 5: Pie chart showing how many hours respondents spent on the web

The questionnaire also had a question that was aimed at knowing the number of times respondents
spend on social media. The percentage distribution is as follows. 32.7% use social media for more than
5 hours, 28% spent 3-5 hours using social media, 30% claim to spend 1-3 hours accessing the media,
and 9.3% said they spend less than one hour on social media.

Figure 6: Pie chart showing how long respondents spent on social media

This question was asked to get the accessibility rate experienced by students of the University of
Ilorin. The mobile establishes a connection with the network to access resources. This is referred to
technically as Packet service attach time or Packet Switch call setup time. The time is expected to be
less than 5 seconds, as stated by NCC.

In the result gotten, it shows that 7.3% get the page for they are trying to access opened under 2
seconds. 38% said they had to wait for 2-5 seconds on average before the webpage they are trying to
access displays. 34% said it took 5-10 seconds on average for the page to load. The rest percent, which
is 20.7%, stated that the pages they are trying to access take more than 10 seconds on average to load.

                                                    6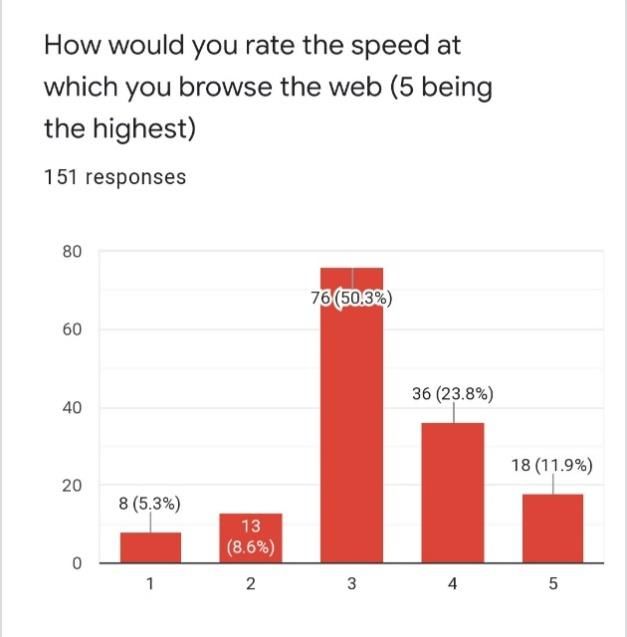
International Conference on Recent Trends in Applied Research (ICoRTAR) 2020              IOP Publishing
Journal of Physics: Conference Series            1734 (2021) 012032 doi:10.1088/1742-6596/1734/1/012032

Figure 7: Pie chart showing a view of respondents on how long their web pages take to load

The following questions are aimed at getting the level of satisfaction of users of the 4 major MNOs
that are being studied.

The first under this category shows that 10% stated that their browsing session ends abruptly 10 times
out of 100. 17.3% claimed that their browsing session ends 5-10 times out of every 100. 41.3% claim
that their browsing session ends abruptly 2-5 times out of every 100 sessions. Lastly, 31.3% claim that
their browsing session ends only once or twice out of every 100 browsing session.

Figure 8: Pie chart showing how frequently their browsing session ends abruptly

The level of dissatisfaction with the data deduction rate is relatively high as 26.7% claim that the data
charges are very high. 16.7% claim that it is just high. The highest percentage say the deduction rate is
average to them. The remaining percentage is satisfied with the date deduction rate.

                                                    7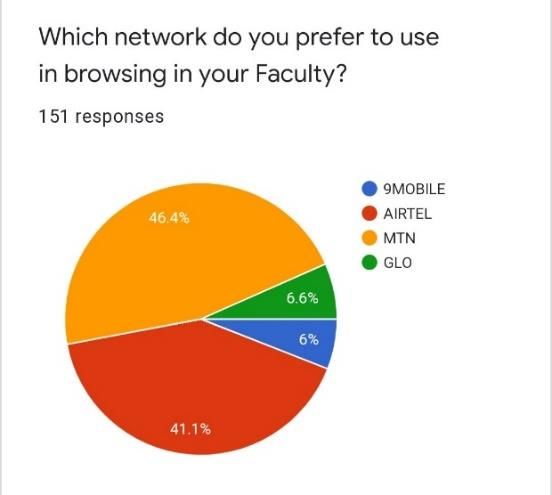
International Conference on Recent Trends in Applied Research (ICoRTAR) 2020              IOP Publishing
Journal of Physics: Conference Series            1734 (2021) 012032 doi:10.1088/1742-6596/1734/1/012032

          Figure 9: Pie chart showing the perception of subscribers about data deduction rate

                      Figure 10: Graph showing browsing speed by respondents

                                                    8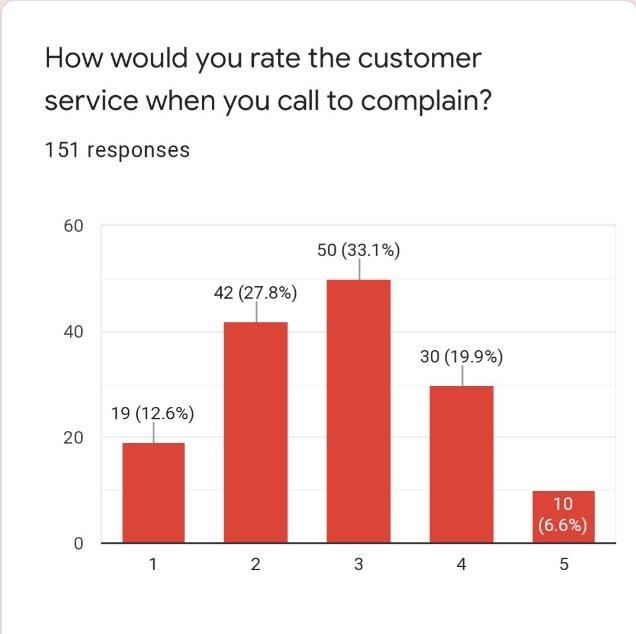
International Conference on Recent Trends in Applied Research (ICoRTAR) 2020              IOP Publishing
Journal of Physics: Conference Series            1734 (2021) 012032 doi:10.1088/1742-6596/1734/1/012032

                          Figure 11: Customer service rating by respondents

5 Discussion and Conclusion
Results from the questionnaire show that the networks with the least amount of internet subscribers are
the poorest, as students are already displeased with the services that poor network offers to them. In
addition, the results show that a large percentage of the students surf the web for over 5 hours as well
as use social media for over 5 hours. The results were categorized by location or department within the
school environment. Some of the results can be unfavorable from the perception of some users due to
mobile device differences. It is recommended that various schools adopt this research approach and
scope to get the quality of services known within the school. When results are published in school
magazines or on the website, this will put service providers on their toes to ensure that they are
providing competitive service within the school.

Acknowledgment

CUCRID section of Covenant University is highly appreciated for all forms of support.

References

[1]    NCC: Nigerian Communication Commission, "Technology Regulation," 2019. [Online].
       Available: https://www.ncc.gov.ng/technology/standards/qos. [Accessed June 2019].
[2]    L. Eirini, T. Dimitris, P. Nikos and M. Lazaros, Quality of Experience Management in Mobile
       Cellular Networks: Key Issues and Design Challenges, IEEE Communication Magaazine, pp.
       548-559, July 2015.
[3]    Mebawondu, O. J, F. M. Dahunsi, S. O. Adewale and B. Alese, "Radio Access Evaluation of
       Cellular Network in Akure Metropolis, NIGERIA," Nigerian Journal of Technology
       (NIJOTECH), vol. 37, no. 3, pp. 703-719, July 2018.
[4]    A.A. Oje, "Performance evaluation of service quality delivered to users of WCDMA Network
       in Unilorin," Ilorin, 2017.
[5]    federal republic of nigeria, "nigerian communications act: qualilty of service regulations,
       2013," in Federal Republic of Nigeria Official Gazette, Lagos, The Federal Government
       Printer, Lagos, Nigeria, 2013, pp. B133-B166.

                                                    9
International Conference on Recent Trends in Applied Research (ICoRTAR) 2020 IOP Publishing
Journal of Physics: Conference Series 1734 (2021) 012032 doi:10.1088/1742-6596/1734/1/012032
[6] E. K. Henrybless, "quality of experience (qoe) of mobile network subscribers in student
crowded environment," 2018.
[7] L. A. Imozie and D. O. Adegbite, "measurements-based performance analysis of a 4g lte
network in and around shopping malls and campus environments in Lagos Nigeria," Arid Zone
Journal of Engineering, Technology and Environment, vol. 12, no. 2, pp. 208-225, June 2018.
[8] D. Olaoye, "Evaluating the Quality of Service of Global System for Mobile Communication
(GSM) in Nigeria (Ilorin Metropolis)," Ilorin, 2016.
[9] P. Ian, "Radio-Electronics: 3G UMTS / WCDMA Basics Tutorial," © Adrio Communications
Ltd, Available: http://www.radio-electronics.com/info/cellulartelecomms/umts/umts-wcdma-
basics-tutorial.php. [Accessed April 2017].
[10] A. Ajibola, "Nigerian Telecoms Firms Frustrate Subscribers," Institute For War and Peace
Reporting, 20 January 2015. [Online]. Available: https://iwpr.net/global-voices/nigerian-
telecoms-firms-frustrate-subscribers. [Accessed June 2017].
[11] R. Aggarwal, "Wireless Communication: Evolution and Advance Wireless Communication,"
International Journal of Sustainable Development Research, vol. 4, no. 2, pp. 22-30, 2018.
[12] L. A. Akinyemi, T. Makanjuola N, O. Shoewu O and O. Edeko F, "Evaluation and Analysis of
3G Network in Lagos Metropolis, Nigeria," International Transaction of Electrical and
Computer Engineers System, vol. 2, no. 3, pp. 81-87, 2014.
[13] N. N. Alexander, U. O. Anthony, O. I. Emmanuel and K. N. Davies, "Evaluation and
Optimization of Quality of Service (QoS) of Mobile Cellular Networks in Nigeria,"
International Journal of Information and Communication Technology Research, vol. 3, no. 9,
pp. 277-282, 2013.
[14] B. L. Anselemi, K. Jan and K. P. Michael, "GSM Network Optimization And Planning For
Nelson Mandela African Institute Of Science And Technology," Network and Complex
Systems, vol. 4, no. 7, pp. 10-16, 2014.
[15] M. Dahiya, "Need and Advantages of 5G Wireless Communication Systems," International
Journal of Advance Research in Computer Science and Management Studies, vol. 5, no. 6, pp.
48-51, 2017.
[16] P. Ian, "Radio-Electronics: 3G UMTS / WCDMA Network Architecture," © Adrio
Communications Ltd, Available: http://www.radio-
electronics.com/info/cellulartelecomms/umts/umts-wcdma-network-architecture.php.
[Accessed April 2017].
[17] P.V. Kumar, B. Anuradha, Vivek and Naresh, "improvement of key performance indicators and
qos evaluation in operational gsm network," International Journal of Engineering Research and
Applications (IJERA), vol. 1, no. 3, pp. 411-417.
[18] A.A. Adewale, E.R. Adagunodo, S.N., John, Performance comparison of dynamic guard
channel assignment with buffered prioritized scheme for mobile WiMAX network 2016,
Proceedings of 2016 SAI Computing Conference, SAI 2016 7556054, pp. 669-674.
[19] A.A. Adewale, S.N. John, E.R. Adagunodo, Performance comparison of dynamic guard
channel assignment with buffered prioritized scheme for mobile WiMAX network, 2016
Lecture Notes in Engineering and Computer Science 2223, pp. 566-570.
10You can also read