PIPELINE TECHNOLOGY CONFERENCE - 3RD SPECIAL EDITION - Pipeline Technology ...
←
→
Page content transcription
If your browser does not render page correctly, please read the page content below

e Journal
Issue 3/ 2020

                                           Pipeline Technology Journal

                                            3RD SPECIAL EDITION

                                            PIPELINE TECHNOLOGY CONFERENCE

                www.pipeline-journal.net                          ISSN 2196-4300
For all those thinking big.

Uncompromising quality, efficient process:
DENSO is your solution partner for reliable corrosion protection even on the biggest pipeline projects.
With comprehensive consulting and a full range of products that set standards worldwide.
denso-group.com

Protection for Eternity.

PIPELINE TECHNOLOGY JOURNAL 3

                                                                                                            EDITORIAL

Dear readers,

With this 3rd edition of the ptj in 2020 we are publishing 10 more articles
from the 15th Pipeline Technology Conference that had to be restructured
into a virtual event on short notice earlier this year.

The global pandemic is pushing us all to speed up digital transformation.
For this reason, you could now see different kinds of online events and
webinars popping up in your mailbox on a daily basis. But we all know that
these online events will never achieve what can be created with a face-to-                        Dennis Fandrich
face meeting during a real conference and exhibition.
                                                                                                Director Conferences
Nevertheless, several essential physical event benefits could already
be implemented into online concepts. In addition to the pure transfer of
knowledge via keynote speeches, panel discussions and technical pres-
entations, the free networking between all participants and the compara-
tive competition of a multitude of solutions on the market are of particular
importance.

The figures from the first ever Virtual Pipeline Summit (VPS) on “Digital Transformation in the Pipeline Industry”
demonstrate that this comprehensive approach is attracting great interest. More than 600 participants from 69
different countries joined the event. Almost 30% of the participants came from pipeline operators. The 2nd VPS on
“Leak Detection and Third-Party Impact Prevention” will take place on 7 October 2020.

The comprehensive pool of experience that can be gained from these new formats will also be incorporated into
the planning of the 16th Pipeline Technology Conference from 15-18 March 2021. In addition to the face-to-face
event in Berlin, there will also be a strong online part, which will lead further interested pipeline professionals into
the ptc community not only in these challenging times but also in the future.

I look forward to seeing you again in person at ptc 2021 in Berlin and to having a virtual chat during one the upcoming
VPS events.

Sincerely yours

Dennis Fandrich, Director Conferences, EITEP Institute
4 PIPELINE TECHNOLOGY JOURNAL
THIS ISSUE’S COMPLETE CONTENT
THIRD SPECIAL EDITION WITH PTC PAPERS AUGUST 2020 / SPECIAL EDITION
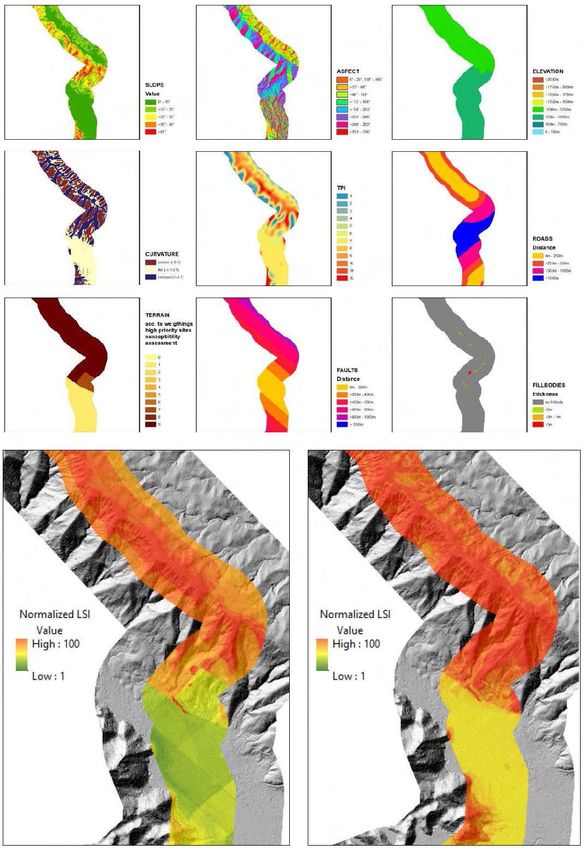
Maximising Accuracy Of MFL Pipeline Multidisciplinary landslide assessment –
Inspection a systematic and practicable approach for
Ben Scott, Stephen Farnie - Baker Hughes 8 pipeline projects
C. Prager, C. Ladenhauf, L. Schwarz, T. Strauhal,
Surge protection for insulating joints – S. Unterrader - ILF Consulting Engineers Austria 48
suitable spark gaps and evaluation of the
installation A Holistic Approach to Achieve Excellence in
Manfred Kienlein - DEHN SE + Co KG 18 Pipeline Security Using “BISMA” & “SOLIDS”
Muhamad Rais - PT Pertamina Gas 60
Overcoming the Challenges and
Increasing Value in Fiber Optic Monitoring Hydrogen in Pipelines
Steven Koles, Ehsan Jalilian, John Hull - Rainer Kurz, Luke Cowell, Marc Vignal -
Hifi Engineering 26 Solar Turbines Incorporated 64
Digitalization Projects for the Oil and Gas Lessons Learned on 20 years of challenges
Industry to internal corrosion protection of subsea pipe-
Michael Barth - ILF Consulting Engineers 32 lines-corrosion inhibitor or
pH stabilization?
Design of tanks’ foundation and onshore Reza Ghorbani, Omid Razavi Zadeh -
pipeline against earthquakerelated geo- South Pars Gas Complex Company 74
hazards in a coastal area in Northern Greece
A. Antoniou; A. Dimou; A. Markogiannakis; P. Karvelis -
Safely repairing subsea flanges on flexible
flowlines with a flexible bridging jumper struc-
National Technical University of Athens;
ture
Geoserton Hellas SA; Pipeserv LtD; Korros-E 40
Giuseppe Rizzo - Oceaneering International Services 82
Company Directory
Page 86
Next Edition of ptj 90 Event Calendar 91
Pipeline Technology Journal - ptj
www.pipeline-journal.net
@pipelinejournal
Pipeline.Technology.Conference
PIPELINE TECHNOLOGY JOURNAL 5

ptj Editorial Board
CHAIRMAN
              Dr. Michael Beller, Director Global
              Market Strategy, Rosen Europe

MEMBERS
              Max Wedekind, Managing Director,                                        Asle Venas, Senior Principle Pipeline
              DENSO                                                                   Specialist, DNV GL

                                                                                      Andreas Antoniou, Senior Research
              Steffen Paeper, Senior Offshore
                                                                                      Associate,
              Commissioning Engineer, South Stream
                                                                                      National Technical University of Athens

              Mark Iden, Chief Executive Officer,                                     Tobias Walk, Managing Director, ILF
              SkyData Air & Space

                                                                                      Mahmoud Abdel Hakim, Pipeline
              Belkacem Bechka, Freelance Pipeline
                                                                                      Engineering Team Leader, ADNOC
              Consultant
                                                                                      Offshore

                                                                President: Dr. Klaus Ritter
                                                                Register Court: Amtsgericht Hannover
                                                                Company Registration Number: HRB 56648
                                                                Value Added Tax Identification Number: DE 182833034

                                                                Editor in Chief
                                                                Dr. Klaus Ritter

                                                   Pipeline Technology Journal
                                                                E-Mail:     ritter@eitep.de
                                                                Tel:        +49 (0)511 90992-10

                                                                Editorial Board
                                                                ptj Editorial Board
          Pipeline Technology Journal
                                                                Editorial Management
  www.pipeline-journal.net
                                                                Dennis Fandrich
  ptj@eitep.de
                                                                E-Mail:    fandrich@eitep.de
                                                                Tel:       +49 (0)511 90992-22
  Publisher
  Euro Institute for Information and Technology Transfer GmbH
                                                                Marian Ritter
  Marie-Jahn-Straße 20
                                                                E-Mail:    m.ritter@eitep.de
  30177 Hannover, Germany
                                                                Tel:       +49 (0)511 90992-15
  Tel:        +49 (0)511 90992-10
  Fax:        +49 (0)511 90992-69
                                                                Advertising
  URL:        www.eitep.de
                                                                Rana Alnasir-Boulos
                                                                E-Mail:    alnasir-boulos@eitep.de
  Terms of publication: Four times a year
                                                                Tel:       +49 (0)511 90992-19
  Used Copyright Material:
  P. 1, 90 © Philip Wilson                                      Design & Layout
  P. 4, 6 © Adobe Stock/Kalyakan                                Constantin Schreiber: c.schreiber@eitep.de

                                                                Editorial Staff
                                                                Mark Iden: iden@eitep.de
NEW TRANSIT PIPELINE TO BE BUILT IN TURKEY

Botas, Turkey’s state-owned crude oil and natural gas pipelines and
trading company, has opened a tender for the construction of a jet-
ty, measuring station and transit pipeline for a new Floating Storage
Regasification Unit (FSRU) LNG import terminal on the Gulf of Saros in
northwest Turkey.

As reported in the tender documents, the work involves the construc-
tion of a 320-meter jetty, together with an onshore gas measuring
station and 17km of high pressure pipeline that will connect with the
Turkey-Greece interconnector pipeline. Turkey has two onshore LNG
import terminals and one other FSRU

Read more at:
https://www.pipeline-journal.net/news/new-transit-pipeline-be-built-
turkey


Maximising Accuracy Of MFL Pipeline Inspection

Ben Scott, Stephen Farnie > Baker Hughes

Abstract
There have been significant advances in magnetic flux leakage (MFL) in-line inspection (ILI) technologies in recent
years. These have led to improvements in Probability of Detection (POD), Probability of Identification (POI) and
Probability of Sizing (POS).

Whilst often the main focus of these advancements is the inspection vehicle itself, the end product of an inline in-
spection service is reliable and accurate data. This end product is influenced by various technological factors which
include: recognition & detection algorithms; complex sizing models; robust and rigorous processes and; highly
trained and skilled data analysts.

This paper explores all the main factors that contribute to delivering the reliable and accurate inspection reports that
pipeline operators demand today. This review will be supported by extensive comparison of ‘as reported’ data vs ‘in
ditch’ findings. This is particularly valuable for operators of inaccessible pipelines, where proving ILI performance is at
least challenging, and often not possible.
PIPELINE TECHNOLOGY JOURNAL 9

                                                                   RESEARCH / DEVELOPMENT / TECHNOLOGY

INTRODUCTION

Pipeline operators must balance key concerns while running         rigorous processes and; highly trained and skilled data
a business (Figure 1). Protecting people, the environment,         analysts.
and the reputation of the industry remain the highest priority,
whilst maximizing the ongoing returns to shareholders from         This paper will first highlight how MFL ILI ‘accuracy’ has
major investments is always a focus.                               changed and improved over time and then focus on the
                                                                   following factors which all contribute to the reliable and
                                                                   accurate inspection service. The factors covered will be:

                                                                   ACCURACY

                                                                   MFL inspection accuracy is typically stated in terms of
                                                                   detection, identification and sizing. Each one of these is
                                                                   measured in terms of confidence levels, typically at 80 or
                                                                   90%:

                                                                   Detection or POD really means will ‘it’ be seen?
 Figure 1: Key Drivers for pipeline owner/operator                       Commonly defined in industry by API 1163 (American
                                                                         Pipeline Institute) as “The probability of a feature
These concerns become an even greater challenge in                       being detected by an ILI tool” or by POF (Pipeline
tough economic times with budgets continually under                      Operators Forum) as “The probability that a feature
pressure. Many operators are choosing to collect a full, or              with a size will be detected by the ILI tool.”
enhanced inspection dataset but put priority focus and
advanced analysis on targeted and problematic regions                     Identification or POI really means what is ‘it’?
of interest. Such areas may be of high consequence or                     Commonly defined in industry by API 1163 as “The
other regions identified from historic inspections or risk                probability that the type of anomaly or other feature,
assessment. Whether operators are focusing on targeted                    once detected, will be correctly classified (e.g. as
areas or conducting a detailed assessment on the entire                   metal loss, dent, etc.)” or by POF as “The probability
pipeline section, the accuracy of the data used, in this case             that a feature is correctly identified by the ILI tool.”
in-line inspection (ILI) data, has a significant impact on the
outcomes of these assessment [ref 6].                                     Sizing or POS really means what size is ‘it’?
                                                                          Commonly defined in industry by API 1163 as “The
Magnetic Flux Leakage (MFL) is the most widely used                       accuracy with which an anomaly dimension or char-
ILI technology in the world today. This is largely due to                 acteristic is reported” or by POF as “Sizing accuracy
its ability to deliver in a wide range of pipeline operating              is given by the interval with which a fixed percent-
environments whilst maintaining high levels of accuracy.                  age of features will be sized. This fixed percentage is
Accuracy for MFL inspection is generally measured in terms                stated as the certainty level.”
of Probability of detection (POD), Probability of Identification
(POI) and Probability of Sizing (POS).                             Detection and sizing specifications are typically a key
                                                                   element of an ILI contract. In some of the early inspec-
The first commercial On-Line Inspection Centre (OLIC) MFL          tion contracts from the 1980s, the accuracy levels were
inspections took place in the 1980s (first British Gas MFL         not stated or ‘silent’ largely because the specifications
inspection took place in 1977). Over the four decades since,       were unproven or did not even exist. Some reports would
there have been significant advances in MFL inspection             merely provide a distance and Asterix*, which effectively
technologies and their resulting capabilities. Whilst often        said ‘there might be something here’. Although defects
the focus of these advancements is the inspection vehicle          identified were effectively being reported on a reasonable
itself, the end-product of an inline inspection service is         endeavors basis, there was enough confidence in these
reliable and accurate data. This end-product is influenced         results for MFL inspection to be of significant value in
by various technological factors which include: recognition        pipeline integrity management. This value contributed to
& detection algorithms; complex sizing models; robust and          improvements over the coming years and decades.
10 PIPELINE TECHNOLOGY JOURNAL

RESEARCH / DEVELOPMENT / TECHNOLOGY

In the later 1980s and into the 1990s, detection and sizing
specifications became the norm in ILI contracts. Figure 2
shows an example of a MagneScan contract specification.
Specifications were provided for pits and general metal
loss, with the minimum detection for pits @ 50% WT and
for general metal loss @ 30% WT. This specification was
commonly known at the time as ‘30/50 spec’. The sizing
accuracy was +/- 20% or +/- 15% WT depending on the
defect type.

In the 15-20 years that followed, the specifications im-
proved and evolved to cover a greater range of defect,
sizes, types (typically quoted according to POF feature
category) and improved levels of accuracy. Table 1 below
provides the inspection accuracy from the Baker Hughes
fleet: This is the MagneScan fleet’s, industry leading ‘Super
High Resolution Plus’ (SHRP) specification. Today the
minimum detection and sizing level is from 4% and +/-8%
of local wall thickness, compared to 30% and +/-15% from
20 years earlier.

                                                                  Table 1: MagneScan SHRP detection & sizing accuracy
This comparison shows how much the accuracy of an MFL
inspection has changed over the past 20+ years.

 Figure 2: Extract from a MagneScan ILI contract from the 1990s
PIPELINE TECHNOLOGY JOURNAL 11
RESEARCH / DEVELOPMENT / TECHNOLOGY
FACTOR 1: THE INSPECTION VEHICLE FACTOR 2: SOFTWARE & FEATURE RECOGNITION
An ILI service starts with a successful run of the inspection Specialised software and algorithms are essential to the
vehicle. The design and performance of the vehicle is critical analysis of pipeline inspection data; they support the
to successful navigation through the pipeline, but perhaps analysis process by enabling manual analysis to focus
more importantly delivers the ability to detect (POD) defects decision making on the regions and features which are
along the pipeline with enough information to allow the data most critical and where manual expertise adds the most
analysis process to confidently identify (POI) and size (POS) value (Figure F2.1).
these detected defects.
In 2008 Baker Hughes introduced a new MFL technology
system to the industry: the latest generation of MagneS-
can inspection vehicle. The 6” system launched at the time
(Figure F1.1) made use of industry leading electronics and
sensing technology to enable step change improvements in
sensor spacing, scan pitch and operating parameters. These
advancements, and recent others have contributed to the
successful roll out of the latest generation MagneScan vehi-
cle to its current capabilities covering 6 – 42” diameter range.
Figure F2.1 The caliper decision support workflow user interface
The signal data collected during an ILI run can be rep-
resented as a grid that covers the whole pipeline wall
surface and, by analogy, can be thought of as an image of
Figure F1.1: Baker Hughes latest generation MagneScan the pipe. For a 100km pipeline section, this image may be
1000 pixels high and 50 million pixels wide (number of
Previous Baker Hughes reports and publications [ref 1, 2, sensors x number of data scans), and the task of ILI data
3] explain in detail how these vehicle attributes contribute analysis is to identify, classify and quantify the size and
to achieving specifications being delivered today (Table 1). severity of any injurious features in this massive data set.
Notably, studies identified that the vehicle alone can only The number of individual corrosion pits in a pipeline this
take specification improvements so far. size may run into millions, and although all of these are
visually inspected, algorithms are required to locate and
Specifically, it was found that there is a non-linear rela- pre-assess this volume of features.
tionship between sensor density and signal sizing perfor-
mance. There is an optimal sensor density above which For features meeting the system POD specification to be
detection and subsequent sizing performance will not reported the ILI analysis process must be able to correctly
improve significantly, even if the vehicle were to have an identify and classify them (POI). Achieving a high POI has
‘infinite’ number of ‘infinitely small’ sensors. two components: reliably detecting and labelling areas of
data as a region of interest, and then accurately classifying
In other words, the inherent physics in the amplitude the cause of the signal detected for each area (Figures F2.2
responses and signal-to-noise thresholds of any real and F2.3).
system do not provide a beneficial improvement of the
signal detection or signal characterization with radically As MFL technologies do not provide a direct measure of
improved sensor spacing. defect depth, Baker Hughes feature detection algorithms
ensure that all features meeting the POD specification
The physics of MFL signal spatial distributions, the local are detected, from the largest area of general corrosion
magnetization levels and signal interpretation, ultimately down to 5mm diameter pinholes. Advanced pre-processing
within the cross-analysis/synthesis process steps, were is used on the raw ILI data to normalise, improve sig-
key considerations resulting as an overall system to nal-to-noise, and ensure consistent detection across all
maximize feature (e.g. pinholes, slots, pits, etc) detection wall thicknesses and pipe types. POD and POI detection
and sizing entitlement. specifications are verified for every ILI system by including
features into pull tests which are at and below the expect-
ed detection thresholds.12 PIPELINE TECHNOLOGY JOURNAL
RESEARCH / DEVELOPMENT / TECHNOLOGY
Figure F2.2: ILI signal data showing an area of corrosion above and a seam weld below. On the right we can see potential features detected on both areas by the
‘boxing’ algorithm.
Figure F2.3 After classification the seam weld and non-corrosion areas have
been removed
The nature of an accurate MFL inspection system is such Development does not stop once the algorithm is being
that it can be very sensitive to variations that are often used live in production. Performance metrics built in to
seen in different pipelines, even if they are considered the the analysis software continue to be gathered with each
‘same’ (WT, steel grade, corrosion levels etc) on paper. This inspection to measure performance and capture unusual
‘pipe-to-pipe’ variation is one of the biggest challenges line conditions that are used to update and improve the
to accurate classification. To overcome this, and meet the algorithm over time. The example on figure F2.4 shows the
accuracy and reliability needed, the latest generation of area above the blue line is reducing. A reduction in area
Baker Hughes classification algorithms are trained and above the line represents an increase in accuracy through
tested on a data set consisting of hundreds of individual algorithm refinement.
pipelines which total around 40,000 Km, contain over 250
million detected metal loss features, and have 100 Tera-
bytes of recorded ILI data.
Figure F2.4 Example of iterative performance improvements during algorithm development Each circle
represents features from individual pipeline sections with varying attributes.E-POWER PIPE®
INNOVATION FOR
PROTECTIVE PIPE
INSTALLATION
With E-Power Pipe®, Herrenknecht has developed a new method to
quickly and securely install small-diameter cable protection pipes
underground with drive lengths of over 1,000 meters. The trenchless
technology can be precisely controlled and used with only small
overburdens, thus offering a ground-conserving alternative to the
conventional open-cut method for high-voltage grid expansion.
herrenknecht.com/e-powerpipe14 PIPELINE TECHNOLOGY JOURNAL
RESEARCH / DEVELOPMENT / TECHNOLOGY
FACTOR 3: ALGORITHMS & SIZING MODELS Although they share the same form, each sizing model is
uniquely tailored to an ILI system configuration to ensure
It is not enough to detect an area of corrosion and report the best performance. This means that Baker Hughes has
it as such, an ILI inspection also needs to report the depth created over 500 models to date.
and extent of that corrosion accurately. The level of sizing
accuracy that can be achieved (POS) is usually stated as a The POS performance is measured across all defect shape
tolerance +/- a given percentage of the pipe wall thickness, categories in the pull through data set, and due to the
and calculated to an 80% or 90% confidence level, meaning variation and extreme defects in this population it is often
80% or 90% of all corrosion features will be expected to found that the model performance in operational data,
meet the given tolerance. where the natural corrosion is more typical, will exceed the
stated POS.
The task of predicting the depth profile of an area of
corrosion is not straightforward. The relationship between FACTOR 4: DATA ANALYSTS &
the recorded magnetic flux leakage and defect depth is DATA ANALYSIS PROCESS
complex and highly nonlinear; even for simple isolated pits
sources of variation include the ILI vehicle build, magnet Data analysis is where the bulk of the ‘time’ is spent during
strength, wall thickness, pipe material, vehicle speed, and any pipeline ILI service. Although there is no direct correla-
of course, the shape of the pit itself. tion between the time spent analyzing the data and the
typical contractual reporting timescales, it is still a good
The Baker Hughes process of sizing consists of two as- indication of the levels of ‘effort’ required. A typical MFL
pects; first characterising an area of corrosion using sever- inspection report timescale is 60 days from receipt of the
al descriptors, and then using those descriptors to predict data to deliver of the report (this time will increase for lon-
the corrosion dimensions using a statistical method called ger pipelines e.g. 100 days for pipelines >150km). Although
a ‘sizing model’. there are sophisticated feature recognition algorithms and
software techniques applied to the ILI data before detailed
Sizing models start with a carefully chosen population of analysis starts, every inch of the ILI data is reviewed by a
artificial defects machined to replicate real corrosion. ‘Pull data analyst. As this stage is so critical to report quality
Through’ tests are carried with every ILI vehicle on these and resulting end-product accuracy (Figure F4.1) Baker
defects to give comprehensive coverage over all defect Hughes invests in ensuring the right people are selected
shapes, wall thicknesses and speeds; the sizing model is and governed by robust processes.
built using this data.
Figure F3.1 Pull through pipe spools with machined defects
The introduction of the latest generation MagneScan
fleet in 2008 saw a step change in the defect population Figure F4.1. Holistic view of factors influencing ILI report quality
size and variation, resulting in an improved POS across
all defect morphologies. Sizing models are now typically Data analysis essentially consists of spending many hours
derived on an extensive range and number of individual a day, often for weeks at a time, looking at a busy comput-
defect signals, and crucially incorporate the expertise and er screen of lines and colours for patterns and ‘stand out’
knowledge accumulated across decades of experience in features. It’s often a case of making sure the software got
ILI inspection to create a model that is robust and accurate it right – and it doesn’t always! This challenging work takes
across the whole population. a certain type of individual, hence, Baker Hughes strive toPIPELINE TECHNOLOGY JOURNAL 15
RESEARCH / DEVELOPMENT / TECHNOLOGY
recruit and retain engineering degree level candidates that within the ISO 29001 Quality Management Certification
go through ‘psychometric’ screening to ensure they have system which exists at every one of the Baker Hughes
the right ‘minds’ for the job. This screening is designed operational sites. Notable elements contributing to robust
to make sure the candidates have both the necessary processes and procedures include:
attention to detail and the ability to commit to the role for
a number of years. The latter is clearly important when you • On the job training (OJT)
consider the time it takes (Figures F4.2, F4.3) to gain the • Report Audits
experience and qualifications necessary to comply with • Continuous Improvement & Feedback system
the internationally recognized standards ANSI/ANST ILI- • Data analysis quality metrics
PQ-2017. The full details of how Baker Hughes complies
with ILI-PQ-2017 are documented in formal document These, and other elements, are covered in more detail in
reference Global-E-M003. recent publications (reference 4), but it is worth exploring
report audits in more detail.
The data analysis teams work to, and are governed by, a
range of processes and procedures. These are controlled
Figure F4.2: Baker Hughes Analysis Training & Certification Structure
Figure F4.3: ILI-PQ-2017 magnetic technology qualification & certification requirements16 PIPELINE TECHNOLOGY JOURNAL
RESEARCH / DEVELOPMENT / TECHNOLOGY
Internal post-delivery report audits are an important best Following the system validation and operational release,
practice. These provide a means of making sure analysis it is then critical to operator confidence that this can be
and reporting standards continue to meet the stringent followed up in the field. Below, figure F5.2 shows how sizing
high-quality requirements expected by customers and performance of the MagneScan system was verified from
that significantly impact report accuracy. All audits multiple sets of dig data provided by operators in Asia,
should be planned, documented and scored to provide Europe and North America. The system is consistently per-
the foundation for generating ongoing analysis quality forming at greater than 90% certainty.
metrics. This proactive approach should seek out po-
tential errors and highlight any process issues that have As the volume of ‘truth data’ grows, confidence in the
the potential to introduce future error. Should an error accuracy of the system does also. In parallel, opportunities
be found, it is documented, which initiates a formal Root for improvement are also presented. In the case of the
Cause Analysis (RCA) and corrective action is taken. MagneScan system, a significant improvement opportunity
arose to expand the range of features that could be detect-
FACTOR 5: PERFORMANCE VALIDATION, ed, identified and sized accurately. This improvement is
VERIFICATION & IMPROVEMENT covered in detail in an earlier publication (reference 3) but
it led to the release of the MagneScan Super High Resolu-
The first part of the ‘proof’ of performance of an MFL tion Plus (SHRP) specification which added detection and
inspection system is validation using ‘pull-through’ data. sizing accuracy for pinholes and slots. Figure F5.3 shows
This compares the recorded, analyzed and sized signals the performance of the MagneScan SHRP with respect to
vs the known actual defect dimensions in the pull through pinholes within areas of general corrosion.
spools. Each new MFL vehicle design in the Baker Hughes
fleet goes through this validation prior to its release into Since laser scanners have become the norm when verify-
operations. As mentioned earlier in this paper the first of ing ILI performance, the Baker Hughes dig verification data
the latest generation MagneScan fleet was the 6” vehicle - base has grown exponentially from a few thousand defects
its performance validation can be seen in figure F5.1. In this prior to 2015 to hundreds of thousands today, across all 7
case the results proved that the vehicle exceeded the depth POF categories. Matching of laser scan excavation data is
sizing accuracy target of +/-10% WT with 90% certainty. carried out using the DigCom software introduced in 2013,
this software allows matching of each individual pit even in
complex corrosion (Figure F5.4).
Figure F5.1 Validation of the 6” MagneScan system Figure F5.2 MagneScan dig verification data unity plot
Figure F5.3 MagneScan pinhole verificationPIPELINE TECHNOLOGY JOURNAL 17
RESEARCH / DEVELOPMENT / TECHNOLOGY
12345678jhbgfcdxsyrdtfghj
The significant growth in truth data has led to Baker At Baker Hughes there is a belief that, based on current in-
Hughes introducing regular accuracy performance reviews. dustry hardware, accuracy improvements that can directly
Held quarterly within our organization and annually with influence critical assessments of pipelines are just as likely
many key customers, these reviews allow us to consider to come from what we do with the data we have today as
results in detail with the aim of continually improving our they are from improvements on the vehicle itself.
accuracy and overall offering to operators. The current
truth database for the latest generation of the MagneScan ACKNOWLEDGEMENTS
fleet contains in excess of 60,000 features reported at the
most accurate (SHR/SHRP) specifications. Actual perfor- The authors wish to thank the various members of Baker
mance is proven to significantly exceed stated specifica- Hughes who have provided input and previously written
tions of POD, POI & POS @ 90%. papers that have been used to support this paper.
Since the introduction of these regular reviews, trends and References
early indicators are being used to drive multiple improve- 1. Pinhole Defects Detectability: Investigation into the smallest defect detectable with MFL
technology, Mullin, I., Canni, G.
ment and enhancement initiatives such as (but not limited 2. Validation of latest generation MFL in-line inspection technology leads to improved detection
and sizing specification for pinholes pitting, axial grooving and axial slotting, Submission
to): IPC2010-31124, Sutherland, J., Bluck, M., Pearce, J., Quick, E.
3. Advancements In The Detection & Sizing Of “Pinhole” Metal Loss, Submission IPC2014-33128,
Santamaria, W., Bluck, M.
4. In-line inspection: Both effective data collection and interpretation needed to achieve high
• Defect outlier elimination quality reporting results, Submission IPC2010-31112, Walker, J., Mallaburn, P., Balmer, D.
5. Advancements in the identification and inspection of Girth Weld Anomalies, Submission IPC
• Girth weld crack detection & sizing (reference 5) 2012-90114, Bluck, M., Sutherland, J., Pearce, J.
6. Achieving critical assessments of pipelines through accurate & reliable inspection information,
• Automatic prediction enhancement Submission NACE 2nd Conference & Expo Genoa 2018, Bluck, M., Dawson, J, Sutherland, J.
• Training and processes
CONCLUSIONS Authors
As noted in the introduction (and discussed in greater Ben Scott
detail by Bluck, Sutherland, Dawson [ref 6]) ILI accuracy
plays a significant role in achieving critical assessments of Baker Hughes
pipelines. This accuracy has a direct influence on both: ILI Product Line Leader –
• material cost saving of reduced digs; and Magnetics
• improved pipeline safety. Process & Pipeline Services
This paper has identified the main protagonists that con- ben.scott@bakerhughes.com
tribute to the delivery of reliable & accurate data supplied
by an MFL, or indeed any ILI, inspection service.
Stephen Farnie
Whilst the ILI vehicle often takes center stage it is sup- Baker Hughes
ported in equal measure by several other factors. It has
been shown that as far as the vehicle is concerned ‘more’
Data Science Manager
doesn’t necessarily mean ‘better’ or specifically ‘better Process & Pipeline Services
accuracy’.
steven.farnie@bakerhughes.comSurge protection for insulating joints –
suitable spark gaps and evaluation of the installation
Manfred Kienlein > DEHN SE + Co KG
Abstract
Insulating joints are used for the electrical separation of pipeline systems or for dividing pipelines that are affected
by high voltages into sections. The electrical isolation of cathodically protected systems is maintained until the
dielectric strength/ flashover strength of the insulating joint is reached. Overvoltages which occur as a result of
lightning striking exposed parts of a pipeline system can exceed the dielectric strength of insulating joints. This can
result in open sparks or destruction of the insulating joint.
Ex isolating spark gaps (ExFS) with suitable connection technology have the task of protecting the insulating
joint (insulation) against lightning-induced overvoltages and discharging the lightning energy without sparking
when dealing with dangerous explosive atmospheres (d.e.A.) at the same time. During normal operation and after
the discharge process, the ExFS should disconnect safely electrically. In addition to checking ExFS, GW 24 [1] also
provides information on the selection of ExFS including the suitable connection technology, which is described in
more detail below.PIPELINE TECHNOLOGY JOURNAL 19
RESEARCH / DEVELOPMENT / TECHNOLOGY
1. SCOPE OF APPLICATION OF GW 24 [1]
This document deals with measures to avoid ignition necessity to replace defective insulating joints which, be-
hazards on insulating joints and to ensure cathodic cor- sides entailing high repair costs, has a strong influence on
rosion protection in potentially explosive atmospheres. plant availability. For these reasons it may also be advanta-
The recommendation is applicable to stations of natural geous to install ExFS with suitable connection technology
gas pipeline systems and - under consideration of the in areas which are not classified as hazardous.
respectively valid national regulations (e.g. TRbF, TRGS,
TRBS, BetrSichV) - analogously also for other product 3. SELECTION, ASSEMBLY AND TESTING OF EXFS
pipelines.
The selection of suitable ExFS incl. connection technology
Insulating joints of these systems can be realised as must depend on
insulating couplings or as insulating flanges.
• the determined lightning protection level (LPL) or a
In the area of ports or waterways, other protective measures partial lightning current calculation
may also be applied during the transport or handling of • the dielectric strength of the insulating joint,
hazardous liquids. • the distance between connection points (cable length),
• the technical data of the ExFS
Protective measures against other hazards such as the • the installation location (Ex-zone) and
discharge of coupled technical alternating currents or • the insulation coordination (insulating joint to connected
protective measures against electric shock are described ExFS).
in recommendations GW 22 [2] and AfK Recommendation
No. 6 [3]. 3.1. DETERMINATION OF THE LIGHT-
NING PROTECTION LEVEL (LPL)
2. NEED TO USE EXFS
The hazard level (LPL) is determined with a risk assess-
In potentially explosive atmospheres, the primary protection ment according to DIN EN 62305-2 [4]. On the basis of this
objective is to avoid sources of ignition (e.g. uncontrolled parameter, the maximum lightning current (lightning current
open sparkovers) at insulating joints. distribution according to DIN EN 62305-1 [4]) is determined
by the ExFS through various impact scenarios (S1 - S4). For
Outside hazardous areas (e.g. with buried insulating joints) example, in the case of pipelines located above ground (see
there is no need to use ExFS for explosion protection Figure 1), the maximum lightning current (LPL I) through the
reasons, but defective insulating joints usually impair the ExFS would be 100 kA (10/350 µs) in the event of an S3
cathodic corrosion protection. In the case of pipelines strike to the pipeline.
affected by external voltage, it is also possible that the
contact protection criterion is no longer met. This makes it
Figure 1 Lightning current distribution at impact S320 PIPELINE TECHNOLOGY JOURNAL
RESEARCH / DEVELOPMENT / TECHNOLOGY
Table 2 of GW 24 [1] describes the maximum parameters In addition, the entire connection technology must be:
of the first flash depending on the LPL for the ExFS with
connection technology. The maximum values for the • capable of carrying lightning current,
negative subsequent flash have not been considered. • spark-free (in case of simultaneous occurrence of a
It is possible to deviate from these maximum values if potentially explosive atmosphere),
a detailed consideration according to DIN EN 62305-1, • arranged directly parallel and close to the insulating
appendix E [4] or comparable is carried out. joint,
• connected by the shortest route,
3.2. DIELECTRIC STRENGTH OF THE INSULATING JOINT • secured against accidental bridging (e.g. by tools).
The insulating joints used in each case are tested after Suitable connection points on pipelines are
production with a test alternating voltage UPW of 50 Hz
corresponding to the classification. There are two test • welded on lugs, bolts
classes: • Tapped holes in the flanges to accommodate bolts.
Class 1: UPW > 5 kVrms Note: Connection by means of a clamp is only permissible
Class 2: UPW > 2.5 kVrms if tests have shown that there are no sparks in case of
lightning currents. All screw connections must be secured
The test classes for the insulating joints can be obtained against self-loosening. Protection against self-loosening
from the respective manufacturer. Higher test voltages (e.g. can be ensured, for example, by inserting a spring washer.
10 kV) can also be tested on customer request. Toothed lock washers have not proven effective in such
applications (sparking with lightning currents)
3.3. DISTANCE BETWEEN THE CONNECTION
POINTS (LENGTH OF THE CONNECTION CABLE) 3.4. MINIMUM REQUIREMENTS FOR EXFS
Depending on the max. current steepness of the partial Suitable ExFS should have the following technical data and
lightning current determined under point 3.1 and the length approvals:
of the connecting cable, the dielectric strength of the
insulating joint may be exceeded on account of the voltage • Tested according to IEC/EN 62561-3 [6].
drop (during the discharge process) via the connecting • Lightning current carrying capacity class: H or N
cable. • DC sparkover voltage: > 600 V 1)
• 100 % lightning impulse sparkover voltage (1.2/50 µs):
This can be the case with cable length from just 300 mm ≤ 1.25 kV
upwards (based on a class I insulating joint and lightning • Nominal discharge current (8/20 µs): 100 kA
protection class I). If the length of the connection system • Lightning impulse current Iimp (10/350 µs): 100 kA
(SL+ 2*H according to Figure 2) can be limited to Û at the installation location
2) Max. discharge current with external voltage inter-
ference at installation site
3.5. COORDINATION EXFS WITH INSULATING JOINT
Coordination between the insulating section of the
insulating joint and the spark gap bridging this section
should ensure that the equalisation process following a
lightning discharge is carried out via the ExFS and not via
the insulating section of the insulating joint. The ExFS
thus represents a “ preset flashover point” which prevents
Figure 2 Length of the connection system
the occurrence of a discharge process with uncontrolled
sparking. At the same time the ignition of an explosive
atmosphere is avoided.Non-piggable?
Not anymore
Your challenge is our thrill.
With over 35 years of experience Intero has
specialized in the inspection of the most
challenging pipelines previously considered
non-piggable. We have the in-house
capabilities to combine all services required
to provide an effective solution for any challenge.
Read more about the challenges we worked
on and which solutions we performed
for our clients.
intero-integrity.com/services/pipeline-challenges
We
know
your
space intero-integrity.com22 PIPELINE TECHNOLOGY JOURNAL
RESEARCH / DEVELOPMENT / TECHNOLOGY
Coordination under the conditions of lightning discharge The maximum voltage drop across the entire connection
is basically given if the voltage across the insulation of system (Umax) of a spark gap arrangement at maximum
the insulating joint caused by the discharge process does current steepness must be smaller than the peak value of
not reach the value of the dielectric strength or flashover the test voltage of the insulating joint ÛPW (practical com-
strength. parison according to GW24).
Condition: Umax < ÛPW
z. B. Class 1 insulating joint: UPW = 5 kV
Peak value of UPW: ÛPW = UPW * √2 = 5 kV * √2 => ÛPW =
7 kV.
The maximum voltage drop Umax can be determined with
the following formula:
Umax = Ubo + Iimp * RL + L * di / dt
Ubo: arc voltage of the ExFS, depending on type
Determination based on data sheets [5] specific to the
Figure 3 Schematic voltage curve at the insulating joint under lightning manufacturer is also possible.
influence
3.5.3. CASE STUDY
As can be seen in Figure 3, during coordination, first of all
the sparkover performance of the ExFS and, after spark- What should be evaluated here is a spark gap installation
over, the voltage drop across the connecting cable must via an insulating joint buried in the ground (according to
be compared with the insulation strength of the insulating Fig. 4) with the objective of “protecting the insulating joint”
joint. in all phases of the lightning-induced discharge process.
To facilitate regular inspection, the ExFS should be con-
3.5.1. SPARKOVER OF THE EXFS
The impulse sparkover voltage Uas (1.2 / 50 µs) of an ExFS
must be 50 % lower than the rms value of the test AC
voltage UPW of the insulating joint (determined according
to GW24).
Condition: UasPIPELINE TECHNOLOGY JOURNAL 23
RESEARCH / DEVELOPMENT / TECHNOLOGY
nected underground but installed above ground: 3.5.4 CASE STUDY WITH COAX BOX SN
Connection cable length (outgoing and return line) of the
ExFS: 4.30 m Distance between the connection points S: The round conductor connection technology of the spark
0.3 m gap installation is now replaced by lightning-current-tested
ExFS: Ubo = 30 V; Uas = 5 kV; ÛPW = 7 kV)
Max. lightning current Iimp : 50 kA (10/350 µs) according
to estimation of the max. partial lightning current according
to DIN EN 62305-1
=> max. steepness: 5 kA/µs
Table 1: Voltage drops of round conductors 25 mm² calculated according to
GW24 [1]
Evaluation of the round conductor connection technology Figure 6: Coaxial connection technology
according to GW24:
a) Sparkover Length of the coaxial cable L: 2 m
Condition: Uas 1.25 kV max. steepness: 5 kA/µs
tecting the insulation” cannot be fulfilled in all phases of
the discharge process.
Other possible measures would be:
• Parallel connection of a further ExFS (type test recom-
mended)
• Increase the dielectric strength of the insulating joint
(e.g. 20 kVrms tested)
Table 2: Extract from the DEHN installation instructions for determining the
• Reduction of the inductance L of the connecting cable, voltage drop of the coaxial connection box
e.g. using coaxial connection solutions (see Figure 5)
Evaluation of the coaxial connection technology according
to GW24:
a) Sparkover
Condition: Uas 1.25 kV24 PIPELINE TECHNOLOGY JOURNAL
RESEARCH / DEVELOPMENT / TECHNOLOGY
b) Discharge ABBREVIATIONS:
Condition: Umax < ÛPW
Umax = 4.9 kV (value according to table 2) TRbF: technical regulation for flammable liquids, german
standard
4.9 kV < 7 kV (condition according to GW24 fulfilled ! ) TRGS: technical regulation for hazaradous substances,
german standard
RESULT: TRBS: technical regulation for operational safety, german
standard
The specially tested new connection technology of the GefStoffV: ordinance on hazardous substances
coaxial connection box with ExFS spark gap presents a BetrSichV: Ordinance on Industrial Safety, german stan-
technically simple method of positioning the ExFS above dard
ground for testing.
FORMULAIC CHARACTER
3.6. EXFS INSPECTION
UPW: AC test voltage 50 Hz rms
If the ExFS are used in hazardous areas, they must be Û PW: AC test voltage 50 Hz peak value
tested according to DIN EN 60079-17 [7] after three years Umax : maximum voltage drop
at the latest. An inspection of the ExFS with connection Iimp : impulse lightning current (wave shape 10/350 µs)
technology always consists of a visual inspection and a RL : ohmic resistance of the connection cable
metrological test. The visual inspection includes checking L : inductance of the connection cable
the ExFS with connection technology for the following: di / dt: average steepness of impuse lightning current Iimp
Ubo: arc voltage of the ExFS, depending on type
• Damage to the enclosure of the ExFS Uas: impulse sparkover voltage (see data sheet of the
• Correct mounting position according to installation manufacturer)
instructions of the manufacturer
• Insulation of the connecting cables
• Any loosening of the connecting cable References
• Contact stability
• corrosion of the ExFS installation 1.
2.
GW 24 , February 2014; cathodic protection in hazardous areas
GW 22 February 2014: measures on pipelines in case of AC influence from high voltage lines
• Suitability for installation in hazardous areas 3.
and railways
AfK-recommendation No. 6, June 2014: cathodic protection pipelines and storage tanks –
• Length of connecting cable > 300 mm ->Proof of coor- 4.
protection against electric shock
DIN EN 62305: 2010; protection against lightning – part 1 - 4
dination ExFS with insulating joint 5. IEC / EN 62561-3 : 2012; Lightning Protection System Components (LPSC) - Part 3: Require-
ments for isolating spark gaps
• For further test criteria see 3.3 6. product information Coax Box
https://www.dehn-international.com/store/p/en-DE/F584472/exfs-coaxial-connection-box
7. IEC / EN 60079-17: Explosive atmospheres - Part 17: Electrical installations inspection and
maintenance
A metrological test of the ExFS to check the short circuiting 8. DIRECTIVE 2014/34/EU OF THE EUROPEAN PARLIAMENT AND OF THE COUNCILof 26
February 2014on the harmonisation of the laws of the Member States relating to equipment
and adequate insulation capacity must be carried out in and protective systems intended for use in potentially explosive atmospheres
accordance with the respective manufacturer’s specifications
and test instructions. Electrical tests must be carried out
in the dismantled state and outside hazardous areas. If an
electrical test in the Ex-area is necessary, this may only be
carried out in close cooperation with the operator. Authors
4. SUMMARY Manfred Kienlein
DEHN SE + Co KG
With the new GW 24 [1], it is possible to evaluate the instal-
lation of ExFS in such a way that the goal of “protecting Global Account Manager Oil and
the insulating joint” can be guaranteed in all phases of the Gas Industry
lightning-related discharge process in a way that is univer-
sally comprehensible. The user has a variety of possible manfred.kienlein@dehn.de
technical measures at his disposal (spark-free or coaxial
connection technology), which can be applied to suit the
installation environment.INNOVATIVE TECHNOLOGY & CUSTOMISED SOLUTIONS FOR YOUR PIPELINE INTEGRITY
Overcoming the Challenges and
                                    Increasing Value in Fiber Optic Monitoring

Steven Koles, Ehsan Jalilian, John Hull > Hifi Engineering

Abstract
Distributed fiber optic sensing has been gaining significant momentum in pipeline industry adoption. The primary
application of this technology has been in preventative leak detection, but intelligent new applications such as
pipeline flow rate monitoring are now emerging and promise to deliver extra value to the pipeline operators.

We present a high fidelity dynamic sensing system (HDS), which is capable of sensing acoustics, temperature,
strain, and vibration over long distances in, on, or near a pipeline. We will discuss the practical considerations
and challenges of deploying this technology in the field, including long distance fiber jetting, on and off the pipe
placement, deployment in existing conduits, placement underneath riverbeds and roads, internal deployment, and
micro-trenching. An overview of conduit sizing and thickness design tradeoffs and their impact on sensitivity will
also be provided.

Case studies will be provided to showcase the value of using artificial intelligence and machine learning to explore
new frontiers in pipeline monitoring. A variety of “value added” applications such as flow anomaly detection, flow
rate, pressure, and density estimation will be discussed in detail. Other applications such as pig, vehicle, and train
detection and tracking will also be presented.

A discussion of the critical design criteria for the creation of scalable client notification and data delivery plat-
forms will also be provided. Design considerations include the diversity of customer personas and the associated
requirement of interface customizability, the need for scalability to accommodate the always-growing volume of
data, future-proof design to permit on-the-fly addition of new events and data streams with minimal core platform
modifications, and intuitive user interface design requirements.
PIPELINE TECHNOLOGY JOURNAL 27
RESEARCH / DEVELOPMENT / TECHNOLOGY
1. INTRODUCTION
Pipeline safety is a top concern for the general public, a few hundred meters to a few kilometers apart. For on
governments, and energy companies. Leaks can be caused the pipe placement, pipeline tape, special clamps, pipe-
by integrity failures due to sudden ruptures, accumulated line grade adhesives, or sandbags can be used to secure
strain, ground movement, etc. Pipeline companies rely on the conduit to the pipe prior to backfilling the trench. A
a number of technologies such as mass balance systems, placement in the 11 o’clock to 1 o’clock range is optimal as
aerial surveillance, and inline inspection tools to monitor it provides high sensitivity while reducing the chances of
the integrity of their pipelines on a regular basis. the conduit getting crushed by the pipe during the back-
fill process. Sufficient slack allowances must be made to
Fiber optic pipeline monitoring has the advantage of prevent excessive strain on the conduit in case of thermal
continuous monitoring in both time and space. Deploying expansion of the pipe.
the fiber optic cable on, near, or inside the pipe effectively
transforms it into a powerful suite of distributed sensors.
Hifi Engineering’s HDS technology utilizes the power of
high fidelity fiber optic dynamic sensing to detect small
changes in the optical path length between two adjacent
fiber bragg gratings (FBGs), which are used as low angle
wavelength reflectors. These perturbations are represen-
tative of the strain, vibration, acoustic, and thermal energy
which is applied to the fiber optic sensor.
A variety of independent event identification algorithms
are applied to the data acquired from the fiber optic sen-
sors to detect the occurrence of pipeline integrity related
events such a leaks, flow anomalies, or excessive strain.
Further algorithms are also used to track pigs in the pipe-
line, estimate flow rate and pressure, etc.
2. DEPLOYMENT CONSIDER-
ATIONS AND CHALLENGES
Fiber optic deployment methods may be divided into three Figure 1 - On the pipe fiber installation
categories of on the pipe external placement, off the pipe
external placement, and internal placement. On the pipe Burying pre-loaded conduit during the construction phase
placement (see Figure 1) is ideal for new constructions is a possibility. In some cases the operator may prefer to
as it maximizes acoustic and strain sensitivity, though in simply deploy an empty conduit during the construction
some cases the client may prefer to place the fiber a short phase and use specialized fiber injection equipment (see
distance away from the pipe due to deployment consider- Figure 2) to jet the fiber into the conduit after the comple-
ations, or in an effort to monitor multiple parallel pipes. It tion of this phase and the backfilling of the trench. This
is best practice to keep the fiber optic cable no more than option has the added advantage of minimizing the number
one meter away from the pipe. of required fiber splices.
Due to the fragile nature of fiber optics, it is imperative that
the sensors be deployed inside a protective housing such
as stainless steel tubing or HDPE conduits. From a prac-
tical perspective, deploying in multi-duct HPDE conduits
provides the greatest level of flexibility during the deploy-
ment while allowing the operator to deploy extra fiber
optics, control cables, etc. in the future if needed.
Conduit based deployments generally involve the place-
ment of an empty or pre-loaded conduit on or near the
pipe during construction, and using splice enclosures to
connect the conduit segments. Depending on the specific
Figure 2 - Fiber injection at into buried conduit at a hand-hole site
deployment, the splice enclosure can be anywhere from28 PIPELINE TECHNOLOGY JOURNAL
RESEARCH / DEVELOPMENT / TECHNOLOGY
In some deployment cases such as placement underneath Practical considerations regarding conduit sizing include
riverbeds and roads, sections of the pipe must be placed crush rating, the number of fiber optic strands to be fitted
using horizontal directional drilling (HDD). Using redundant inside, and the transportability of the conduit spool. Of
conduits minimizes the chances of all conduits being dam- great importance is the thickness of the conduit as it
aged throughout the drilling and pull back process. In such directly bears on crush rating and preventing compro-
cases, multiple conduits (see Figure 3) can be attached mising the conduit (see Figure 5), however the increased
to the pipe near the pull-head and then pulled alongside thickness also results in higher levels of acoustic signal
the pipe in the bore (see Figure 4). It is recommended that attenuation. Mechanical models have been developed
the conduit not be taped to the pipe to allow it to rotate to calculate the optimal inner and outer diameters of the
and move around freely while being pulled inside the bore, conduit to strike the proper balance between sensitivity
otherwise the conduit may experience excessive strain and and robustness.
be damaged during the process of boring.
Figure 3 - A multi-duct HDPE conduit
Figure 5 - A compromised conduit
Figures 6 and 7 below show the relationship between con-
duit thickness and crush rating and acoustic attenuation.
Existing pipelines pose a challenge to the deployment of
fiber optic sensors. Generally, two approaches are pos-
sible. The first involves micro-trenching near the pipe to
allow the conduit placement. This approach works in some
cases, but can pose a safety risk to the pipeline. In some
cases, hydro-vacuuming may be used to expose short
pipe segments in order to deploy the fiber optic sensor. In
some cases of existing pipelines such as river crossings,
internal deployment may be the most suitable choice.
Internal deployment is often accomplished by inserting the
fiber optic conduit into the pipe at a valve or other ingress
location (see Figure 8) and using a tow pig (see Figure
9) to pull the fiber along with the flow inside the pipe. A
dislodgement mechanism such as using mechanical sheer
force will need to be used to separate the fiber from the
pig once the cable is laid inside the pipe. It’s also possible
to use degradable pigs that dissolve over time with the
pipeline flow.
Figure 4 - HDD pullPIPELINE TECHNOLOGY JOURNAL 29
RESEARCH / DEVELOPMENT / TECHNOLOGY
Figure 6 - Conduit sizing impact on crush rating
Figure 7 - Conduit sizing impact on acoustic attenuation
Figure 8 - Internal deployment schematics Figure 9 - Fiber optic cable attached to tow pig for internal deployment30 PIPELINE TECHNOLOGY JOURNAL
RESEARCH / DEVELOPMENT / TECHNOLOGY
3. DATA PROCESSING AND EVENT IDENTIFICATION nsupervised learning methods such as cluster analysis are
useful in cases where sufficient training data for the event
Machine Learning and Artificial Intelligence are rapidly of interest is unavailable, or the available training data, e.g.
gaining prominence as the preferred methods of choice for simulated leaks, is not relevant to the specific deployment
event detection. Supervised learning approaches such as environment. Algorithms can be trained to analyze the data
classification algorithms are powerful tools that can utilize to ‘learn’ baseline activity such as the ambient acoustics or
a large database of known events, for instance simulated frequent events, e.g. train crossings. The extracted features
leaks, to train a monitoring system to detect events such are divided into various clusters of previously observed
as pipeline leaks, pig runs, and flow anomalies. Decision events, without a need for the clusters to be labeled. If the
Tree and Support Vector classifiers are particularly useful features of a future event fall outside these known clusters,
for event detection, however the classification outcomes they will be flagged as anomalies which need to be further
may be impacted if adequate data conditioning, feature processed.
extraction, and labeling is not performed. The risk of
overtraining the data must be taken seriously and appro- Among the value added applications of pipeline fiber optic
priately mitigated by dividing the data into training, test, monitoring are pig tracking and flow, pressure, and density
and validation datasets. It’s also good practice to train and estimation. Pig tracking enables pipeline companies to
test the event detection algorithms using data from various know the exact location of the pig, along with its speed
different deployments to ensure robustness and avoid and arrival time at the next pig catching station.
overtraining.
Figure 10 - Pig tracking dataYou can also read