Plan Strategic - Believe Achieve Succeed - ebpquebec.com
←
→
Page content transcription
If your browser does not render page correctly, please read the page content below
Strategic
            Plan
             2011-2016

Believe
 Achieve
 Succeed

EASTERN SHORES
  SCHOOL BOARD
Acknowledgement
                                                                    of Contributions
    ADMINISTRATION:          Dave Royal, former Director General
                             Howard Miller, Director General
                             Lisa Mosher, Director of Educational Services
                             Eugene Willett, (former Director of Educational Services)
    CENTER ADMINISTRATORS: Debbie Adams, Wakeham
                           Christine Grenier, Anchor
                           Marjorie Woodman, New Richmond/Maria
                           Owen Mailloux, Listiguj
                           Chantal Pitt, Northern Lights
    COMMUNITY PARTNERS:      Committee for Anglophone Social Action (CASA)
                             North Shore Community Association (NSCA)
                             Vision Gaspe-Perce Now
    CONSULTANTS:             Sheryl Hayes, English Language Arts
                             Ann Guilbeault, Math and Science
                             Pat Ryan (former Consultant) Math and Science
                             Nancy Langlois, French Second Language
                             Charlotte Roy, (former Consultant) French Second Language
                             Lili Sun, Librarian
                             Melanie Hayes, Analyst
                             Brett Mitchell, RECIT
                             Ray Venables, (former RECIT)
    COORDINATORS:            Greg McWhirter, (former Coordinator) Integrative Technologies
                             Corey Dugas, Integrative Technologies
                             Ken Ward, Adult Education
                             Gail Atkinson, Complimentary Services
    SARCA:                   Marjorie Robinson, SARCA
    SCHOOL ORG. TECHNICIAN: Linda Woodman, Adult Education
    TRANSLATION:             Margaret Ann Cooke, Secretary General
    SCHOOL PRINCIPALS:       Laura Hurley, (former Teacher-Principal) Baie Comeau
                             Alice Dell, Bonaventure Poly
                             Hugh Wood, Grosse Ile and Entry Island
                             Byron Edwards, (former Principal) Escuminac
                             Daniel Gallagher, Gaspe Polyvalent
                             Jennifer Roy, (former Principal) Gaspe Poly
                             Jane Bradley, Evergreen and St. Patrick’s
                             Karen Kean, Fermont
                             Karen Fequet, Flemming
                             Beryl Boyle, Gaspe Elementary and Belle Anse
                             Maxine Lemieux (former Teacher-Principal) Belle Anse
                             Brett Mitchell, Metis Beach
                             Kristy Larose, New Carlisle
                             Brian Rock (former Principal), New Richmond
                             Lavergne Fequet, Queen Elizabeth and Baie Comeau
                             Shaunna Goudie, Riverview
                             John Prince (former Teacher-Principal), Shigawake-Port Daniel

2
Table of Contents

Introduction                                               4

Context                                                     9
   Vision Statement                                         9
   Mission Statement                                        9
   Economies of Scale                                       9
   Socio-economic conditions                               12
     Unemployment                                          13
     Low income                                            13
     Government Assistance                                 14
     Bilingualism                                          14
     Low Education Levels                                  14
     Note                                                  14
   Outside of Administrative Region 11 – the North Shore
   or Region 09 of ESSB                                    14
      Income levels                                        14
      Unemployment                                         14
      Community Profile                                    14
      Educational levels of attainment                     15
      Linguistic profile                                   15
   Health and Social Service Conditions                    16
     Limited Access to Health Services in English          16
     Cultural Identify and Sense of Belonging              16
     Community Loyalty and Leadership                      17
     School Safety and Security                            17
     Tell Them from Me Survey Instrument                   17
     Violence in Schools                                   17
   Special Needs Students and Required Services            18
   Adult and Vocational Education Centers                  18
     Diverse Needs                                         18
     Shared concerns                                       19

Orientations                                               20

Glossary and Terms                                         23

Annex 1                                                    25
NORTH SHORE COMMUNITY ASSOCIATION
SOCIO-ECONOMIC PROFILE SUMMARY OF QUEBEC’S
ENGLISH-SPEAKING COMMUNITIES

                                                                3
Introduction
    Eastern Shores School Board is the only school board            vious year. However, official enrolment as of September
    that occupies three administrative regions in the               30, 2012, was 1236 students, indicating some stability
    province of Quebec: Region 11 (Gaspesie-Iles-de-la-             in the youth sector.  Adult education enrolment for the
    Madeleine), Region 09 (Cote Nord) and Region 01                 school year 2010-11 was 352 and 256 for 2011-12 (an
    (Bas St. Laurent). See Chart I. There are 18 schools and        internal calculation of full-time and part-time) students
    6 adult education centers.  Of the 18 schools, 6 are            engaged in academic upgrading and vocational training.
    elementary, 4 are secondary, and the remaining 8 are            In 2000-01, youth sector enrolment was at 1,530, repre-
    combined elementary-secondary schools.  13 of the               senting an overall drop of 294 students or 19% from our
    18 schools and 5 of the 6 adult education centers are           current situation.  Our rate of decline in student regis-
    located in Region 11.  Five schools and 1 adult edu-            trations is greater than that of all other Anglophone
    cation center are located on the North Shore (in Baie           school boards who between 2001 and 2010 dropped
    Comeau, Port Cartier, Sept Iles and Fermont.  Finally,          by approximately 9% (Chart 2).  MELS enrolment trends
    Metis Beach School is located between Rimouski and              suggest that the number of Anglophone students may
    Matane, just outside the border of what is considered           be on the increase between now and 2025, 1.1% prov-
    to be the Gaspésie (Bas St. Laurent).                           incially (Chart 3) and 20.6% for Eastern Shores School
                                                                    Board (Chart 4).  This government forecast in student
    Youth sector enrolment, as of September 30, 2011, was           numbers could serve as a regional catalyst for ensuring
    1,238 students, a decrease of 51 students from the pre-         the life of our schools and centers, and the viability of
                                                                    our communities and their institutions.

                                                                    [ CHART        1]         Administrative regions
                                                                                              in the province of Québec

                                                                    01   Bas-Saint-Laurent
                                                                    09   Côte-Nord
                                                                    11   Gaspésie–Îles-de-la-Madeleine

                                        09

                                         01      11

                                                               11
                                                                                     Believe
4
[ CHART   2]
 Evolution of the Anglophone student population by school board from 2000-2001 to 2009-2010

                                                                            2000-01             2004-05             2009-10
                                         Présecondaire                        2777                2977                2812
           CQSB                          Secondaire                           1415                1674                1764
                                         Total                               4192                 4751                4626

                                         Présecondaire                        925                 858                 720
           ESSB*                         Secondaire                           605                 607                 562
                                         Total                                1530                1465                1282

                                         Présecondaire                        3938                3751                2968
           ETSB                          Secondaire                           2388                2616                2462
                                         Total                                6326                6367                5430

                                         Présecondaire                       6890                6640                 5310
           RSB                           Secondaire                          3926                4482                 4289
                                         Total                               10816               11122                9599

                                         Présecondaire                        8278                8484                7929
           SWLSB                         Secondaire                          4569                 5984                6721
                                         Total                               12847               14408                14500

                                         Présecondaire                        4909                4142                3652
           WQSB                          Secondaire                           3293                3608                3251
                                         Total                               8202                 7750                6903

                                         Présecondaire                       16882               15596                11856
           EMSB                          Secondaire                          9246                10488                9923

                                                                                                                                     Achieve
                                         Total                               26309               26084                21779

                                         Présecondaire                       17288               16181                13274
           LBPSB                         Secondaire                          10395               11481                11685
                                         Total                               27683               27662                25959

                                         Présecondaire                        2932                2512                2024
           NFSB                          Secondaire                           1903                2077                1809
                                         Total                                4835                4589                3833

                                         Présecondaire                      64820               61141                 50545
           Commissions
                                         Secondaire                         37920               43023                 42466
           Scolaires anglo
                                         Total                              102740              104164                93911

          Sources : MELS : P21sc1 : Tableau 1 : Prévision de l’effectif associé à la commission scolaire (une fiche par commission
               scolaire anglophone)  réseau public, 18 février 2011.
          *Note : ESSB services 1.3% of students enrolled in Anglophone school boards.

                                                                                                                                               5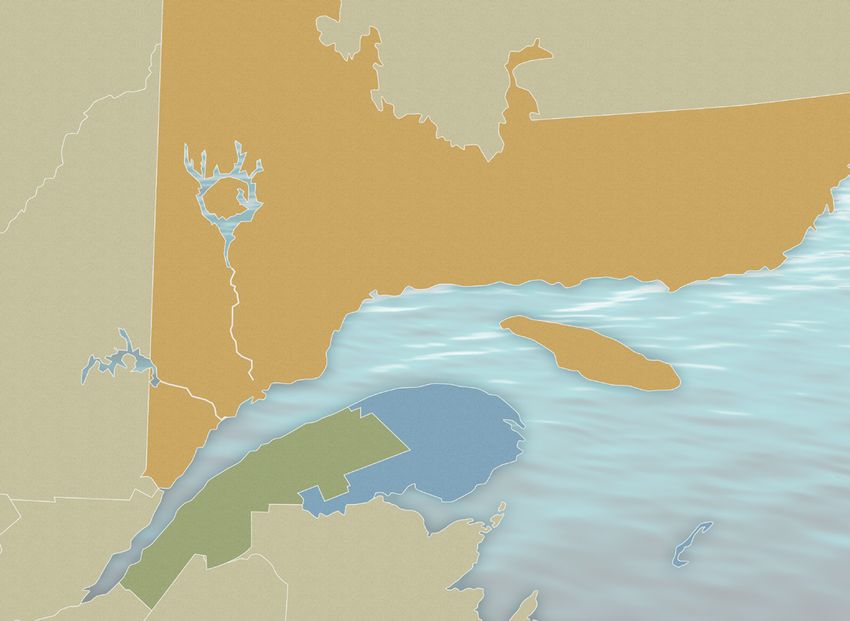
[ CHART               3]
                       Enrolment trends over the province of Québec (Excluding the territories covered by the Cree,
                       Kativik, Littoral School Boards) public network, youth sector, full-time academic,
                       language of instruction: English

                  Observations                                    Prévisions
                   2005-     2006-     2007-    2008-    2009-    2010-    2011-    2012-    2013-    2014-    2015-    2016-    2017-    2018-    2019-     2020-   2021-    2022-    2023-    2024-
                   2006      2007      2008     2009     2010     2011     2012     2013     2014     2015     2016     2017     2018     2019     2020      2021    2022     2023     2024     2025
Maternelle             553      480      457      475      531      509      549      591      581      577      573      568      562      561      560       560     559      557      556      555
4 ans
Maternelle
5 ans                7 086    6 872     6 604    6 730    6 628    6 952    6 885    7 366    7 885    7 819    7 770    7 739    7 701    7 662    7 667    7 695    7 719    7 737    7 750    7 757

Total                7 639    7 352     7 061    7 205    7 159    7 461    7 434    7 957    8 466    8 396    8 343    8 307    8 263    8 223    8 227    8 255    8 278    8 294    8 306    8 312
Primaire 1.1         7 331    7 163     6 947    6 688    6 873    6 742    7 073    7 006    7 499    8 030    7 963    7 912    7 879    7 841    7 801    7 806    7 834    7 858    7 876    7 891
Primaire 1.2         7 836    7 460     7 260    6 977    6 730    6 927    6 800    7 134    7 064    7 565    8 102    8 035    7 983    7 949    7 911    7 870    7 876    7 905    7 929    7 947
Primaire 2.1         8 339    7 706     7 390    7 213    6 970    6 702    6 902    6 776    7 109    7 040    7 540    8 075    8 009    7 956    7 924    7 886    7 845    7 852    7 881    7 906
Primaire 2.2         8 722    8 364     7 705    7 430    7 306    7 029    6 760    6 962    6 838    7 175    7 104    7 611    8 153    8 086    8 031    7 999    7 960    7 919    7 926    7 955
Primaire 3.1         9 411    8 674     8 303    7 692    7 484    7 318    7 041    6 772    6 978    6 852    7 190    7 118    7 626    8 168    8 101    8 046    8 014    7 975    7 935    7 942
Primaire 3.2         9 577    9 418     8 708    8 346    7 787    7 549    7 382    7 104    6 834    7 042    6 919    7 259    7 186    7 703    8 249    8 181    8 124    8 092    8 053    8 013
Total              51 216    48 785    46 313   44 346   43 150   42 267   41 958   41 754   42 322   43 704   44 818   46 010   46 836   47 703   48 017   47 788   47 653   47 601   47 600   47 654
PRÉ-
SECONDAIRE         58 855    56 137    53 374   51 551   50 309   49 728   49 392   49 711   50 788   52 100   53 161   54 317   55 099   55 926   56 244   56 043   55 931   55 895   55 906   55 966

Secondaire 1.1       9 146    8 905     8 706    8 162    7 699    7 233    7 015    6 856    6 602    6 357    6 556    6 450    6 761    6 689    7 178    7 686    7 623    7 569    7 540    7 503
Secondaire 1.2       9 367    9 361     9 132    8 915    8 437    7 922    7 444    7 220    7 052    6 796    6 543    6 747    6 643    6 962    6 885    7 392    7 913    7 850    7 794    7 764
Secondaire 3         9 146    9 493     9 429    9 471    9 255    8 715    8 174    7 696    7 465    7 277    7 024    6 762    6 960    6 868    7 195    7 114    7 643    8 191    8 119    8 062
Secondaire 4         8 704    8 820     9 139    8 990    8 900    8 783    8 267    7 753    7 290    7 072    6 902    6 654    6 406    6 602    6 493    6 809    6 737    7 226    7 747    7 669
Secondaire 5         7 522    7 951     7 972    8 264    8 284    8 174    8 048    7 576    7 100    6 675    6 471    6 320    6 085    5 855    6 024    5 912    6 199    6 143    6 575    7 050
Secondaire 7,8         45        21       31        4       67       37       36       37       32       30       28       29       28       25       25        26      25       27       25       27
Total              43 930    44 551    44 409   43 806   42 642   40 864   38 984   37 138   35 541   34 207   33 524   32 962   32 883   33 001   33 800   34 939   36 140   37 006   37 800   38 075
ENSEMBLE           102 785   100 688   97 783   95 357   92 951   90 592   88 376   86 849   86 329   86 307   86 685   87 279   87 982   88 927   90 044   90 982   92 071   92 901   93 706   94 041

                                        Enrolment evolution by order of instruction (September 30, 2009= 100)
                 140                                                                                                                                                 Succeed
                 120

                 100

                  80

                  60

                  40
                     2005 2006 2007 2008 2009 2010 2011 2012 2013 2014 2015 2016 2017 2018 2019 2020 2021 2022 2023 2024

                                                                     maternelle              primaire             secondaire

                 Table : This data, limited to the youth sector, include EHDAA students, in francization and in welcoming class, as well as full-time drop
                      outs.  They exclude part-time students and those in professional studies.
                 Sources: Direction de la recherché, des statistiques et de l’information;  Entrepôt de données ministériels (EDM)

        6
[ CHART 4]
Enrolment trends for Eastern Shores School Board (882) Public network, in the youth sector,
full-time academic training, language of instruction: English
Chart Observations Prévisions
4.1 2005-
2006
2006-
2007
2007-
2008
2008-
2009
2009-
2010
2010-
2011
2011-
2012
2012-
2013
2013-
2014
2014-
2015
2015-
2016
2016-
2017
2017-
2018
2018-
2019
2019-
2020
2020-
2021
2021-
2022
2022-
2023
2023-
2024
2024-
2025
Maternelle 73 51 39 61 85 75 90 114 98 98 96 94 92 92 91 90 89 88 87 86
4 ans
Maternelle 89 97 89 62 96 97 87 104 132 113 113 110 109 107 106 105 104 103 102 101
5 ans
Total 162 148 128 123 181 172 177 218 230 211 209 204 201 199 197 195 193 191 189 187
Primaire 1.1 110 86 102 93 65 100 101 91 109 138 118 118 115 114 112 111 110 109 108 107
Primaire 1.2 122 112 89 105 99 68 105 106 95 114 144 124 124 120 119 117 116 115 114 113
Primaire 2.1 103 112 101 86 104 96 66 101 102 92 110 139 120 120 116 115 113 112 111 110
Primaire 2.2 105 101 120 110 91 111 103 70 108 109 98 117 148 128 128 124 123 121 120 119
Primaire 3.1 103 103 94 116 110 89 108 101 68 106 107 96 114 145 125 125 121 120 118 117
Primaire 3.2 121 104 112 102 120 116 94 114 107 72 112 113 102 121 153 132 132 128 127 125
Total 664 618 618 612 589 580 577 583 589 631 689 707 723 748 753 724 715 705 698 691
PRÉ- 826 766 746 735 770 752 754 801 819 842 898 911 924 947 950 919 908 896 887 878
SECONDAIRE
Secondaire 1.1 125 126 97 110 95 114 110 89 108 102 69 107 108 97 115 146 126 126 122 121
Secondaire 1.2 142 133 121 111 118 102 123 119 96 116 110 74 115 116 105 124 157 136 136 131
Secondaire 3 134 172 163 163 148 155 134 162 157 126 153 145 97 151 153 138 163 207 179 179
Secondaire 4 138 94 127 109 115 103 108 94 113 110 88 107 101 68 106 107 96 114 145 125
Secondaire 5 98 122 76 105 92 96 86 90 78 94 92 73 89 84 57 88 89 80 95 121
Secondaire 7,8 0 0 0 0 0 0 0 0 0 0 0 0 0 0 0 0 0 0 0 0
Total 637 647 584 598 568 570 561 554 552 548 512 506 510 516 536 603 631 663 677 677
ENSEMBLE 1 463 1 413 1 330 1 333 1 338 1 322 1 315 1 355 1 371 1 390 1 410 1 417 1 434 1 463 1 486 1 522 1 539 1 559 1 564 1 555
Enrolment trends for 0-4 year old preschool population
Chart 4.2
2005- 2006- 2007- 2008- 2009- 2010- 2011- 2012- 2013- 2014-
2006 2007 2008 2009 2010 2011 2012 2013 2014 2015
0 an 87 81 90 118 105
Estimate of the population 1 an 108 105 93 115 148 126
(by correspondence
preference: English) by age on 2 ans 88 111 110 97 122 155 132
September 30 3 ans 107 92 113 113 105 126 160 136
4 ans 137 116 105 125 129 116 139 176 150 150
Kindergarten 4 years old (the
attendance rate is the proportion taux (%) 53 44 37 49 66 65 65 65 65 65
of enrolment in relation to the
population of 4 year olds in the
same year.) effectifs 73 51 39 61 85 75 90 114 98 98
Kindergarten 5 years old (the
passing rate is the proportion taux (%) 71 77 59 77 75 75 75 75 75
of enrolment in relation to the
population of 4 year olds of the
previous year.) effectifs 97 89 62 96 97 87 104 132 113
7
Passing rate of enrolment (in %)
     Chart 4.3       2005 to 2006   2006 to 2007   2007 to 2008   2008 to 2009   PRÉVUS
     M5-P1.1             97             105            104            105          105
     P1.1-P1.2           102            103            103            106          105
     P1.2-P2.1           92             90             97             99           97
     P2.1-P2.2           98             107            109            106          107         Table : This data, limited to the
                                                                                                    youth sector, include EHDAA
     P2.2-P3.1           98             93             97             100          98               students, in francization and
                                                                                                    in welcoming class, as well
     P3.1-P3.2           101            109            109            103          106              as full-time drop outs.  They
                                                                                                    exclude part-time students
     P3.2-S1.1           104            93             98             93           95               and those in professional
     S1.1-S1.2           106            96             114            107          108              studies.  The long-term
                                                                                                    trends (over 5 years) are
     S1.2-S3             121            123            135            133          132              speculative; they illustrate
                                                                                                    the continuation of trends
     S3-S4               70             74             67             71           70               observed over past years.
                                                                                               Sources: Direction de la recherché,
     S4-S5               88             81             83             84           83               des statistiques et de
                                                                                                    l’information;  Entrepôt de
     S5-S78               0              0              0              0            0               données ministériels (EDM)

    Chart 4.4 Evolution of enrolment by order of instruction (September 30, 2009 = 100)

                                                                                                                 Believe
     140

     120

     100

      80

      60

      40
       2005 2006 2007 2008 2009 2010 2011 2012 2013 2014 2015 2016 2017 2018 2019 2020 2021 2022 2023 2024

                                    maternelle      primaire       secondaire

8
Context

Vision Statement

                                                                             5]
At Eastern Shores School Board, we are committed
to being an effective learning community, which pro-        [ CHART
motes life-long learning goals.  We model respect for
the individual and we nurture a caring and safe en-              Eastern Shores School Board Territorial
vironment in our Youth schools and Adult centers.  We            Size - Establishing approximate-estimated
provide quality teaching and educational leadership              travel/road and/or nautical distance
to ensure that each and every student maximizes his              between school communities
or her potential for success and becomes a respon-
sible and productive citizen.
                                                                                                                  Distance in
                                                                                Location                          Kilometers
                                                            New Carlisle Board office                                 0
Mission Statement
                                                            Bonaventure Poly                                          15
The Mission of Eastern Shores School Board is to pro-       New Richmond High School                                  46
vide leadership that will contribute to the best pos-       Escuminac                                                107
sible teaching-learning environment in each of our          Metis Beach                                              239
schools and centers.  It is our mission to promote this
learning in an atmosphere of mutual respect among           Ferry transport (Matane - Baie Comeau)                   263
all stakeholders.  It is our goal that students entrusted   Baie Comeau                                              305
to us will become caring, autonomous and respon-            Port Cartier                                             467
sible citizens of the 21st century.                         Sept Iles                                                517
                                                            Fermont                                                  881
Economies of Scale                                          Les Iles de la Madeleine                                 1763
                                                            Gaspé                                                    1959
Eastern Shores School Board has the territorial             Belle Anse                                               1994
boundaries of a country and a student population the
size of a village. From a geographic standpoint, the        Chandler                                                 2061
government provides no statistical comparisons of           Shigawake                                                2111
school board size apart from budgets and student en-        New Carlisle Board office                                2134
rolment.  So we have established our own calculation.
Traveling in a circular route, with the New Carlisle        Sources: http://distancecalculator.globefeed.com/Country_Distance_
                                                                 Calculator.asp
Board office as the starting point, and then visiting all   ESSB Travel Policy ES-233, December 15, 2010
schools and centers by road, by sea, and by air (for
not all our schools and centers are accessible by road
alone), the round-trip journey encompasses a circum-

                                                            Achieve
ference of 2,134 kilometers (Chart 5). Our territory is
so large, that even the Quebec government could not
include all our schools and centers within one desig-
nated administrative region (Chart 6).

                                                                                                                                 9
Conversely, ESSB has the second smallest enrolment in Quebec is $6,007 (Chart 7). Because ESSB has no
of the 72 public school boards (Anglophone and economies of scale to benefit from, provincial across-
Francophone) in the province of Quebec (Chart 7). the-board cutbacks in funding, even though they
Among the nine Anglophone school boards, we rep- might be proportionately scaled, have a more devas-
resent 1.3% of the student population (Chart 2). The tating impact on our operations, stretching already
implications of our territorial size and sparse popula- limited resources beyond reasonable limits. For ex-
tion are many and varied, impacting on distribution ample, meetings of our school board commission-
of human and material resources and timely delivery ers or of our principals and center administrators, or
of services to English-speaking families - not just in workshops with teachers and other support person-
education, but in health and social services as well. nel, cost many thousands of dollars in transportation
and overnight stays for most participants, not to men-
From a financial standpoint, Eastern Shores School tion work hours lost due to travel time, often meas-
Board has the second highest cost per student at ured in days (to and from the meeting location).
$11,668; the lowest Anglophone cost per student
[ CHART 6]
Map of Eastern Shores School Board Territory
FERMONT
NORTHERN LIGHTS
Adult Ed.
QUEEN
ELIZABETH
FLEMMING
RIVERVIEW
BAIE COMEAU
WAKEHAM
Adult Ed.
GASPÉ Poly. GASPÉ Elem.
MÉTIS BEACH BELLE ANSE
EVERGREEN
SHIGAWAKE
ST-PATRICK
NEW RICHMOND PORT-DANIEL
ESCUMINAC
LISTUGUJ GROSSE ISLE
Adult Ed. BONAVENTURE NEW CARLISLE Adult Ed.
GROSSE ISLE
ENTRY ISLAND
10Succeed
[ CHART 7]
Indicateurs du Gestion 2006-07 (latest version available on MELS website)
donnés par lacommission scolaire - Coût par élève des dépenses retenues
(formation générale des jeunes et des adultes et professionels)
School Board Education Administration Buildings Total Enrolment
English Montreal $5 375 $390 $688 $6 453 30 209
Lester B. Pearson $5 091 $419 $591 $6 101 29 072
Sir Wilfred Laurier $5 079 $484 $641 $6 204 15 086
Riverside $5 020 $438 $549 $6 007 10 980
Phares, des $6 090 $406 $739 $7 228 10 389
Western Quebec $5 247 $384 $839 $6 469 7 971
Eastern Townships $6 129 $514 $651 $7 294 6 601
René-Lévesque $6 863 $572 $818 $8 252 6 522
Fer du $6 826 $790 $1 059 $8 675 5 170
New Frontiers $5 332 $629 $572 $6 712 4 980
Central Quebec $5 735 $734 $660 $7 128 4 817
Fleuves et des Lacs $7 147 $723 $978 $8 848 4 505
Harricana $6 744 $738 $847 $8 330 4 229
Chic Chocs $7 258 $980 $789 $9 027 3 921
Hauts-Bois-de-l'Outaouais $6 538 $705 $818 $8 061 3 809
Charlevoix $6 340 $767 $796 $7 903 3 534
Lac Abitibi $6 966 $780 $908 $8 654 3 512
Lac Temiscamingue $7 828 $909 $953 $9 960 2 436
Baie-James $8 056 $1 629 $1 370 $11 055 2 427
Les Iles $6 839 $1 206 $1 002 $9 048 1 713
Eastern Shores $9 157 $1 357 $1 154 $11 668 1 561
Moyenne-Côte-Nord $10 395 $1 948 $1 979 $14 322 0,752
Notes: For comparative purposes, the above chart includes the nine English school boards, the neighborhood Francophone school boards of Eastern Shores,
and all Francophone school boards, whose enrolment is 0-4999 according to MELS classification of “strata”.Only 5 school boards have enrolment
below 2,500 students. Eastern Shores is the second smallest school board in the province with the second highest cost per
student. ESSB also covers the largest territory of any school board in Quebec.
11Our schools and centers do, however, also benefit
from our small size and large territory insofar as
government parameters provide lower class sizes.
[ CHART 8]
Relationships among staff, students, and families Overview Summary of the Number of
are stronger based on more intimate connections Community Partnerships existing in ESSB
(see Healthy Schools). Making a virtue of neces- Schools and Centers
sity, our schools have traditionally been the hub of Number of
our communities, around which many social, cul- Partnerships
tural, and physical activites take place. Currently, SCHOOL
ESSB has six Community Learning Centers (CLCs) in
Baie Comeau 23
Gaspe, Metis Beach, Baie Comeau, New Carlisle,
New Richmond and Grosse Ile. Most of our schools Bonaventure Poly 45
and centers are already modelled after the CLC Fermont Elementary 6
concept. Insofar as there are very few Anglophone Flemming Elementary 14
organizations to respond to Anglophone commun-
Gaspe Elementary 27
ity needs, our schools and centers fill that void of
sports and recreational activities by providing a Gaspe Polyvalent 25
variety of extra-curricular enrichment to our stu- Grosse Ile 16
dents and their families. Chart 8 provides a sum- Entry Island 8
mary overview of the number of ESSB school/
Metis Beach 100
center partnerships. This has been a natural pro-
gression of responses to evolving socio-economic New Carlisle 27
and cultural-linguistic needs. New Richmond 60
Queen Elizabeth HS 16
Riverview Elementary 8
Socio-economic conditions
Shigawake-Port Daniel 13
In 2007-08, 16 of our 18 schools were classified St. Pat's Elementary 24
and funded as NANS (New Alternatives, New
Solutions) schools, recognized within government ADULT ED CENTERS
designated milieu defavorise territorial maps. Six The Anchor New Carlisle 5
of those schools have a decile ranking of 10 (the
New Richmond 5
lowest socio-economic conditions), six with a rank-
ing of 9, two with a ranking of 8, and one with a SARCA 10
ranking of 7 (Chart 9). This leaves only three of Wakeham 18
our eighteen schools with slightly better socio-eco-
nomic circumstances.
What are the statistics that bear witness to the
Anglophone economic reality? And what is the
impact of that reality on our students, their fam-
ilies, and the communities of our territory? The
below mentioned socio-economic statistics were
provided by the Committee for Anglophone Social
Action (CASA): “A Portrait of the English Speaking
Community, March 2010” (www.essb.qc.ca/
ACPESCC.pdf).
12
Believe[ CHART 9]
Indices de défavorisation par école - 2010-2011 - Eastern Shores School Board
ÉCOLES PRIMAIRES Indice Rang Indice de Rang Nombre
du seuil
Code de Nom de l’école décile milieu socio- décile d’élèves
de faible
l’école (SFR) économique (IMSE) (30/09/2010)
revenu
882002 École secondaire de New Carlisle 16,88 7 15,70 8 49
882003 École de Métis-sur-Mer 10,16 4 14,10 7 31
882004 École de Shigawake--Port Daniel 13,12 6 23,19 10 49
882008 École secondaire de Grosse-Île 1,08 1 19,42 9 36
882011 École secondaire de New Richmond 10,44 4 14,82 8 50
882015 École Primaire de Gaspé 12,73 5 20,58 9 66
882017 École Saint-Joseph-Saint-Patrick 22,00 8 25,73 10 45
882018 École Primaire Flemming 13,16 6 22,70 10 107
882019 École secondaire de Baie Comeau 6,82 2 8,64 4 37
ÉCOLES SECONDAIRES Indice Rang Indice de Rang Nombre
du seuil
Code de Nom de l’école décile milieu socio- décile d’élèves
de faible
l’école (SFR) économique (IMSE) (30/09/2010)
revenu
882002 École secondaire de New Carlisle 15,73 7 18,89 9 56
882006 Polyvalente de Gaspé 12,78 5 24,45 10 100
882008 École secondaire de Grosse-Île 1,27 1 19,19 9 34
882009 École secondaire Evergreen 23,27 8 24,82 10 33
882013 École Polyvalente de Bonaventure 13,40 6 16,99 9 140
882016 École d'Escuminac 12,11 4 17,02 9 31
882112 École secondaire Queen Elizabeth 14,13 6 25,01 10 86
Source : MELS, DGPRPS, DRSI, compilation spéciale des données du recensement canadien de 2006 (production mars 2011).
Note : Les écoles sont classées sur une échelle allant de 1 à 10, le rang 1 étant considéré comme le moins défavorisé et le rang 10 comme le plus défavorisé.
Unemployment Low income
In 2006, English speakers in the Gaspesie-Iles-de-la- Compared to the Francophone population on the
Madeleine region experienced an unemployment Gaspe Coast, English speakers are more likely to be
rate of 28.2% as compared to 16.5% French speakers without income, are less likely to be in the high in-
of the same region, and more than three times higher come category, and are more likely to live below the
than that of English speakers across Quebec (Statistics low income cut-off. The low income cut-off “identifies
Canada, 2006 Census). those who are substantially worse off than the aver-
age” (Statistics Canada, 2006 Census).
Achieve 13Government Assistance Shore’s socio-economic and linguistic characteristics
English speakers in the Gaspesie-Iles-de-la-Madeleine follows. Note that while conditions are somewhat bet-
are 27% more likely to depend on government assist- ter, nonetheless, with the exceptions of Baie Comeau
ance than their French-speaking neighbors, in order and Fermont, the other three North Shore schools, lo-
to meet their basic needs. Compared to the provin- cated in Sept Iles and Port Cartier are also designated
cial average for English speakers, this number jumps on the milieu defavorise government map.
to 166% (Popcock, J., Baseline Data Report, 2003-04).
Bilingualism Outside of Administrative
While English speakers are more likely to be bilingual Region 11 – the North Shore or
than their French-speaking neighbours (43.5% com- Region 09 of ESSB
pared to 19.6% in 2001), Anglophones of Gaspesie-
Iles-de-la-Madeleine are substantially less bilingual This portrait has been provided by the North Shore
than English speakers in the entire province (Statistics Community Association (NSCA) and statistical evi-
Canada, 2006 Census). Lack of sufficient bilingualism dence is available in Annex I.
may be one of the factors impacting on low income,
high unemployment and dependency on government Income levels
assistance. “Being unable to speak French amplifies Economic differences between Anglophone and
the problem of isolation and makes it harder yet to Francophone families, like those of the Gaspesie-Iles-
find work” (Direction de santé publique Gaspesie-Iles- de-la-Madeleine, are evident as well (Chart 9). For
de-la-Madeleine, Poverty and food insecurity on the example, among individuals earning $10,000 or less
Gaspe Peninsula and Magdalen Island, 2007). annually, 29.9% are Anglophone compared to 24.2%
Francophone. Similarly, among individuals earn-
Low Education Levels ing $50,000 or more, only 14.6% are Anglophones
43.48% of English speakers on the Gaspe Coast do not compared to 20.9% Francophones. Almost 1 in 4
possess a certificate, diploma or degree, as compared Anglophones aged 15 years and over, have an annual
to 36.73% of their French-speaking neighbours, and income of less than $10,000.
19.8% of all English speakers in the province. Only
5.2% of English speakers on the Gaspe Coast obtained Unemployment
a university certificate or diploma or degree at the Whereas, for the Gaspésie-Iles-de-la-Madeleine ter-
Bachelor’s level or higher, as compared to 8.3% of ritory of ESSB, Anglophones are significantly unem-
their French speaking neighbours, and 24.8% of all ployed compared to Francophones, on the North
English speakers in the province. Shore, there is little statistical difference between the
two linguistic communities: jobless rates are 10.7%
“In comparison to the French speaking majority in Anglophones compared to 10.6% Francophones. This
Quebec, the proportion of English speakers with a uni- number exceeds the provincial Anglophone average
versity degree is comparable or higher in all regions of 8.8%.
with the exception of the Nord-du-Quebec, Cote-
Nord and Gaspésie-Iles-de-la-Madeleine” (Statistics Community Profile
Canada, 2006 census). Low education level is another From a population perspective, using the min-
contributing factor that critically impacts on low in- ority-majority index (mmi) there are 16% more
come, high unemployment and dependency on gov- Anglophones, as compared to Francophones, in the
ernment assistance. age group of 65 years and over, and within the CSSS de
Sept-Iles territory, it is 50%. The minority-majority in-
Note dex indicates that Anglophones are 60% more likely to
Most of the above statistics refer specifically to live in a single-parent household than Francophones
the administrative region 11 or Gaspesie-Iles-de- and are 71% more likely when compared to provincial
la-Madeleine, and do not include the North Shore Anglophones.
schools and communities (of Region 09) that are
also served by ESSB. A separate report on the North
14[ CHART 10 ]
ESSB Linguistic Profile: Guideline for Second Language Needs - 2010-2011
SCHOOL/CENTER Anglophones Francophones Bilingual Autochtone Totals
Baie Comeau 6 40 0 0 46
Belle Anse 23 0 2 0 25
Bonaventure Poly 114 0 3 35 152
Entry Island 9 0 0 0 9
Escuminac 46 2 6 6 60
Evergreen High 3 2 30 0 35
Fermont School 3 18 0 0 21
Flemming Element 51 91 0 9 151
Gaspe Elementary 43 27 30 0 100
Gaspe Polyvalent 74 2 25 3 104
Grosse Ile 70 0 5 0 75
Metis Beach 3 48 6 0 57
New Carlisle 114 2 8 0 124
New Richmond 40 15 0 30 85
Queen Elizabeth 36 42 0 7 85
Riverview Element 3 30 0 0 33
Shigawake-PDS 53 13 0 0 66
St. Patrick Elem 7 50 1 0 58
ESSB Youth Totals 698 382 116 90 1286
54% 30% 9% 7% 100%
North Shore Schools 99 221 0 16 336
% of total ESSB 29% 66% 0% 5% 100%
Metis Beach School 3 48 6 0
Totals for N. Shore 102 269 6 16 393
and Metis Beach 26% 68% 2% 4% 100%
Educational levels of attainment Linguistic profile
North Shore Anglophones fare better than their The North Shore differs from the Gaspe Coast-
counterparts of the Gaspesie-Iles-de-la-Madeleine. In Magdalen Islands as to the greater number of first
the NSCA’s territory, of the 1590 Anglophones aged language French speakers who attend ESSB schools,
25-64, 61.3% of them have a high school diploma or making statistical comparisons between the two re-
less compared to 53.5% of Francophones. However, spective linguistic communities more complex. North
only 8.2% have a university diploma compared to Shore schools serve only 29% Anglophones and 66%
24.6% of the provincial Anglophone population. Francophones whereas ESSB has an overall popu-
lation of 54% Anglophones and 30% Francophones
Succeed
(Chart 10).
15Health and Services Needs of the English-speaking Population of
Social Service Conditions the Lower North Shore, North Shore, and Gaspesie-
Magdalen Islands, 2007). What initiatives or strategies
Our schools are affected by the health conditions of can we undertake or implement to help promote
our families prior to student arrival in pre-kindergart- greater access to services in English? Our Community
en and kindergarten, and throughout their stay in ele- Learning Centers (CLCs) become an important con-
mentary and secondary levels. duit for reducing the gaps that exist between services
available in English across the ESSB territory and the
Limited Access to Health Services in English required needs of our English-speaking population.
In a CHSSN-CROP Survey on Community Vitality
(www.essb.qc.ca/ACPESCC.pdf), the following results Cultural Identify and Sense of Belonging
were obtained: Overall, 35% of those surveyed were Cultural identity and sense of belonging is, in part, re-
satisfied with health and social services offered in flected by the number of institutions that specifically
English. In specific situations, the following propor- serve the particular needs of that community. There
tion of individuals received services in English: are but a few of these specifically serving Anglophones
on the Gaspe Coast, the Magdalen Islands, and the
• 88.2% when calling Info-Sante North Shore. From an institutional standpoint there
• 84.9% when visiting a doctor are only three: Eastern Shores School Board, the
• 67.6% when visiting a CLSC English section of the CEGEP de la Gaspesie et des Iles,
• 48.7% when visiting a hospital emergency room or and SPEC, an English newspaper published weekly.
out-patient clinic
• 39.8% when staying overnight in the hospital There are six community organizations that have the
specific mandate to provide services to the English-
Obtaining both routine and specialized support servi- speaking population: Committee for Anglophone
ces in English is a significant challenge. While there are Social Action (CASA), Vision Gaspe-Perce Now,
more than 50 organizations on the Gaspe Coast which Family Ties New Carlisle, the Gaspesian CEDEC, the
offer support services (mental health, disease, addic- North Shore Community Association (NSCA), and
tion, spousal abuse) few offer information or services the Committee for Anglophone Magdalen Islanders
in English (CASA: The Extra-Regional Health and Social (CAMI).
Cultural-linguistic minority status for communities
located on the Gaspe Coast, the North Shore or the
Magdalen Islands is compounded further by geo-
graphic isolation and travel distances to those much
larger Anglophone institutional organizations and ser-
vices located in Montreal, New Brunswick, or Prince
Edward Island. Reliance on the facilities and services
of the Eastern Shores School Board is as much a neces-
sity as it is a virtue; communities pull together around
their key organizations in order to help themselves.
Consequently, while the closure of a school in any
region of the province is always very difficult, there
are usually other community institutions that can fill
the breach; within ESSB territory, such is not the case.
Any school closing is not just emotionally painful; it
also poses a significant threat to the affected com-
munity’s longevity.
16
BelieveCommunity Loyalty and Leadership This information tool provides ESSB with additional
We believe that ESSB, as an English School Board insight into the perceptions of its students and how
operating in the context of a largely, isolated, minor- it might affect learning conditions and strategies ne-
ity language community, must serve a cohesive role in cessary to improving success rates. For example:
protecting and promoting the identity and vitality of TTFM survey results over the past several years have
the communities represented by its schools and cen- indicated that student engagement in school sports
ters. It is important that ESSB be “seen” as acting in and clubs is a particular strength of our schools. This
the best interests of the English-speaking community, reinforces the importance of the CLC concept and
including the best interests of First Nations families the appeal of sports and cultural activities as rally-
whose children attend our schools. Given the diverse ing points for our youth and communities. However,
socio-economic and cultural needs of our vast terri- health issues of obesity, in particular, and consump-
tory of peoples, it is essential that ESSB be “seen” as tion of marijuana and alcohol are concerns that still
promoting values of harmony, cooperation, and re- need to be addressed. Our students’ higher-than-the-
spect for all of our cultural and linguistic diversities. norm sense-of-belonging results may also account for
We expect our students to develop the necessary relatively low reporting on violence in schools.
social skills to be successful in life, and become good
citizens capable of acting responsibly for both them- Violence in Schools
selves and on behalf of others. ESSB schools have implemented the provincial action
plan to prevent and treat violence in schools. With the
School Safety and Security introduction of Bill 56, the anti-bullying and anti-vio-
Given the complexity and challenges of our socio-eco- lence legislation that came into effect as of January
nomic and cultural-linguistic challenges, it is especially 1, 2013, ESSB has moved to ensure that Action Plans
important that the key institutions of education (our are put in place, and Codes of Conduct are updated
schools and centers) servicing the isolated minority to align and reflect the new legislation. In 2010, ESSB
Anglophone communities of the Gaspe Coast, North established a secure, on-line suspension file accessed
Shore, Magdalen Islands, and Metis Beach, function by school and center administrators to report violent
as safe and secure harbors, or, as homes-away-from incidents and bullying. Bill 56 now makes this an inte-
home, providing additional protective factors for an gral, essential accountability component.
enhanced sense of belonging for students and their
families. As of school year 2012-13, there remain important
areas for improvement. Half of the ESSB schools have
Tell Them from Me Survey Instrument support services in place for suspended students. One
In cooperation with LEARN, Eastern Shores School third of ESSB schools have taken into consideration
Board has been using the services of the Tell Them homophobic events that may occur in their class-
from Me (TTFM) survey instrument to gather effect- rooms, hallways, and school yard. Two thirds of ESSB
ive data on student perceptions of their schools. The schools have taken into account the types of verbal
elementary version typically measures 25 indica- violence that occur in virtual space on the Internet.
tors while the secondary version typically measures Adult Education centers are adjusting to the statistical
43 indicators which are based on the most recent reporting of violence in schools.
research on school and classroom effectiveness.
Questions are designed to elicit responses from stu-
dents on their perceptions of school safety and secur-
ity, school climate for learning, and personal state of
health (physical level of activity and nutrition).
Achieve
17Adult and Vocational
Education Centers
Eastern Shores School Board has six adult education
Special Needs Students centers located in Gaspe, New Richmond, Listuguj,
and Required Services New Carlisle, Sept Iles and Grosse Isle. Courses of-
fered include: academic instruction (including sec-
Eastern Shores School Board has sixteen of its eight- ondary, and pre-and post-secondary), alphabetiza-
een schools designated within the milieu defavorise tion (or literacy) and vocational training: accounting,
regions of Quebec, and there is a considerable body machining, nursing, trucking, computer support,
of research that closely associates low socio-eco- carpentry, home care, RNA, English second language
nomic conditions with at-risk student learners. While and French Second language. Wakeham and Sept Iles
these socio-economic conditions have previously offer distance education courses in accounting and
been mentioned, the relevancy of their impact on our home care, respectively.
clientele warrants repetition. We have an expansive
geography that yields little-to-no practical economies Diverse Needs
of scale. There are limited job opportunities. Many These centers have diverse needs based on diverse
of our families and their members are, for the most clientele and economic conditions of their respective
part, culturally and linguistically isolated as a minor- regions. Concerns expressed, therefore, vary. For ex-
ity; a significant number of them are not considered ample, in Sept Iles, the employment rate is high, but
by local employers to be sufficiently bilingual to enter the number of English-speaking teachers available
the workforce, and they are also often discouraged in a largely French-speaking region limits the center.
when trying to access health and social services in The high employment rate makes it difficult to attract
English. This combined set of important variables help clientele to either academic upgrading or vocational
explain the huge challenges to academic learning that programs. Economic conditions are almost the oppos-
are found within our educational territory. ESSB is ite in Gaspe, where adult education vocational gradu-
unique within the public network of Anglophone ates are getting jobs in the area. However, the tiny
and Francophone school boards. In response to English-speaking population does not always generate
these challenges, we are providing extensive servi- enough numbers to justify the offering of a wide var-
ces for all at-risk learners through the deployment of iety of programs. The question being asked is whether
more resource teachers, a heavier reliance on psycho- or not the school board can afford to offer programs
logical and speech services, and by tapping into social at a financial loss (i.e. not fully funded by MELS). New
services (if available). ESSB is also training classroom Richmond offers only academic upgrading. The clien-
teachers in diverse teaching practices that research tele is 90% Autochtones and mostly living on the local
reveals are most effective with all learners but espe- Reserve. Listuguj offers vocational programs to its ma-
cially those with special needs. jority Autochtones clientele. The students are most-
ly dropouts from the New Brunswick border town of
Campbelton. It operates out of LMDC; building space
in the area is difficult to come by and rental costs are
consequently very high. The Anchor, located in New
Carlisle, is the ESSB flagship for Adult Education. It was
designed to be a larger, regional facility, drawing voca-
tional interest from across the vast ESSB territory. The
challenge for ESSB Adult Education is not to consoli-
date centers, but to consolidate the individual needs
of students by expanding our course offerings through
innovative delivery systems. Currently, as examples,
Wakeham Center has given the “Accounting program”
and Northern Lights Center has given the “Homecare
program” with a variety of distance technology models.
18Shared concerns
The centers do have several issues in common.
Anglophone clientele are, in most cases, judged by
the market place to be insufficiently bilingual to ob-
tain employment in their respective regions (vast ma-
jority Francophone). Emploi Quebec works closely
with our Adult Education centers and has noted the
problem. Statistical evidence from Emploi Quebec
that rates the French second language proficiency rate
as it applies to the work force would be most helpful
as a guideline for ESSB Adult Ed center requirements.
The CLE may support more FSL programs if there are
statistics to back up the need. It would also be helpful
to measure our enrolment rate against the employ-
ment rate of each region. Transportation of Adult
Education students to all of our centers is an issue.
There is little-to-no public transportation system to
speak of, and students, mostly coming from econom-
ically disadvantaged homes often do not register with,
or continue to attend Adult Education due to the high
personal costs involved in making their own travel ar-
rangements. ESSB does permit travel on regular youth
sector school buses for Adult Education students, but
start and finish times along with calendar differences,
Succeed
and the specific needs/requirements of the CLE that exposure as realistic and viable alternatives to CEGEP
govern our vocational/professional centers make this and university academic pathways. SARCA, a division
an awkward, and not always consistent transporta- of Adult Education designed, in part, to target young
tion arrangement. adults who are looking for career guidance and who
are at risk of being unemployed, can play a large role
Silo mentality continues to dominate even within the in bridging high schools with their neighboring Adult
ESSB network of schools and centers. As noted above, Education centers. Additionally, the implementation
ESSB centers must be prepared to share their resour- of recurring annual or even semi-annual events be-
ces with one another by acknowledging that local tween respective youth and adult networks within
students can receive a regional level course through ESSB could widen current tunnel vision to a more ex-
another center using innovative delivery systems pansive horizon of job choices.
such as video-conference networking, Skype, and/
or Adobe Connect. We have the technology in place In the longer term and for the duration of this
and must exploit such capacity to the maximum. Partnership Agreement, in conformity with MELS Goal
Local high schools should be educating secondary #5, ESSB Adult Education Centers must concentrate
students as to the possible career options available on increasing the enrolment of new registrants (stu-
at their local Adult Education center. Visibility of Adult dents 19 years of age or younger) into the vocational
Education must not only be acknowledged from with- sector. Given that our numbers are small to start with,
in ESSB, but throughout our respective communities. the target should be modest, but achievable. We cur-
Vocational programs result in employment opportun- rently have 8 vocational programs on the provincial
ities that can be greater in both market opportunities vocational map. Presently we are seeking provisional
and remuneration than those eventually obtained authorization to offer additional programs so that we
through the traditional and socially more accepted can meet the challenges of today’s job market.
academic routes. A change of mindset is required
amongst the various stakeholders of education in or-
der for these vocational programs to achieve greater
19Orientations
1 ] To increase the success rate of students receiving qualification or
certification before the age of 20;
The ESSB Strategic Plan and
the Partnership Agreement 2 ] To improve language proficiency in both English and French;
reflect the most important 3 ] To improve levels of retention in school and academic success
among certain target groups, especially disabled students or stu-
orientations of the key dents with learning or adjustment difficulties;
stakeholders in education:
students and their families. 4 ] To improve health and safety conditions in the school environment;
It answers the following key 5 ] To increase the number of students under the age of 20 receiving a
question: what do these certification in formation professionnelle.
stakeholders most expect from 6 ] To enhance community loyalty by building a youthful leadership
Eastern Shore School Board? base, and by providing opportunities for our youth to engage in
community volunteering.
[ GOAL # 1 ]
To increase the success rate of students receiving qualification
or certification before the age of 20
OBJECTIVES STRATEGIES
To increase the success rate
Track success results to support schools in establishing individual school and
of students who receive
subject targets every year.
qualification or certification
Organize and provide PD on the Progression of Learning, developmental
To increase the success rate phases of math and differentiation strategies.
in elementary end of cycle III
math compulsory exam Implement cycle specific Professional Learning Communities (PLCs) and use
these to establish and support a board-wide curriculum map.
Conduct annual year-end transition meetings between Elementary and
Secondary math teachers to exchange information and establish priorities.
To increase the success rate
Monitor and support school specific measures (such as after-school tutoring
in secondary 4 math CST
sessions, use of SOS LEARN, and summer school programs) to increase
420 – uses math reasoning
success for secondary 4 math students.
competency
Organize and provide PD specific to secondary 4 CST math with a focus on the
Progression of Learning and Evaluation (assessment for learning) strategies.
To decrease the number of Schools are to avoid retention of students.
students leaving school without Monitor student leavers, and report on the follow-up measures taken (i.e.
qualification or certification meetings with Adult Ed or SARCA, and families).
To improve technological skills Determine clear and achievable outcomes for improving teacher ICT usage
and provide more equitable
access to technological tools for Install, support and facilitate the use of connective technologies (VCN, Adobe
our students, staff and families. Connect, Skype)
20[ GOAL # 2 ]
To Improve in FSL and ELA
OBJECTIVES STRATEGIES
Provide training to FSL teachers to acquire most effective reading
To increase the success rate instructional strategies in the French classroom.
in the secondary 5 FSL – 530
Production competency Establish an FSL Professional Learning Community online (SAKAI portal on
LEARN).
Provide training to FSL teachers to acquire most effective reading
To increase the success rate instructional strategies in the French classroom.
in the secondary 5 FSL – 520
Reading competency Establish an FSL Professional Learning Community online (SAKAI portal on
LEARN).
Provide training to FSL teachers to acquire most effective reading
To increase the success rate in instructional strategies in the French classroom.
the secondary 5 FSL – Global
Result Establish an FSL Professional Learning Community online (SAKAI portal on
LEARN).
To increase the success rate in Schools are to avoid retention of students.
elementary end of cycle III ELA Monitor student leavers, and report on the follow-up measures taken (i.e.
compulsory exam meetings with Adult Ed or SARCA, and families).
To increase the global success Install, support and facilitate the use of connective technologies (VCN, Adobe
rate in the secondary 3 ELA Connect, Skype)
common exam Increase teacher opportunity to participate in regional marking centers to re-
Establish a lead ELA teacher in enforce evaluation as a learning tool at key end-of-cycle years.
each school to mentor other
classroom teachers in balanced Provide PD induction to new teachers in ELA philosophy and practices, with
literacy approaches. follow-up visits to ensure PD continuity.
[ GOAL # 3 ]
Improved levels of retention in school and academic success among certain target
groups, especially handicapped students or students with learning or adjustment
difficulties
OBJECTIVES STRATEGIES
Establish an ESSB transition committee which will provide guidelines to
schools for transition meetings.
To increase the number and/
or percentage of students Establishment of board-wide guidelines for the identification and support of
who receive qualification or WOTP students.
certification, among those Provide teachers with training sessions that reinforce strategies for
students with an IEP. differentiated instruction and different styles of learning (including “digital
natives”).
21[ GOAL # 4 ]
Improvement in health and safety in school environment
OBJECTIVES STRATEGIES
Establish and implement Anti-Bullying Action Plans in all schools.
To reduce the number of violent Establish and implement emergency response teams, along with crisis
and bullying incidents leading procedures in conformity with board policy.
to suspensions Supply all schools with the training and purchase materials for
implementation of a Social Competency Program.
[ GOAL # 5 ]
To increase the number of students under the age of 20 receiving a certification in
Vocational Training
OBJECTIVES STRATEGIES
Establish close partnerships between adult education centers and youth
To increase the number of new sector schools
registrants under the age of 20 Improve sharing of transportation, lab and gym facilities
in vocational programs
Promote the SARCA initiative
[ GOAL # 6 ]
To enhance community loyalty by building a youthful leadership base, and by
providing opportunities for our youth to engage in community volunteering.
OBJECTIVES STRATEGIES
Establish a nutritional breakfast
To promote and provide material support for schools in their application and
and/or snack programs (Food
operation of breakfast programs (Petites Desjeuners of Quebec, Breakfast for
for Thought) in all schools and
Learning).
centers, where possible.
Provide necessary material and financial support for after-school and extra-
Increase the variety of physical curricular activities (adapted to regional interests) that attract and motivate
activity options and maximize students to get more involved in school life.
time allocation of physical
education where ever possible Ensure that Adult Education students have reasonable access to Youth gym
facilities.
Encourage and promote the Identify potential partners who have demonstrated certain needs within the
creation of community partners community - specifically the need for rental/meeting space. Where possible,
in all ESSB schools and centers, an exchange of services can be established. Partners are identified through
under the philosophical belief active participation on local and regional Partnership Tables.
that it “takes a village to raise a Prioritize the presence of ESSB personnel/representatives at all local and regional
child”…the CLC concept. Partnership Tables, with a particular emphasis on MSSS-MELS and CSSS.
Improve ties to the families of our special needs children whose challenges
Increase level of meaningful to academic and social success require our support and expertise (example:
partnerships with families, PAELE project or emergent literacy 0-4 years).
allowing for more concrete
interaction among students, Promote and increase the use of our video-conference network (of CLCs) to
staff, and parents enhance access by our families to health, social, educational (both youth and
adult sectors) to workshops and resources.
22Glossary
and Terms
Decile ranking National Indicators
A 10-place ranking of schools (based on socio- An indicator is a statistical measurement. National
economic factors) with1 representing most advan- indicators are provincial statistics which MELS pro-
taged and 10 representing most disadvantaged. vides to schools and school boards. These statistics
DRA & DWA are used in assessing success and challenges to ex-
Diagnostic Reading Assessment and Diagnostic isting teaching/learning strategies and practices in
Writing Assessment: tools to analyze student read- the classroom.
ing and writing with instructional goals for each PDC
child, documenting student progress over time. Professional Development Committee
Drop-out SARCA
A student who leaves school without qualifications. Services d’accueil et références et d’accompagne-
Educational Project ment. (Regional referral counselling and support
According to the Education Act, an Educational services)
Project shall set out the specific aims and object- School Success Plan
ives of the school for improving school success. The School Success Plan details the means or
EHDAA strategies used by the school to implement its
Élève qui a un Handicap ou qui est en Difficulté Educational Project.
d’Adaptation out d’Apprentissage. Students with SIMACS
physical, sensory, or intellectual deficiencies, or se- Systèmes informatisés pour la maintenance des ac-
vere developmental or behavioral problems. tifs des Commissions Scolaires
ESSB Socio-economic factors
Eastern Shores School Board Statistical information based on a combination of
IEP social (mother’s education, parents working) and
The Individual Education Plan is a document that economic (family income) factors.
clarifies special measures to be considered in a
student’s education. The details in an IEP are de-
pendent on the special behavioral circumstances or
academic learning profile of the student
MELS
Ministère de l’Éducation, du Loisir et du Sport
Mission Statement
A statement based on values and principles that
clarifies the purpose of an organization and intends
to inspire commitment to goals and targets.
NANS
New Approaches, New Solutions (Agir Autrement)
is a MELS intervention measure to assist schools
with a décile ranking of 8-10 based on socio-eco-
nomic data. Additional financial assistance is pro-
vided to foster success for students in disadvan-
taged areas.
23Believe
Achieve
Succeed
EASTERN SHORES
SCHOOL BOARD
40 Mountsorrel
New Carlisle, QC, G0C 1Z0
Tel: (418) 752-2247
Fax: (418) 752-6447
info@essb.qc.ca
Realisation: Howard Miller, Melanie Hayes • Design: MédialogAnnex 1 NORTH SHORE COMMUNITY ASSOCIATION Socio-Economic Profile Summary of Quebec’s English-Speaking Communities North Shore Region 09 June 2011
INTRODUCTION
    This report is based on the information obtained in the online CHSSN Socio-Economic Profiles of
    Quebec’s English-speaking Communities and the Companion Report to the online table series1 as well as
    their Baseline Data Report 2009-2010. It is hoped to gain an insight to the influence the socio-economic
    status of communities and individuals has on the level of health and incidence of disease they experi-
    ence with respect to three related social determinants of health – namely, income, employment and
    education. The tables contain statistical information on FOLS English-speaking populations organized
    by administrative categories: Quebec province, region or RSS (Région socio-sanitaire), CSSS (Centre de
    santé et des services sociaux) territory and the NSCA’s (North Shore Community Association) territory.
    (RSS region 09 contains 7 CSSSs but only 6 CSSSs reside in the NSCA’s territory, the 7th, CSSS de la Basse-
    Cote-Nord resides in the territory of another community organization.)

    RELATIVE INDICES
    Aside from absolute numbers and population percentages the table series provides comparative infor-
    mation for the English-speaking population at each administrative and geographical level.

    MINORITY-MAJORITY INDEX (MMI)
    A minority-majority index helps demonstrate the similarities and differences between various groups
    of unequal number – In this case, by comparing, the minority population Anglophones and the major-
    ity population Francophones. An mmi greater than 1.00 indicates that the characteristic is more com-
    monly found in the minority population. An mmi less than 1.00 indicates that it is less present in the
    minority population. An mmi always represents a comparison between two groups of different sizes.

    LOW INCOME CUT-OFFS (LICO)
    Although there is no official measure of poverty in Canada, the Statistics Canada measure of low in-
    come cut-offs (LICO) is probably the best known. Commonly known as the “poverty line”, LICO uses
    the income levels of a given family and considers how large a share of its income is spent on necessities
    such as food, shelter and clothing. If the amount a family spends is 20% higher than an average family
    in a year, it falls into the low income cut-off category.

    RELATIVE INDICES (ANGLOPHONES)

    1   CHSSN’s Socio-Economic Profiles of Quebec’s English Speaking Communities – Companion Report to the CHSSN online table series – by CSSS and
        RSS Territories (2006 Census Data) http://www.chssn.org/En/pdf/Socio-econ_profiles_Companion_Report_FINAL_version_Oct18.pdf.
        Baseline Data Report 2009-2010 - http://www.chssn.org/En/BDR/2009-2010/BDR_Region-09b_NSCA.pdf.

2
You can also read