POST-SPILL ECOLOGICAL HEALTH ASSESSMENT AT THE SOUTHERN COAST OF MACTAN ISLAND, PHILIPPINES USING MULTIMETRIC PHYTOPLANKTON INDEX FOR BIOTIC ...
←
→
Page content transcription
If your browser does not render page correctly, please read the page content below
Edullantes et al.: Application of multimetric phytoplankton index to assess ecological health after an oil spill event
                                                             - 1353 -

  POST-SPILL ECOLOGICAL HEALTH ASSESSMENT AT THE
 SOUTHERN COAST OF MACTAN ISLAND, PHILIPPINES USING
   MULTIMETRIC PHYTOPLANKTON INDEX FOR BIOTIC
                    INTEGRITY
 EDULLANTES, B.* – SAÑOZA, W. – VARGAS, C. – SANGUTAN, S. – POCONG, M. – SILAPAN, J.

    Department of Biology and Environmental Science, College of Science, University of the
                Philippines Cebu, Lahug, Cebu City, Cebu 6000, Philippines
                                                 *
                                          Corresponding author
                         e-mail: bedullantes@up.edu.ph; phone: +63-32-233-398
                                         (Received 9th Nov 2020; accepted 8th Feb 2021)

Abstract. Evaluation of ecological health status after an oil spill is crucial for effective restoration measures
of the affected aquatic ecosystems. In this study, we applied a multimetric phytoplankton index for biotic
integrity (MPI-BI) to assess the ecological health status of the southern coast of Mactan Island, Philippines
after 8, 12, 24, and 30 months from the MV Thomas Aquinas spill incident in August 2013. Phytoplankton
community analysis revealed (1) no difference in abundance, richness, and diversity between affected and
reference sites, (2) increasing trend of diversity over time after the spill, and (3) higher remotely-sensed
chlorophyll a level in affected sites. Phytoplankton relative abundance, diversity, and trophic state were
used to derive MPI-BI. Based on MPI-BI, the health status of the affected sites was generally in good
condition 8 – 30 months after. A time-series analysis of remotely-sensed and meteorological parameters
showed no difference between pre and post spill conditions, except for chlorophyll a and particulate organic
carbon. Generally, the health status of the coastal water may be affected by the oil spillage as indicated by
the increased trophic state after the spill but may be recovering from the oil spill stress.
Keywords: phytoplankton community, bioindicator, oil spill impact, multivariate analysis, remote sensing
application

Introduction
   Discharge of oils into marine ecosystems due to accidental spillage has been a major
environmental issue for several decades and a major contributor to the instability of the
marine ecosystem worldwide (Farrington, 2013). Oil spill events disturb the complex
ecological interactions that subsequently decrease the integrity of water quality to
support aquatic life (Farrington, 2014). Similar to any other anthropogenic
perturbations, these incidents also degrade the sustainable human use of the coastal
ecosystems resulting in the economic loss (García Pérez, 2003; Surís-Regueiro et al.,
2007). It is, therefore, crucial to assess the ecological health status of aquatic ecosystems
after an oil spill to provide information for effective restoration measures (IMO/UNEP,
2009). Biological indicators have been used as the main tool for ecological health
assessment after the spill (e.g. Gesteira and Dauvin, 2000; Bolognesi et al., 2006). These
are quantifiable biological features that are sensitive to environmental perturbation.
Most assessments are often concentrated on oil spill impacts in the coastal, mangrove,
and sublittoral areas where the effect is very much noticeable as compared to the pelagic
and planktonic organisms (Parsons et al., 2015).
   Phytoplankton is a diverse group of microscopic, single-celled organisms that are
ubiquitous in aquatic environments (Reynolds, 2006). Their ecological role of providing
energy to the next trophic level (Falkowski, 2012) may be disrupted when a high level

                       APPLIED ECOLOGY AND ENVIRONMENTAL RESEARCH 19(2):1353-1370.
                          http://www.aloki.hu ● ISSN 1589 1623 (Print) ● ISSN 1785 0037 (Online)
                                    DOI: http://dx.doi.org/10.15666/aeer/1902_13531370
                                          © 2021, ALÖKI Kft., Budapest, Hungary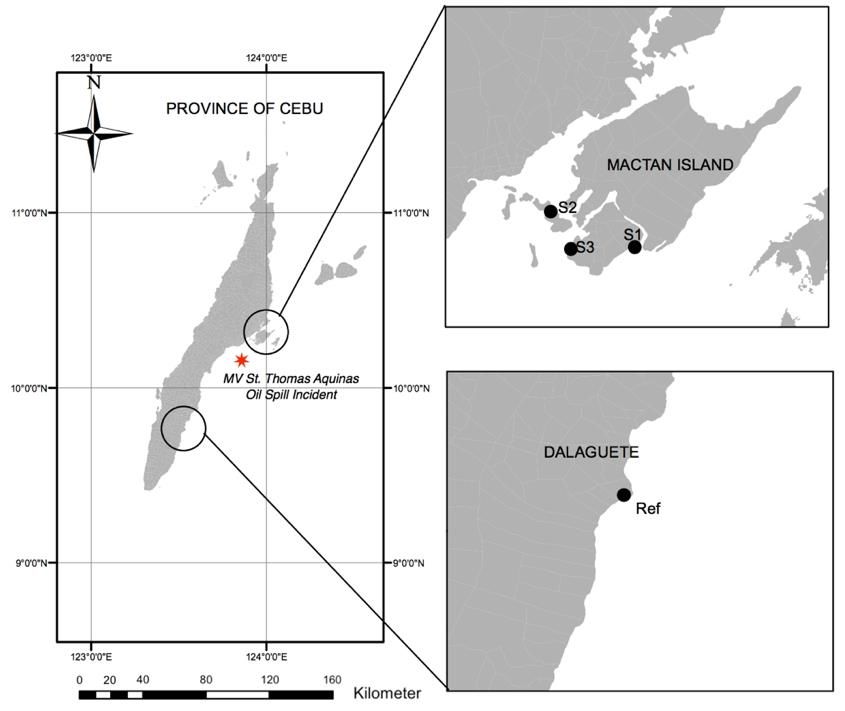
Edullantes et al.: Application of multimetric phytoplankton index to assess ecological health after an oil spill event
                                                            - 1354 -

of spilled oil floats at the upper layer of the water column (Gin et al., 2001). The
presence of oil can cause a fairly rapid and marked reduction in the abundance of certain
species, and possibly a proliferation of other species (Hallare et al., 2011; Ozhan et al.,
2014). The sensitivity of phytoplankton to anthropogenic pressures makes them a
reliable biological indicator of the ecological health status of an aquatic environment
(Verlecar et al., 2006). Phytoplankton diversity indices and the other single biotic index
methods have been used to assess aquatic ecological health status (El-Sheekh et al.,
2000; Suderman and Thistle, 2004; Hallare et al., 2011). Although these methods are
easier and faster to perform, they are incomprehensive and incomplete because they
reflect limited information of environmental changes (Teng et al., 2014). The ecological
health status entails pressure-independent assessment and can be attained by using
pressure-specific multimetric indices (Barbour et al., 2000). The multimetric approach
typically involves two phases: (1) development phase where metrics are selected,
calibrated and aggregate into an index, and (2) evaluation phase where the index is used
to assesses ecological condition at sites and evaluate impairment (Barbour et al., 2000).
This approach can be used to determine the ecological health status of coastal waters
that are exposed to anthropogenic perturbations like oil spills.
   Chlorophyll a is a vital component of phytoplankton primary production and is often
used as a measure to indirectly estimate the biomass. Measurement of the chlorophyll
a concentration (Chl a) is also important monitoring the phytoplankton distribution in
seawater surface to understand wide-scoped biological processes. Large-scale
observations of Chl a can be conducted in near real-time by satellite remote sensing
compared to laboratory analysis and traditional ship surveys that are limited to small
spatiotemporal coverage and are time-consuming (Behrenfeld and Falkowski, 1997).
Satellite remote sensing has been used in a recent study to evaluate whether the Chl a
was affected by the Deepwater Horizon oil spill in the northern Gulf of Mexico over a
multi-year time period (Li et al., 2019).
   The collision between MV St. Thomas Aquinas and MV Sulpicio Express Siete in
August 2013 discharged 20,000 liters of diesel, 120,000 liters of bunker or crude oil,
and 20,000 liters of lube oil into the coastal waters in Talisay, Cebu, Philippines. The
leaked oil was carried by the southwest monsoon winds to the coastal areas in the
southern part of Mactan Island. This contaminated the fishing grounds, aquaculture
ponds, and beaches of the affected areas. Previous studies have documented the impact
of this oil spill on mangrove communities (Sadaba and Niego, 2016), bacterial
composition (Bensig et al., 2014), and zooplankton abundance (Flores et al., 2020). No
studies have been published yet that assess the phytoplankton communities after the oil
spill incident.
   This study aimed to assess the ecological health status of the southern coastal waters
of Mactan Island after the MV Thomas Aquinas oil spill incidence using a multimetric
phytoplankton index. Working under the overall hypothesis that the ecological health
status declines after the oil spill, we focused on answering three research questions: (1)
How does the phytoplankton community structure in affected sites differ in a reference
condition after the spill incident? (2) What is the post-spill health status in the affected
sites based on the multimetric phytoplankton index for biotic integrity? (3) Does the oil
spill cause the post-spill pattern of phytoplankton in the affected sites? In this paper, we
described patterns of variation in phytoplankton community structure in the oil spill
affected areas using multivariate analysis. The correlative trends were used to identify
significant variables for the development of the multimetric phytoplankton index to

                      APPLIED ECOLOGY AND ENVIRONMENTAL RESEARCH 19(2):1353-1370.
                         http://www.aloki.hu ● ISSN 1589 1623 (Print) ● ISSN 1785 0037 (Online)
                                   DOI: http://dx.doi.org/10.15666/aeer/1902_13531370
                                         © 2021, ALÖKI Kft., Budapest, Hungary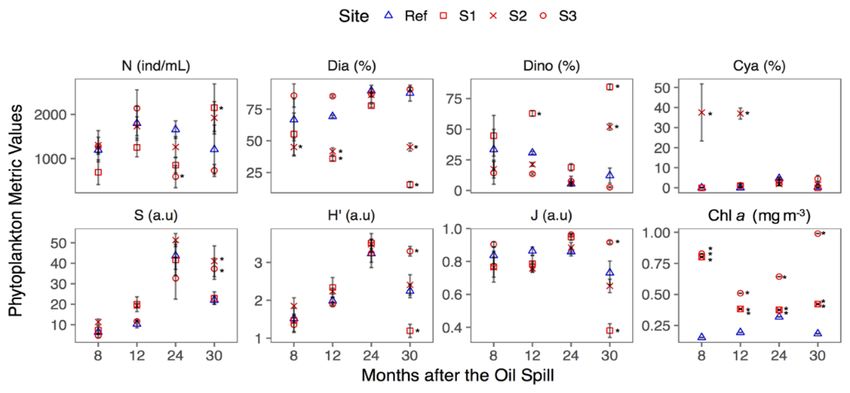
Edullantes et al.: Application of multimetric phytoplankton index to assess ecological health after an oil spill event
                                                            - 1355 -

assess the affected sites’ ecological health status after the spill. Finally, we analyzed
available meteorological data and remotely sensed data to examine whether the pattern
in the phytoplankton-based health status is caused by the oil spill or by natural
variability caused by meteorological conditions.

Methodology
Study sites
   Three sites off the coast of southern Mactan Island, Philippines were selected in terms
of the extent of MV Thomas Aquinas oil spill impact (Fig. 1). These were the coastal
areas in Alegria (S1; 10°14'56.43"N, 123°58'4.79"E), Calawisan (S2; 10°16'20.23"N,
123°55'2.90"E) and Day-as (S3; 10°15'17.23"N, 123°55'28.90"E), which were identified
to have low, mid and high oil spill impact status, respectively (Bensig et al., 2014; Flores
et al., 2020). The offshore water in Dalaguete was chosen as a reference site (Ref;
9°45'57.34"N, 123°33'2.60"E). Ref was not affected by the oil spill, and it has similar
features with the affected sites in Mactan, i.e. presence of fringing mangroves and
seagrass meadows. Ref is about 97 km away from the oil spill affected areas.

 Figure 1. The sampling sites in Barangays Alegria (S1), Calawisan (S2), and Day-as (S3) in
         Mactan Island, and the reference site (Ref) in Dalaguete, Cebu, Philippines

                      APPLIED ECOLOGY AND ENVIRONMENTAL RESEARCH 19(2):1353-1370.
                         http://www.aloki.hu ● ISSN 1589 1623 (Print) ● ISSN 1785 0037 (Online)
                                   DOI: http://dx.doi.org/10.15666/aeer/1902_13531370
                                         © 2021, ALÖKI Kft., Budapest, Hungary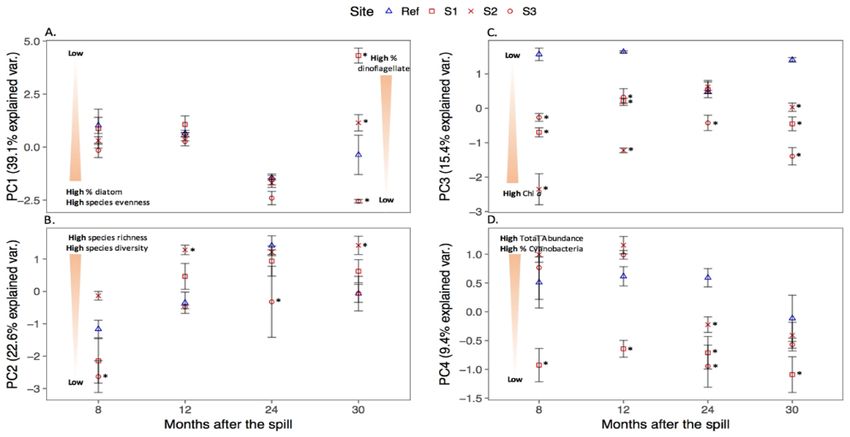
Edullantes et al.: Application of multimetric phytoplankton index to assess ecological health after an oil spill event
                                                              - 1356 -

Sampling
   In each site, three random points were established for water sampling. The samplings
were conducted in May and August 2014, August 2015, and March 2016 (8, 12, 24, and
30 months after the oil spill, respectively). The water samples were collected at 0.5 m
below the surface. The samples were placed into 1 L sample bottles and were preserved
immediately with 5 mL of Lugol’s solution, and were brought to the laboratory for
analysis.

Phytoplankton community structure analysis
    Water samples were set aside for at least 24 h to allow phytoplankton to settle at the
bottom. Subsequently, 0.9 L sample was carefully siphoned from the surface. The
remaining 0.l L concentrated algal sample was homogenized before 1 mL aliquot of the
sample was subjected for enumeration of the phytoplankton under a compound light
microscope. The drop-count method was used to examine the aliquot one to two drops at
a time following the protocol of Verlecar and Desai (2004). The species were identified
and verified using the AlgalBase (Guiry and Guiry, 2016). Abundance, relative
abundance, diversity indices at the species level (Eq.1 to Eq.7) were included in the
quantitative description of the phytoplankton community structure of the study sites
(Table 1).

     Table 1. Description of the different metrics of the phytoplankton community structure
                      Metrics                                                     Equations/Unit
Total Abundance (ind L-1)                                          N = total # of individuals                                (Eq.1)
Relative abundance of diatoms (%)                                  Dia = # of diatoms *100 / N                               (Eq.2)
Relative abundance of dinoflagellates (%)                          Dino= # of dinoflagellates *100 / N                       (Eq.3)
Relative abundance of cyanobacteria (%)                            Cya = # of cyanobacteria *100 / N                         (Eq.4)
Species Richness b                                                 S = # of species                                          (Eq.5)
Shannon’s diversity index b                                        H’ = -Σ(ni/N) ln(ni/N) a                                  (Eq.6)
Pielou's evenness b                                                J = H’/ log(S)                                            (Eq.7)
Phytoplankton biomass c                                            Chl a, mg m-3
 a
   ni is the number of individuals of the ith group in the sample
 b
   calculated using the vegan package in R (Oksanen et al., 2019)
 c
   chlorophyll a as proxy, which is extracted from Aqua-MODIS monthly Level- 3 estimates as described
 below

   Principal Component Analysis (PCA) was used to explore the pattern of variation of
phytoplankton community structure using the matrix that contains 48 observations
(3 sampling points x 4 sites x 4 sampling dates) and 8 phytoplankton variables (as listed
in Table 1). The data were log-transformed to normalize the data distribution.
Kolmogorov-Smirnov test was used to determine the normality of the data. The data were
centered since the variables were measured in the different scale and were standardized
because PCA is sensitive to the relative scaling of the original variable. The relationship
between the eight phytoplankton variables was determined using the Pearson correlation
coefficients. The resulting correlation matrix was used to extract the principal axes, and
only those axes that explained significantly the total variance were selected for

                        APPLIED ECOLOGY AND ENVIRONMENTAL RESEARCH 19(2):1353-1370.
                           http://www.aloki.hu ● ISSN 1589 1623 (Print) ● ISSN 1785 0037 (Online)
                                     DOI: http://dx.doi.org/10.15666/aeer/1902_13531370
                                           © 2021, ALÖKI Kft., Budapest, Hungary
Edullantes et al.: Application of multimetric phytoplankton index to assess ecological health after an oil spill event
- 1357 -
interpretation. ANOVA and pairwise comparison using t-test were used to test differences
between the reference and affected sites.
Derivation of Multimetric Phytoplankton Index for Biotic Integrity (MPI-BI)
The results of the PCA was used to select variables that best illustrated the variation
captured by each axis. Variables whose loadings were higher than 0.45 were selected for
the development of the Multimetric Phytoplankton Index for Biotic Integrity (MPI-BI).
Each of the selected variables was used to compute for the Ecological Quality Ratio
(EQR) using Eq.8. For phytoplankton biomass data, EQR was calculated using Eq.9. The
range of the EQR scores was set from 0 to 1. The MPI-BI score was computed by
averaging all the EQR scores at each sampling point (Eq.10). A higher MPI-BI score
indicates better health of the affected the site. MPI-BI were then compared among oil
spill affected sites.
EQRi = xi in affected site / xi in reference site (Eq.8)
EQRj = xj in reference site / xj in affected site (Eq.9)
MPI-BI = EQRi / no. of metrics (Eq.10)
where x is the observed value of the variable in an affected site i and reference j.
Assessment of meteorological and satellite-based data
Aqua-MODIS monthly Level- 3 estimates of chlorophyll a (Chl a, mg m-3), particulate
organic carbon (POC, mg m-3), sea surface temperature (SST, deg C), and
photosynthetically active radiation (PAR, einstein m-2 d-1) were obtained from NASA
Distributed Active Archive Center (http://oceancolor.gsfc.nasa.gov/). The spatial
resolution of these data was 4 km2, and temporal resolution was monthly from 2012-2015.
Monthly estimates of Chl a, POC, SST, and PAR in all the study sites were extracted using
SeaDAS software version 7.3.2 (Baith et al., 2006; https://seadas.gsfc.nasa.gov/). All
remotely sensed data in the affected sites were pooled and reported as mean mean SE.
Air temperature (AT, deg C), relative humidity (RH, %), precipitation (P, mm), and mean
sea level pressure (MSLP, hpa) were obtained from Philippine Atmospheric Geophysical
and Astronomical Services Administration (PAGASA) – Department of Science and
Technology (DOST). These meteorological data were measured in the Mactan station.
The temporal resolution of this data was daily from 2012-2015. Monthly average values
of these meteorological parameters were computed and reported as mean ± SEM. PCA
was also applied to examine the variability of the monthly estimates of remotely sensed
and meteorological parameters using the matrix that contains 48 observations
(12 months x 4 years) and 8 parameters.
Data processing and analysis
Descriptive statistics were determined to summarize the collected data. All averaged
values were reported as mean ± SEM. PCA, ANOVA, Pearson correlation, and Welch t-
test were carried out using the stat R package (R Core Team, 2019).
APPLIED ECOLOGY AND ENVIRONMENTAL RESEARCH 19(2):1353-1370.
http://www.aloki.hu ● ISSN 1589 1623 (Print) ● ISSN 1785 0037 (Online)
DOI: http://dx.doi.org/10.15666/aeer/1902_13531370
© 2021, ALÖKI Kft., Budapest, HungaryEdullantes et al.: Application of multimetric phytoplankton index to assess ecological health after an oil spill event
- 1358 -
Data wrangling and visualization were implemented in R version 3.3.2 (R Core Team,
2019) software using the following packages: tidyverse (Wickham et al., 2019), maps
(Becker et al., 2018), raster (Hijmans, 2020), and ggthemes (Arnold, 2019).
Results
Pattern of variation in phytoplankton community structure
The affected sites revealed the dominance of three major taxonomic groups – diatoms
dominated with pooled mean relative abundance of 62.0 ± 8.4%, 54.3 ± 7.8%,
83.6 ± 2.5%, and 50.4 ± 11.0% after 8, 12, 24 and 30 months from the oil spill incident,
respectively; followed by dinoflagellates (25.5 ± 7.6%, 32.6 ± 7.7%, 10.8 ± 2.5%, and
46.38 ± 12.0%, respectively); and then by cyanobacteria (12.5 ± 7.5%, 13.1 ± 6.0%, 2.6 ±
0.8%, and 2.0 ± 0.8%, respectively).
For all samples in affected sites, diatoms were comprised of five classes, i.e.
Bacillariophyceae (17 orders, 28 families, 64 genera, and 124 species),
Coscinodiscophyceae (7 orders, 9 families, 11 genera, and 13 species), Mediophyceae
(6 orders and families, and 8 genera and species), Biddulphiophycidae (2 genera, and
4 species), and Fragilariophyceae (1 species); dinoflagellates were represented by two
classes (Dinophyceae (7 orders, 16 families, 23 genera, and 33 species) and
Noctilucophyceae (1 species); and cyanobacteria were composed by class Cyanophyceae
(5 orders and families, 6 genera and 7 species). Several diatoms (9 orders, 13 families,
36 genera, and 74 species), dinoflagellates (2 orders, 5 families, 10 genera, and
15 species), and cyanobacteria (3 orders and families, 4 genera, and 5 species) are present
in affected sites and not found in the reference site. However, 6 diatom species and none
of the dinoflagellate and cyanobacteria in the reference site were absent in the affected
sites.
ANOVA showed a significant difference in the relative abundance of diatoms (Dia),
dinoflagellates (Dino), and cyanobacteria (Cya), Pielou’s evenness (J), and
phytoplankton biomass (Chl a) among sites (Table 2). Pairwise comparisons using t-tests
confirmed the significant difference in these parameters between the reference and
affected sites after a certain period from the oil spill incident (Fig. 2). Among these site-
specific parameters, Chl a in all affected sites were significantly higher than the values in
the reference condition, suggesting that this parameter is pressure-specific. A significant
temporal variation was observed in Cya, S (species richness), and H (Shannon’s diversity
index) that showed to increase after 8 – 24 months from the spill (Table 2). A two-way
ANOVA revealed evidence of a significant interaction effect between spatial and
temporal scales at which the N (total abundance), Dino, Cya, and Chl a were sampled
(Table 2).
We applied PCA to obtain further information on the pattern of variation in
phytoplankton community structure. Fig. 3 shows the progressive decline of principal
components’ (PC) eigenvalues and the proportion of explained variances. The last four
PCs represented a small proportion of the total variance (< 6.5%) and were not included
in the interpretation. Four significant PC axes were obtained and revealed that PC1 – PC4
explained 39.1%, 22.6%, 15.4%, and 9.4% of the total variance, respectively. These PCs
accounted for 86.5% of the total variance explained, while 13.5% of the variance
remained unexplained. Fig. 4 illustrates the projections of the phytoplankton variables of
the reference and affected sites 8, 12, 24, and 30 months after the spill.
APPLIED ECOLOGY AND ENVIRONMENTAL RESEARCH 19(2):1353-1370.
http://www.aloki.hu ● ISSN 1589 1623 (Print) ● ISSN 1785 0037 (Online)
DOI: http://dx.doi.org/10.15666/aeer/1902_13531370
© 2021, ALÖKI Kft., Budapest, HungaryEdullantes et al.: Application of multimetric phytoplankton index to assess ecological health after an oil spill event
- 1359 -
Table 2. Summary statistics of the analysis of variance (ANOVA) conducted to examine the
spatial and temporal variation in total abundance of phytoplankton (N), relative abundance
of diatoms (Dia), dinoflagellates (Dino), and cyanobacteria (Cya), species richness (S),
Shannon’s diversity index (H), Pielou’s evenness (J), and phytoplankton biomass (Chl a)
ANOVA Models Terms df Sum Sq. Mean Sq. F value p-value
Site 3 1132406.25 377468.75 1.00 0.40
Date 1 3533.75 3533.75 0.01 0.92
N ~ Site x Date
Site:Date 3 4545894.63 1515298.21 4.02 0.01 *
Residuals 40 15083963.29 377099.08
Site 3 13452.61 4484.20 12.47Edullantes et al.: Application of multimetric phytoplankton index to assess ecological health after an oil spill event
- 1360 -
Figure 3. Scree plot of the percent of variance explained by each principal component
A. 4
B. 4
standardized PC2 (22.6% explained var.)
standardized PC2 (22.6% explained var.)
2 2
S Cya
S Cya
● ● ● ●
●● ● ● ●● ● ●
H ●
H ●
●● ●●
N● ● ●● ●●
N● ●
●● ● ●● ●
● ● ● ● ● ●
●
●
●
●
Dino ●
●
●
●
Dino
● ● ● ● ● ●
0 ●
●● ●
● 0 ●
●● ●
●
●J ●J
● ●
Dia ● ● ● ● Dia ● ● ● ●
● ●
Sites Months
la
la
● ●● ● ●●
Ch
Ch
● ●
● ●
● Ref ● 8
● ● ● ●
−2 −2
● S1 ● 12
● ● ● ●
● S2 ● 24
● S3 ● 30
−4 −4
−5.0 −2.5 0.0 2.5 5.0 −5.0 −2.5 0.0 2.5 5.0
standardized PC1 (39.1% explained var.) standardized PC1 (39.1% explained var.)
C. 4
D. 4
standardized PC4 (9.4% explained var.)
standardized PC4 (9.4% explained var.)
2 ●
2 ●
● ●● ● ●●
● ● ● ● ● ●
● ● ●● ● ● ●●
N
N
Cy● ● ● ●● Cy● ● ● ●●
a a ● a a●
Di Di
● ●
● ● ● ●
J J
● ●
0 ● 0 ●
Chla● ● ●
●
●
● ● Chla● ● ●
●
●
● ●
●● ● ●● ●
HDino
HDino
● ●
● ● ● ●
S
S
● ● ● ● ● ●
●● ● ●● ●
Sites ● ● Months ● ●
● ●
● ●
● Ref ●
● 8 ●
● ● ● ●
−2 −2
● S1 ● 12
● S2 ● 24
● S3 ● 30
−4 −4
−5.0 −2.5 0.0 2.5 5.0 −5.0 −2.5 0.0 2.5 5.0
standardized PC3 (15.4% explained var.) standardized PC3 (15.4% explained var.)
Figure 4. Projection of the eight phytoplankton variables on the (A – B) PC1 and PC2 axes,
and (C - D) PC3 and PC4 axes. Ellipses (95% confidence) represent the projections of the
variables sampled in reference and affected sites after 8 – 30 months from the oil spill
Fig. 5 shows the temporal changes in PC eigenvalues between reference and affected
sites. PC1 relates to the relative abundance of phytoplankton as it best explained the
variability of Dia, Dino, and J with Pearson correlation coefficients (r) of 0.48, -0.45, and
0.49, respectively. This suggests that Dia and J decrease with increasing PC1 eigenvalues,
while Dino increase with decreasing PC1 eigenvalues. PC2, on the other hand, relates to
the phytoplankton diversity as the variability of S and H’ were best explained by this axis.
Both variables had a positive correlation with PC2 eigenvalues with r values of 0.64 and
0.45, respectively. PC3 was negatively related to Chl a (r = -0.71) and is related to the
trophic state. PC4 was positively related to N (r = 0.66) and Cya (r = 0.46).
APPLIED ECOLOGY AND ENVIRONMENTAL RESEARCH 19(2):1353-1370.
http://www.aloki.hu ● ISSN 1589 1623 (Print) ● ISSN 1785 0037 (Online)
DOI: http://dx.doi.org/10.15666/aeer/1902_13531370
© 2021, ALÖKI Kft., Budapest, HungaryEdullantes et al.: Application of multimetric phytoplankton index to assess ecological health after an oil spill event
- 1361 -
Figure 5. Variation of the PC1 – PC4 eigenvalues (mean ± SE; A – D, respectively) in the
reference and affected sites after 8 - 30 months from the oil spill incident. An asterisk (*)
indicates a significant difference (pEdullantes et al.: Application of multimetric phytoplankton index to assess ecological health after an oil spill event
- 1362 -
PCA was successfully demonstrated in this study as a useful and effective tool to
decrease the number of phytoplankton parameters to explain the variation observed
between the reference and affected sites after 8 – 30 months from the spill. The reduction
of the number of variables did not impair the quality of the information in this study as
the PCA agrees with the previous analysis. The PCA results revealed that the variation in
the observations can be best explained by the phytoplankton relative abundance (Dia,
Dino, and J), phytoplankton diversity (S and H), and trophic state (Chl a). All these
parameters were site-specific, but only the trophic state showed pressure-specificity.
Assessment of health status using MPI-IB
Based on the PCA results, the variables that explained the variation captured by each
axis were selected. Out of eight components, PC1, PC2, and PC3 were selected as they
provide a meaningful explanation of the variability of phytoplankton relative abundance,
diversity, and trophic state, respectively. The variables that significantly correlated with
each of the selected PC were extracted. Only six out of eight variables met this
requirement and were retained for the development of MPI-BI. Each metric represents a
unique biological feature and plays a distinct role in the MPI-IB. For instance, diatom
dominated in oil spill affected sites, and hence, the relative abundance of diatom deserves
attention when assessing the ecological health status of coastal water after the oil spill.
These metrics represent ecological quality changes and can explain the degree of stress
after the oil spill. In each of these variables, the Ecological Quality Ratio (EQR) was
computed to determine the degree of departure of the metric value in the affected site
from the value in the reference site. These scores were averaged to determine MPI-BI
scores. The MPI-BI range was equally divided into 5 ecological health status: (1) High
(0.81 – 1.0), (2) Good (0.61 – 0.80), (3) Moderate (0.41 – 0.60), (4) Poor (0.21 – 0.40),
and, (5) Bad (0 – 0.20). The high condition indicates that the environment is characterised
by low trophic state due to low chlorophyll a levels, and high species richness and
evenness that results in high diversity. At the other extreme, bad condition indicates
environment with high trophic state due to high chlorophyll a levels, and low biodiversity
due to low richness and uneven distribution of phytoplankton. MPI-BI scores of the
affected sites were generally above 0.6, suggesting that the health status of the affected
sites were in good to high condition after 8 – 30 months from the oil spill incident (Fig. 6).
Variation in MPI-BI was evident spatially but not temporally (Table 3).
1.0
High
0.8
MPI−BI scores
Good Site
0.6
S1
Moderate
S2
0.4
S3
Poor
0.2
Bad
0.0
8 12 24 30
Months after the Oil Spill
Figure 6. Multimetric phytoplankton index for biotic integrity (mean SE) in affected sites after
8 - 30 months from the oil spill incident
APPLIED ECOLOGY AND ENVIRONMENTAL RESEARCH 19(2):1353-1370.
http://www.aloki.hu ● ISSN 1589 1623 (Print) ● ISSN 1785 0037 (Online)
DOI: http://dx.doi.org/10.15666/aeer/1902_13531370
© 2021, ALÖKI Kft., Budapest, HungaryEdullantes et al.: Application of multimetric phytoplankton index to assess ecological health after an oil spill event
- 1363 -
Time series analysis of environmental parameters before and after the spill
Earlier analysis revealed that Chl a is pressure specific. Hence, we used Chl a to
indicate trophic status changes in the southern coast of Mactan before and after the spill.
We also correlated Chl a to other environmental parameters to determine whether the
changes in the trophic status can be attributed to the oil spill or to natural conditions in
the environment. However, this study does not give a claim on the direct nor the isolated
effect of oil spill on the Chl a changes. Instead, this study attempted to estimate, based on
the evidence gathered, the trend of Chl a before and after the oil spill considering the role
of other environmental and meteorological factors such as the particulate organic carbon
(POC), photosynthetically active radiation (PAR), sea surface temperature (SST), air
temperature (AT), relative humidity (RH), precipitation (P), and mean sea level pressure
(MSLP). These factors may play different roles in the variation of Chl a.
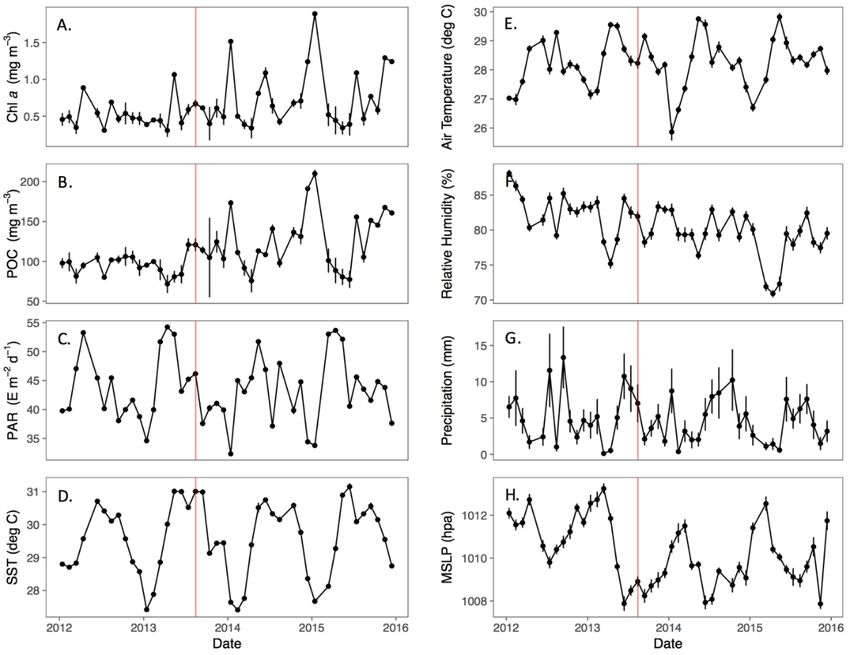
Fig. 7 shows the temporal patterns of Chl a and the other environmental parameters.
One-way ANOVA showed significant monthly and seasonal variations of all the
parameters (p < 0.05). Based on the pooled means in pre spill (1 – 18 months before the
spill) and post spill (1 – 26 months after the spill) conditions, higher Chl a and POC were
observed after the oil spill incident (pEdullantes et al.: Application of multimetric phytoplankton index to assess ecological health after an oil spill event
- 1364 -
Based on the Pearson correlation analysis, Chl a was positively correlated to AT
(r = 0.45) and PAR (r = 0.46) in the pre spill condition. However, it was negatively
correlated to both parameters (r = -0.42 and -0.52, respectively) in post spill condition. A
positive correlation between Chl a and POC (r = 0.88) was also observed in the post spill
condition.
We also used PCA to explore further the variability of the environmental parameters
before and after the spill. About 91.3% of the total variance was explained by the first
four PC axes as shown in the projections of the environmental parameters before and after
the spill on different PC axes in Fig. 8. PC1 and PC2 relate to hydrographic and
meteorological conditions. PC1 explained 38.9% of the total variance and significantly
explained the variability of air temperature and photosynthetically active radiation with
Pearson correlation coefficients (r) of 0.48 and 0.5, respectively. PC2 explained 27.2%
of the total variance and was related to mean sea level pressure and sea surface
temperature (r = 0.60 and -0.51, respectively). Both components did not significantly vary
before and after the spill (p > 0.05). On the other hand, PC3 and PC4 are related to the
trophic condition as it best explained the variability of Chla with r value of 0.57 and -
0.47, respectively. PC3 was also positively related to particulate organic carbon (r = 0.49).
There were significant differences in PC3 and PC4 between pre and post spill conditions
(p < 0.01), suggesting a possible shift in trophic status in the southern coast of Mactan
Island after the oil spill incidence.
Figure 8. Projection of the chlorophyll a level (Chl a), particulate organic carbon (POC),
photosynthetically active radiation (PAR), sea surface temperature (SST), air temperature (AT),
relative humidity (RH), precipitation (P), and mean sea level pressure (MSLP) on the (A) PC1
and PC2, and (B) PC3 and PC4 axes. Ellipses (95% confidence) represent the projections of the
variables in pre spill and post spill conditions
Discussion
The affected sites had an increase in one or more taxonomic groups, changing the
phytoplankton community composition. Certain phytoplankton genera dominate during
an oil-spill event, which could be used as indicators of the marine phytoplankton
community stressed by oil components (Hallare et al., 2011). Three of them (i.e.
Chaetoceros, Rhizosolenia, and Skeletonema) were present in the affected sites.
APPLIED ECOLOGY AND ENVIRONMENTAL RESEARCH 19(2):1353-1370.
http://www.aloki.hu ● ISSN 1589 1623 (Print) ● ISSN 1785 0037 (Online)
DOI: http://dx.doi.org/10.15666/aeer/1902_13531370
© 2021, ALÖKI Kft., Budapest, HungaryEdullantes et al.: Application of multimetric phytoplankton index to assess ecological health after an oil spill event
- 1365 -
Results also showed the dominance of diatoms and dinoflagellates in affected sites.
Diatoms proliferated dominantly relative to dinoflagellates in more highly affected site.
Unlike dinoflagellates, diatoms have been demonstrated to possess the ability to use oil
as a carbon source even at low concentrations to propagate colonizing an area affected by
oil spillage (El-Sheekh et al., 2000). They also possess silica frustules that protect them
from acute lethal effects of oil compared to the other naked phytoplankton (Ikavalko et
al., 2005). Conversely, some studies show that diatom growth is suppressed during the
oil spill and laboratory experiments (Harrison et al., 1986; Lee and Page, 1997) because
the structure of diatoms allows them to absorb hydrocarbons more readily thereby
enabling subsequent toxicity as well as hindering reproduction (Kustenko, 1981). Centric
diatoms (e.g. Coscinodiscus, Rhizosolenia, Skeletonema) predominates pennate diatoms
(e.g. Navicula, Nitzschia, Pleurosigma) due to the fact that the latter are more sensitive
to pollutants (Perez et al., 2010). However, this was not observed in the affected sites
since centric diatoms were found at very low densities.
The findings also suggest that phytoplankton communities in affected and reference
sites after 8 – 30 months from the spill had relatively similar abundance and richness,
which results in no variation in the diversity. The result suggests no apparent change in
phytoplankton communities from the reference condition throughout the investigated
period. However, remotely sensed chlorophyll a estimates in the affected sites were
higher than in the reference site, suggesting higher phytoplankton biomass and hence a
higher trophic state in the oil spill affected sites. Existing studies on the effect of oil spill
towards phytoplankton communities showed unclear and contradictory results – e.g. no
change in the number of planktonic population (Johansson et al., 1980; Khalaf et al.,
2006), reduction in the density, the number of species, diversity and ecophysiological
indices (Batten et al., 1998), and proliferation of phytoplankton (Hallare et al., 2011) in
an oil spill affected site.
Temporal variation was demonstrated in phytoplankton diversity, where it showed a
significant increasing trend after the spill. These findings suggest a possible shift in
taxonomic groups that change the composition of the phytoplankton community,
subsequently increasing the phytoplankton diversity and possibly the biomass after the
spill incidence.
One limitation in our in situ assessment of composition is that it is biased not only on
the armored or those with tests but the sampling is also biased on those net phytoplankton
that is usually in the microphytoplankton size. The phytoplankton or the autotrophic
bacteria and phytoplankton smaller than 20 microns are not captured in the analysis.
Another limitation of the assessment is the condition that the southern coast of Mactan is
chronically exposed also to oil being a navigational route of ships while the reference is
not that might contribute to the variation observed between the sites.
Oil spill affected sites may return to their reference condition just within two weeks
(Johansson et al., 1980) or more than six months (Spooner, 1977) after the oil spill.
Recovery of an affected site is greatly influenced by a myriad of factors such as coastal
topography, water-body characteristics, oil composition, and its fate, and also abiotic and
biotic factors. It is possible that the spilled oil had already been dispersed by spreading,
emulsification, dissolution, evaporation, sedimentation, adsorption (Bartha and Atlas,
1977), photo-oxidation (Lacaze and de Naïde, 1976), and bacterial degradation
(McGenity et al., 2012; Bensig et al., 2014). However, the recovery of phytoplankton
communities after the occurrence of the oil spill cannot be inferred from the findings due
to the absence of pre oil spill data.
APPLIED ECOLOGY AND ENVIRONMENTAL RESEARCH 19(2):1353-1370.
http://www.aloki.hu ● ISSN 1589 1623 (Print) ● ISSN 1785 0037 (Online)
DOI: http://dx.doi.org/10.15666/aeer/1902_13531370
© 2021, ALÖKI Kft., Budapest, HungaryEdullantes et al.: Application of multimetric phytoplankton index to assess ecological health after an oil spill event
- 1366 -
The observed differences in Chl a and POC between pre and post spill condition
suggest a possible contribution of the oil spill impact to the changes of trophic state in the
affected coastal water of Mactan Island. The correlative patterns of the environmental
parameters to the changes of Chl a showed to differ between pre and post spill conditions.
This may suggest possible interactive effects of the oil spill and meteorological factors
on the variability of Chl a. It is also possible that the change in the Chl a after the oil spill
may not be due to its interaction with environmental parameters but could be the previous
events that happened in the area, i.e oil spill incidence. For instance, the variability of Chl
a in areas with natural disturbance is not affected by the seasonal change of SST but is
mainly dependent on the current action of the ecosystem such as nutrients and chemical
composition of the area (Nababan et al., 2016). In this case, the probability of contributing
to the oil spill changed the chemical composition of the area and may lead to the effect of
the oil on the affected coastal waters.
Time-series analysis showed that there was a change in the monthly distribution of
Chl a in the affected area. No significant change was observed during first five months
of the oil spill when compared to the previous years of the same months, respectively.
However, a significant increase occurred 6 months after the oil spill. There was a lag time
before significant changes in the Chl a was observed. The time interval of this study
confirmed the findings of Sheng et al. (2011) that Chl a increase at an average of 6
months. In other studies, an increase in Chl a was observed after 5.5 months (Vargo et
al., 1982), 7 months (Riaux-Gobin, 1985), and 9 months (Sheng et al., 2011). While there
was no change in Chl a in this study during the first five months of the oil spill, findings
suggest the decrease of Chl a for about 2 weeks (Lee et al., 2009) while, in other study,
for about 7 weeks (Wang, 2015).
Increase of the phytoplankton in a time interval is possibly due to the oil weathering
in the area and the decreased zooplankton primarily feeding to the phytoplankton (Lee et
al., 2009). It has also been proven that zooplankton decreased significantly after the oil
spill and maybe the reason for lesser herbivory in the area (Johansson et al., 1980). Also,
the chance of the increased bacteria feeding the oil, as evidenced by increased nitrogen
products of bacterial metabolism, enhanced the possibility of removing oil fractions in
the area (Banks, 2003). Sheng et al. (2011) stated that the short-lived increase of
phytoplankton may be the roles of reduced grazing pressure, decomposition of dead
organisms, competitive and tolerant phytoplankton, and stimulating effect of oil to
phytoplankton.
Surprisingly, there was still evidence of Chl a increase in the affected area even after
the span of 18, 28, and 29 months. This observation is speculated to be a result of the long
term effect of the oil spill. It is likely that long term changes in the Chl a may be attributed
to the oil spill residue that may still be present in the underlying sediment of the affected
coastal waters. Duan et al. (2018) observed the presence of the residual oil in the sediment
at Bay Jimmy five years after the oil spill. They observed after the oil spill that there is a
significant increase in concentrations of polycyclic aromatic hydrocarbons (PAH),
n-alkenes, and total petroleum hydrocarbon. A number of studies have demonstrated the
negative effect of PAH on the phytoplankton biomass (Pelletier et al., 2006;
Kamalanathan et al., 2018). Degradation of these oil spill residue components may
provide a potential source of carbon for phytoplankton growth and productivity, which
may explain the long term increase of Chl a. However, this hypothesis is impossible to
test due to a lack of continuous field measurements.
APPLIED ECOLOGY AND ENVIRONMENTAL RESEARCH 19(2):1353-1370.
http://www.aloki.hu ● ISSN 1589 1623 (Print) ● ISSN 1785 0037 (Online)
DOI: http://dx.doi.org/10.15666/aeer/1902_13531370
© 2021, ALÖKI Kft., Budapest, HungaryEdullantes et al.: Application of multimetric phytoplankton index to assess ecological health after an oil spill event
- 1367 -
Conclusion
This study evaluated the multimetric phytoplankton-based ecological health status of
the coastal water of Mactan Island after 8 – 30 months from the oil spill incidence. The
important findings of this study were as follows: (1) Phytoplankton community structure
in affected and reference sites did not differ in abundance and richness that resulted in no
variation in the diversity between sites. However, the difference in abundance between
sites can be significantly different depending on the dates. Furthermore, the dominance
of the major taxonomic groups had shifted that changes the phytoplankton community
composition, subsequently increasing the phytoplankton diversity over time after the spill
incidence. Higher chlorophyll a was observed in oil spill affected sites. (2) Multivariate
analysis showed that the observed spatial and temporal variation can be best explained by
phytoplankton relative abundance diversity and trophic state, which can be used to
determine the MPI-BI. Based on the MPI-BI scores, the health status of the affected sites
after 8 – 30 months from the oil spill incident was generally in good condition. (3) A
time-series analysis of chlorophyll a concentration revealed the difference between pre
and post spill conditions that may suggest the effect of oil spill on the trophic state in the
affected coastal water. Overall, the health status of the affected coastal water may be
affected by oil as indicated by the increased level of chlorophyll a in the post spill
condition. However, the affected coastal water may also undergo a certain level of
recovery from the oil spill stress as suggested by the similarity of the phytoplankton
community structure to the reference site. Further study is recommended to evaluate the
long term chronic effects of oil spill on phytoplankton community and primary
productivity, but this requires continuous field measurements to verify the cause of the
changes.
Acknowledgements. We would like to thank the University of the Philippines Cebu (Creative Work and
Research Grant) for the funding. We also thank Monique Eloise Mercado for sharing the meteorological
data collected from PAGASA-DOST.
REFERENCES
[1] Arnold, J. B. (2019): ggthemes: Extra Themes, Scales and Geoms for 'ggplot2'. – R package
version 4.2.0.
[2] Baith, K., Lindsay, R., Fu, G., McClain, C. R. (2001): SeaDAS, a data analysis system for
ocean-color satellite sensors. – EOS Transactions American Geophysical Union 82: 202.
[3] Banks, S. (2003): SeaWiFS satellite monitoring of oil spill impact on primary production
in the Galápagos Marine Reserve. – Marine Pollution Bulletin 47(7): 325-330.
[4] Barbour, M. T., Swietlik, W. F., Jackson, S. K., Courtemanch, D. L., Davies, S. P., Yoder,
C. O. (2000): Measuring the attainment of biological integrity in the USA: a critical element
of ecological integrity. – Hydrobiologia 422/423: 453-464.
[5] Bartha, R., Atlas, R. M. (1977): The Microbiology of Aquatic Oil Spills. – Advances in
Applied Microbiology 22: 225-266.
[6] Batten, S. D., Allen, R. J. S., Wotton, C. O. M. (1998): The effects of the Sea Empress oil
spill on the plankton of the Southern Irish Sea. – Marine Pollution Bulletin 36(10): 764-
774.
[7] Becker, R. A., Wilks, A., Brownrigg, R., Minka, T. P., Deckmyn, A. (2018): maps: Draw
Geographical Maps. – R package version 3.3.0.
[8] Behrenfeld, M. J., Falkowski, P. G. (1997): Photosynthetic rates derived from satellite-
based chlorophyll concentration. – Limnology and Oceanography 42: 1-20.
APPLIED ECOLOGY AND ENVIRONMENTAL RESEARCH 19(2):1353-1370.
http://www.aloki.hu ● ISSN 1589 1623 (Print) ● ISSN 1785 0037 (Online)
DOI: http://dx.doi.org/10.15666/aeer/1902_13531370
© 2021, ALÖKI Kft., Budapest, HungaryEdullantes et al.: Application of multimetric phytoplankton index to assess ecological health after an oil spill event
- 1368 -
[9] Bensig, E. O., Edullantes, B., Silapan, J. R., Narsico, J. T. (2014): Oil degrading and
heterotrophic bacteria composition in the oil-spilled affected mangrove forest sediment in
Mactan Island, Central Philippines. – International Journal of Biosciences 5(8): 141-146.
[10] Bolognesi, C., Perrone, E., Roggieri, P., Sciutto, A. (2006): Bioindicators in monitoring
long term genotoxic impact of oil spill: Haven case study. – Marine Environmental
Research 62: S287-S291.
[11] Duan, J., Liu, W., Zhao, X., Han, Y., O’Reilly, S., Zhao, D. (2018): Study of residual oil
in Bay Jimmy sediment 5 years after the Deepwater Horizon oil spill: persistence of
sediment retained oil hydrocarbons and effect of dispersants on desorption. – Science of
the Total Environment 618: 1244-1253.
[12] El-Sheekh, M. M., El-Naggar, A. H., Osman, M. E. H., Haieder, A. (2000): Comparative
Studies on the Green Algae Chlorella homosphaera and Chlorella vulgaris with Respect
to Oil Pollution in the River Nile. – Water, Air, and Soil Pollution 124(1-2): 187-204.
[13] Falkowski, P. (2012): Ocean science: The power of plankton. – Nature 483(7387): S17-
S20.
[14] Farrington, J. W. (2013): Oil Pollution in the Marine Environment I: Inputs, Big Spills,
Small Spills, and Dribbles. – Environment: Science and Policy for Sustainable
Development 55(6): 3-13.
[15] Farrington, J. W. (2014): Oil Pollution in the Marine Environment II: Fates and Effects of
Oil Spills. – Environment: Science and Policy for Sustainable Development 56(4): 16-31.
[16] Flores, M. J., Silapan, J., Edullantes, B. (2020): Effect of the MV Saint Thomas Aquinas
on zooplankton composition and abundance in Mactan Island, Cebu, the Philippines. –
Journal of Nature Studies 19(1): 105-119.
[17] García Pérez, J. D. (2003): Early socio-political and environmental consequences of the
Prestige oil spill in Galicia. – Disasters 27(3): 207-23.
[18] Gesteira, J. L. G., Dauvin, J. C. (2000): Amphipods are Good Bioindicators of the Impact
of Oil Spills on Soft-Bottom Macrobenthic Communities. – Marine Pollution Bulletin
40(11): 1017-1027.
[19] Gin, K. Y. H., Kamrul Huda, M., Kiat Lim, W., Tkalich, P. (2001): An Oil Spill–Food
Chain Interaction Model for Coastal Waters. – Marine Pollution Bulletin 42(7): 590-597.
[20] Guiry, M. D., Guiry, G. M. (2016): AlgaeBase. – World-wide electronic publication,
National University of Ireland, Galwa, http://www.algaebase.org.
[21] Hallare, A. V, Lasafin, K. J. A., Magallanes, J. R. (2011): Shift in Phytoplankton
Community Structure in a Tropical Marine Reserve Before and After a Major Oil Spill
Event. – International Journal Environmental Research 5(3): 651-660.
[22] Harrison, P. J., Cochlan, W. P., Acreman, J. C., Parsons, T. R., Thompson, P. A., Dovey,
H. M., Xiaolin, C. (1986): The effects of crude oil and Corexit 9527 on marine
phytoplankton in an experimental enclosure. – Marine Environmental Research 18(2): 93-
109.
[23] Hijmans, R. J. (2020): raster: Geographic Data Analysis and Modeling. – R package
version 3.3-13.
[24] Ikavalko, J., Gerdes, B., Hiukka, R. (2005): Effects of crude oil on arctic sea ice biota, an
experimental study. – Phycologia 44: 48-58.
[25] International Maritime Organization, United Nations (2009): IMO/UNEP guidance manual
on the assessment and restoration of environmental damage following marine oil spills. –
Environment Programme, International Maritime Organization.
[26] Johansson, S., Larsson, U., Boehm, P. (1980): The Thesis oil spill impact on the pelagic
ecosystem. – Marine Pollution Bulletin 11(10): 284-293.
[27] Kamalanathan, M., Xu, C., Schwehr, K., Bretherton, L., Beaver, M., Doyle, S. M., Genzer,
J., Hillhouse, J., Sylvan, J. B., Santschi, P. (2018): Extracellular enzyme activity profile in
a chemically enhanced water accommodated fraction of surrogate oil: toward
understanding microbial activities after the Deepwater Horizon oil spill. – Frontiers in
Microbiology 9: 798.
APPLIED ECOLOGY AND ENVIRONMENTAL RESEARCH 19(2):1353-1370.
http://www.aloki.hu ● ISSN 1589 1623 (Print) ● ISSN 1785 0037 (Online)
DOI: http://dx.doi.org/10.15666/aeer/1902_13531370
© 2021, ALÖKI Kft., Budapest, HungaryEdullantes et al.: Application of multimetric phytoplankton index to assess ecological health after an oil spill event
- 1369 -
[28] Khalaf, G., Nakhlé, K., Abboud-Abi Saab, M., Tronczynski, J., Mouawad, R., Fakhri, M.
(2006): Preliminary results of the oil spill impact on Lebanese coastal waters. – Lebanese
Science Journal 7(2): 135-153.
[29] Kustenko, N. G. (1981): Effect of low oil concentrations on Spermatogonangii and
Auxospores in three species of marine diatoms. – Okeanologiya/Oceanology (Moscow) 21:
366-369.
[30] Lacaze, J. C., Villedon de Naïde, O. (1976): Influence of illumination on phytotoxicity of
crude oil. – Marine Pollution Bulletin 7(4): 73-76.
[31] Lee, R. F., Page, D. S. (1997): Petroleum hydrocarbons and their effects in subtidal regions
after major oil spills. – Marine Pollution Bulletin 34(11): 928-940.
[32] Lee, C. I., Kim, M. C., Kim, H. C. (2009): Temporal variation of chlorophyll a
concentration in the coastal waters affected by the Hebei Spirit oil spill in the West Sea of
Korea. – Marine Pollution Bulletin 58(4): 496-502.
[33] Li, Y., Hu, C., Quigg, A., Gao, H. (2019): Potential influence of the Deepwater Horizon
oil spill on phytoplankton primary productivity in the northern Gulf of Mexico. –
Environmental Research Letters 14: 094018.
[34] McGenity, T. J., Folwell, B. D., McKew, B. A., Sanni, G. O. (2012): Marine crude-oil
biodegradation: a central role for interspecies interactions. – Aquatic biosystems 8(1): 10.
[35] Nababan, B., Rosyadi, N., Manurung, D., Natih, N. M., Hakim, R. (2016): The Seasonal
Variability of Sea Surface Temperature and Chlorophyll-a Concentration in the South of
Makassar Strait. – Procedia Environmental Sciences 33: 583-599.
[36] NASA Goddard Space Flight Center, Ocean Biology Processing Group (2014): Sea-
viewing Wide Field-of-view Sensor (SeaWiFS) Ocean Color Data. – NASA OB.DAAC,
Greenbelt, MD, USA. http://doi.org/10.5067/ORBVIEW-2/SEAWIFS_OC.2014.0.
Accessed 2018/10/21. Maintained by NASA Ocean Biology Distibuted Active Archive
Center (OB.DAAC), Goddard Space Flight Center, Greenbelt MD.
[37] Oksanen, J., Blanchet, F. G., Friendly, M., Kindt, R., Legendre, P., McGlinn, D., Minchin,
P. R., O'Hara, R. B., Simpson, G. L., Solymos, P., Stevens, M. H., Szoecs, E., Wagner, H.
(2019): vegan: Community Ecology Package. – R package version 2.5-6.
[38] Ozhan, K., Parsons, M. L., Bargu, S. (2014): How Were Phytoplankton Affected by the
Deepwater Horizon Oil Spill? – BioScience 64(9): 829-836.
[39] Parsons, M. L., Morrison, W., Rabalais, N. N., Turner, R. E., Tyre, K. N. (2015):
Phytoplankton and the Macondo oil spill: A comparison of the 2010 phytoplankton
assemblage to baseline conditions on the Louisiana shelf. – Environmental pollution 207:
152-60.
[40] Pelletier, E., Sargian, P., Payet, J., Demers, S. (2006): Ecotoxicological effects of combined
UVB and organic contaminants in coastal waters: a review. – Photochemistry and
Photobioliology 82: 981-93.
[41] Perez, P., Fernandez, E., Beiras, R. (2010): Fuel toxicity on Isochrysis galbana and a coastal
phytoplankton assemblage: Growth rate vs. variable fluorescence. – Ecotoxicology and
Environmental Safety 73(3): 254-261.
[42] R Core Team (2019): R: A language and environment for statistical computing. – R
Foundation for Statistical Computing, Vienna, Austria. https://www.R-project.org/.
[43] Reynolds, C. S. (2006): Ecology of phytoplankton. – Cambridge: Cambridge University
Press.
[44] Riaux-Gobin, C. (1985): Long-term changes in microphytobenthos in a Brittany estuary
after the ”Amoco Cadiz” oil spill. – Marine Ecology Progress Series 24: 51-56.
[45] Sadaba, R., Niego, A. G. (2016): Assessment on the effects of an oil spill in the mangroves
of Cordova, Cebu, Philippines. – The Malaysian Forester 79(1&2): 144-156.
[46] Sheng, Y., Tang, D., Pan, G. (2011): Phytoplankton bloom over the Northwest Shelf of
Australia after the Montara oil spill in 2009. – Geomatics, Natural Hazards and Risk 2(4):
329-347.
[47] Spooner, M. F. (1977): Oil spill in Hong Kong. – Marine Pollution Bulletin 8(3): 62-65.
APPLIED ECOLOGY AND ENVIRONMENTAL RESEARCH 19(2):1353-1370.
http://www.aloki.hu ● ISSN 1589 1623 (Print) ● ISSN 1785 0037 (Online)
DOI: http://dx.doi.org/10.15666/aeer/1902_13531370
© 2021, ALÖKI Kft., Budapest, HungaryEdullantes et al.: Application of multimetric phytoplankton index to assess ecological health after an oil spill event
- 1370 -
[48] Suderman, K., Thistle, D. (2004): The relative impacts of spills of two alternative fuels on
the microalgae of a sandy site: a microcosm study. – Marine Pollution Bulletin 49(5): 473-
478.
[49] Surís-Regueiro, J. C., Garza-Gil, M. D., Varela-Lafuente, M. M. (2007): The Prestige oil
spill and its economic impact on the Galician fishing sector. – Disasters 31(2): 201-215.
[50] Teng, L., Zhang, B., Liu, X., Bai, C., Zhang, J., Tan, D., Huang, P. (2014): Development
and Use of a Phytoplankton-Index of Biotic Integrity to Assess Yongjiang River Ecosystem
Health. – Polish Journal of Environmental Studies 23(3): 901-908.
[51] Vargo, G., Hutchins, M., Almquist, G. (1982): The effect of low, chronic levels of no. 2
fuel oil on natural phytoplankton assemblages in microcosms: 1. Species composition and
seasonal succession. – Marine Environmental Research 6(4): 245-264.
[52] Verlecar, X. N., Desai, S. (2004): Phytoplankton Identification Manual. – First Dona Paula,
Goa: National Institute of Oceanography.
[53] Verlecar, X. N., Desai, S. R., Sarkar, A., Dalal, S. G. (2006): Biological indicators in
relation to coastal pollution along Karnataka coast, India. – Water Research 40(17): 3304-
3312.
[54] Wang, D. (2015): Remote Sensing-Based Study on the Temporal Variations in
Chlorophyll-a Concentration After Confo Oil Spill in Bohai Sea. – Journal of the Indian
Society of Remote Sensing 43(1): 133-142.
[55] Wickham, H., Averick, M., Bryan, J., Chang, W., D'Agostino McGowan, L., François, R.,
Grolemund, G., Hayes, A., Henry, L., Hester, J., Kuhn, M., Pedersen, T. L., Miller, E.,
Milton Bache, S., Müller, K., Ooms, J., Robinson, D., Paige Seidel, D., Spinu, V.,
Takahashi, K., Vaughan, D., Wilke, C., Woo, K., Yutani, H. (2019): Welcome to the
tidyverse. – Journal of Open Source Software 4(43): 1686.
APPLIED ECOLOGY AND ENVIRONMENTAL RESEARCH 19(2):1353-1370.
http://www.aloki.hu ● ISSN 1589 1623 (Print) ● ISSN 1785 0037 (Online)
DOI: http://dx.doi.org/10.15666/aeer/1902_13531370
© 2021, ALÖKI Kft., Budapest, HungaryYou can also read