Predicting new major depression symptoms from long working hours, psychosocial safety climate and work engagement: a populationbased cohort study
←
→
Page content transcription
If your browser does not render page correctly, please read the page content below
Open access Original research
Predicting new major depression
BMJ Open: first published as 10.1136/bmjopen-2020-044133 on 23 June 2021. Downloaded from http://bmjopen.bmj.com/ on October 28, 2021 by guest. Protected by copyright.
symptoms from long working hours,
psychosocial safety climate and work
engagement: a population-based
cohort study
Amy Jane Zadow ,1 Maureen F Dollard,1,2 Christian Dormann,3
Paul Landsbergis4
To cite: Zadow AJ, Dollard MF, ABSTRACT
Dormann C, et al. Predicting Strengths and limitations of this study
Objectives This study sought to assess the association
new major depression between long working hours, psychosocial safety
symptoms from long ►► Unlike previous cross-sectional studies, this study
climate (PSC), work engagement (WE) and new major
working hours, psychosocial uses prospective cohort data across a 12-month
depression symptoms emerging over the next 12
safety climate and work period removing employees with major depression
engagement: a population- months. PSC is the work climate supporting workplace
symptoms at Time 1 to examine the relationship
based cohort study. BMJ Open psychological health.
between psychosocial safety climate, work engage-
2021;11:e044133. doi:10.1136/ Setting Australian prospective cohort population data ment, long working hours (LWH) and new cases of
bmjopen-2020-044133 from the states of New South Wales, Western Australia and major depression symptoms.
South Australia. ►► In contrast to studies of depression aetiology in clin-
►► Prepublication history and
additional supplemental material Participants At Time 1, there were 3921 respondents in ical populations or occupational groups, this article
for this paper are available the sample. Self-employed, casual temporary, unclassified, uses data randomly selected from three Australian
online. To view these files, those with working hoursOpen access
BMJ Open: first published as 10.1136/bmjopen-2020-044133 on 23 June 2021. Downloaded from http://bmjopen.bmj.com/ on October 28, 2021 by guest. Protected by copyright.
major depressive disorder clinically diagnosed or assessed of depressive disorders clinically diagnosed or assessed
by a structured interview,4 is mixed. International Labour by a structured interview.4 Finally, a meta-analysis of 10
Organization (ILO) statistics estimate that 22% of the published and 18 unpublished prospective cohort studies
global working population, or 614.2 million workers, are did not identify gender differences, but found an asso-
working long hours of more than 48 hours/week.5 LWHs ciation between LWHs and depressive symptoms which
across the world, currently increasing in response to the was higher in Asian studies, weaker in Europe and not
COVID-19 pandemic,6 7 present serious implications for present in North America and Australia.3
mental health. Understanding the role of LWHs in the Hypothesis 1 (H1). There is a positive relationship
development of major depression symptoms, and how between LWHs and the development of new cases of
psychosocial safety climate (PSC) and work engagement major depression symptoms.
(WE) may influence this relationship, will improve the Although the literature is mixed, we explore sex differ-
prioritisation of preventive measures for clinicians and ences in the relationship between LWHs and depression.
policymakers to promote mental health, including work- Historically, women have been more adversely affected
place redesign, legislation and guidelines for minimum by overtime work,24 25 yet recent systematic reviews and
risk exposure. meta-analyses of gender differences are divided with
some finding no differences3 23 and others finding some
Depression limited evidence that there is a stronger association
Major depression affects an estimated 300 million people between LWHs and depressive disorder for women.2 4
across the world and has become a pervasive global Type of work has also been explored with one systematic
burden across cultures.8 Major depression has a high review and meta-analysis finding no differences in the
risk of recurrence and leads to functional impairment, relationship between LWHs and depression between
elevated morbidity and mortality, and destructive social occupational groups,4 despite other longitudinal studies
and economic consequences.9 Despite increases in treat- suggesting that groups working in jobs involving heavy
ment provision there has been no strong evidence of a manual labour are more likely to work longer hours, and
decreased prevalence of major depression symptoms in hence develop depression.26
the population suggesting the importance of the inves-
tigation of broader risk factors to develop strategic The PSC context
prevention approaches.10 Evidence suggests that major In the current literature there are no prospective
depression symptoms can be an outcome of poorly func- population-based cohort studies of how the work climate
tioning work environments.2 11–16 Risk factors in the work influences LWHs and subsequent depression. It is
environment have been identified using theoretical important to understand this relationship because the
models of work stress including the job-demand-control climate, specifically PSC, as a leading indicator of work-
model,17 effort- reward imbalance (ERI) model18 and place psychosocial risks,27–29 may be an effective target for
models of organisational injustice.19 20 Systematic reviews intervention by clinicians and policymakers to prevent
and meta-analyses have linked these workplace psychoso- new major depression symptoms. PSC theory proposes
cial risk factors to depression. Specific psychosocial risk that the origin of poor workplace mental health, such as
factors with a high or moderate level of evidence include depression, begins at the organisational level via manage-
job strain (high psychological demands and low decision ment practices, priorities and values, before the develop-
latitude),2 14 21 high job demands,12 14 low social support,12 ment of the specific job-level characteristics, such as high
low decision latitude,2 14 organisational injustice,14 ERI14 22 job demands and low resources emphasised in dominant
and bullying.2 14 Yet evidence for the relationship between work stress theories.29–34
LWHs and depression is currently limited.2 3 22 Hypothesis 2 (H2). PSC is inversely associated with the
development of new cases of major depression symptoms.
Long working hours Since PSC relates to management values and is a
Prospective studies of the relationship between LWHs and precursor to working conditions, it is likely that when PSC
depression are preferred as cross-sectional designs risk is high, workers will not be encouraged or forced to work
inflating associations when self-reported descriptions of long hours, and when PSC is low, there is a likelihood that
both explanatory and dependent factors are used.2 Four workers are pressed to work long hours.
systematic reviews and/or meta-analyses have examined Hypothesis 3 (H3). PSC is inversely associated with LWHs.
the prospective relationship between LWHs and depres- Bringing these propositions together, we propose that:
sion. The first, citing three prospective cohort studies Hypothesis 4 (H4). LWHs mediate the relation-
and one cross-sectional study, identified an association ship between PSC and new cases of major depression
between LWHs and depressive state.23 The second, using symptoms.
six cohort studies, found limited evidence for women and
very limited evidence for men for the association between Work engagement
LWHs and depressive symptoms.2 The third, reviewing Studies define WE as a positive, motivational state of work-
seven cohort studies, did not find a statistically significant related well-being characterised by high levels of vigour,
association between working ≥50 hours/week and risk dedication and absorption.35 36
2 Zadow AJ, et al. BMJ Open 2021;11:e044133. doi:10.1136/bmjopen-2020-044133Open access
BMJ Open: first published as 10.1136/bmjopen-2020-044133 on 23 June 2021. Downloaded from http://bmjopen.bmj.com/ on October 28, 2021 by guest. Protected by copyright.
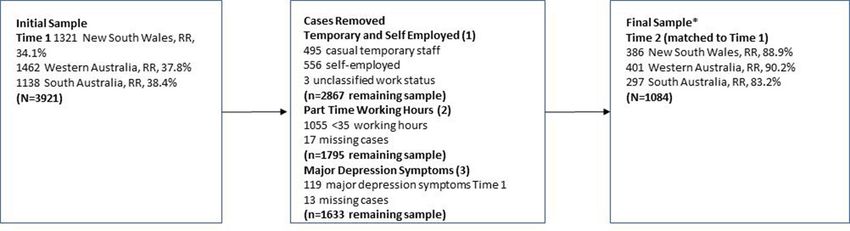
are shown in figure 2 (average for T1 36.7%). Since we
are interested in employed workers we removed the self-
employed, casual temporary and unclassified since PSC
is unlikely to develop in those cases (see figure 2table 1).
Next, we removed those with working hoursOpen access
BMJ Open: first published as 10.1136/bmjopen-2020-044133 on 23 June 2021. Downloaded from http://bmjopen.bmj.com/ on October 28, 2021 by guest. Protected by copyright.
Figure 2 Selection criteria for logistic regression. *RRs at Time 2 are prior to matching to Time 1 data. RR, response rate.
four exposure-level categories of 35–40, 41–48, 49–54 and Work engagement
≥55.46 WE was included for additional analyses and was
measured with the nine-item Utrecht Work Engagement
Psychosocial safety climate Scale with example items ‘At my work, I feel bursting
We used the PSC 12- item scale.47 Each of the four with energy’ and ‘I am enthusiastic about my work’.48 All
subscales contains three items as follows: (1) Manage- items were measured on a 7-point Likert scale, ranging
ment commitment assesses senior management commit- from 1=never to 7=every day. When used dichotomously,
ment to psychological health. An example item is ‘Senior 0=scores less than the mean, 1=scores greater than the
management acts decisively when a concern of an mean (αT1=0.84).
employee’s psychological status is raised’. (2) Manage-
ment priority measures the organisational and senior Major depression symptoms
management priority for psychological health with an The nine-item Patient Health Questionnaire (PHQ-9)49
example item, ‘Senior management considers employee was used to measure major depression symptoms. The
psychological health to be as important as productivity’. PHQ-9 is the most commonly used tool for screening
major depression in primary care with combined sensi-
(3) Organisational communication measures oppor-
tivity and specificity maximised at a cut-off score of 10
tunities for communication in the organisation about
or above.50 The time reference of the scale was adjusted
psychological health issues, and an example is ‘There
to the last 4 weeks for reasons of consistency with other
is good communication here about psychological safety
measures in the omnibus tool (Australian Workplace
issues which affect me’. (4) Organisational participation Barometer). The items were measured on a 4- point
measures the degree of involvement and participation, Likert scale: 0 (not at all), 1 (several days), 2 (more than
such as ‘Employees are encouraged to become involved half the days), 3 (nearly every day), and an example item is
in psychological safety matters’. All items were measured ‘During the last month, how often were you bothered by
on a 5-point Likert scale, ranging from 1 (strongly disagree) feeling down, depressed, or hopeless?’ Depression levels
to 5 (strongly agree). Alpha for the continuous measure was are indicated by scores 0–4 (no depression), 5–9 (mild,
αT1=0.94. We coded 0 to 37=0 as low PSC, high risk; and subclinical), 10–14 (moderate, clinical), 15–19 (moder-
37.01 to highest=1 as high PSC, low risk, based on bench- ately severe, clinical) and 20–27 (severe, clinical).51 For
marking work by Bailey et al using this data set (and vari- this study, we designated major depression symptoms as
ations of it) that identified PSC of 37 or less for high risk scores ≥10; these have a sensitivity of 88% and a speci-
of moderate to severe depression.28 ficity of 88% for a clinical diagnosis of major depression
Table 1 Sample attrition, employees randomly selected from the populations of New South Wales, Western Australia 2009–
2010 and South Australia 2010–2011
Participation n M SD t df P value
Hours worked in past week T1 only 844 36.34 16.53 1.59 2865 0.11
T1 and T2 2023 35.26 16.34
PSC* T1 only 844 41.60 9.25 3.07 1749 0.002
T1 and T2 2023 40.34 10.32
Depression T1 only 844 3.78 3.96 0.91 2865 0.38
T1 and T2 2023 3.54 3.75
T indicates Time. Sample includes all hours and those clinically depressed at Time 1.
*Levene’s test for equality of variances for PSC was significant, F=16.26, pOpen access
BMJ Open: first published as 10.1136/bmjopen-2020-044133 on 23 June 2021. Downloaded from http://bmjopen.bmj.com/ on October 28, 2021 by guest. Protected by copyright.
symptoms.46 Major depression symptoms were scored
Table 2 Descriptives of study variables, employees
randomly selected from the populations of New South 0=no major depression symptom (0–9) and 1=major
Wales, Western Australia 2009–2010 and South Australia depression symptoms (≥10). Alpha for the continuous
2010–2011 measure was αT1=0.80; αT2=0.80.
Range n %
Statistical analysis
Long hours 35–40 519 47.9 Bivariate correlations were completed for the study vari-
worked in past
week
ables (see table 3). Multiple logistic regression analysis was
completed with the study variables to predict new major
41–48 239 22.0
depression symptoms 12 months after baseline (table 4,
49–54 147 13.6 models 1–8) and LWHs with PSC (table 5, models 1–3)
≥55 179 16.5 and WE (table 6, models 1–3). Additional mediation anal-
Gender Male 661 61.0 ysis was completed examining the relationship between
Female 423 39.0 WE and major depression symptoms mediated by LWHs
Income (table 7). Further supplementary analyses were also
conducted predicting a continuous measure of LWHs
Up to $12 000 2 0.2
(online supplemental table 1a, models 1–2). Sensitivity
$12 001–$20 000 14 1.3 analyses were also conducted removing mild depression
$20 001–$30 000 37 3.4 symptoms (online supplemental table 2a, model 1; online
$30 001–$40 000 100 9.2 supplemental table 3a, models 1–3).
$40 001–$50 000 152 14.0 H1 and H2 were tested using multiple logistic regres-
$50 001–$60 000 149 13.8
sion with major depression symptoms at T2 (yes=1, no=0)
as the dependent variable (see table 4). Age, gender and
$60 001–$80 000 281 25.9
income were entered as controls on the first step of the
$80 001–$100 000 141 13.0 regressions (table 4, model 1); LWHs were entered on the
More than $100 000 208 19.2 second step of the regression (H1) (table 4, model 2);
PSC was entered at the third step (H2) (table 4, model 3).
PSC Low 383 35.3 H3 was assessed using logistic regression to identify
High 701 64.7
whether LWHs as a continuous measure regressed on
PSC (see table 5, models 1–3). We also used multinominal
M SD
regression to estimate the odds of working in the long
Age 18–75 years 47.56 10.61 hour categories due to PSC (also measured as a contin-
Matched sample, n=1084. uous variable) after controlling for age, sex and income
PSC, psychosocial safety climate. (see online supplemental table 1a, model 1).
Mediation H4 is potentially supported if H1, H2 and
H3 hold, and H1 holds with PSC as an independent
Table 3 Pearson correlations between study variables
1 2 3 4 5 6 7
1. Age T1
2. Female T1 0.09**
3. Income T1 0.10** −0.25***
4. High PSC T1 0.02 −0.01 −0.03
5. WE T1 0.06* 0.09** −0.01 0.36**
6. Long hours worked T1 0.07* −0.17*** 0.29*** −0.05 0.14**
7. Major Depression −0.12*** 0.10** −0.01 −0.25*** −0.21** 0.06*
Symptoms T1†
8. Major Depression −0.12*** 0.06* 0.01 −0.20*** −0.16** 0.09** 0.52***
Symptoms T2
Matched sample, n=1084. *POpen access
BMJ Open: first published as 10.1136/bmjopen-2020-044133 on 23 June 2021. Downloaded from http://bmjopen.bmj.com/ on October 28, 2021 by guest. Protected by copyright.
Table 4 Predicting new major depression symptoms 12 months after baseline; multiple logistic regression analysis
Time 1 OR P value LB UB B SE Wald df
Model 1
Intercept 0.01 −3.38 1.11 9.28 1
Age 1.00 0.99 0.97 1.03 0.01 0.02 0.01 1
Female 0.96 0.92 0.48 1.95 −0.04 0.36 0.01 1
Income 1.02 0.87 0.84 1.23 0.02 0.10 0.03 1
Model 2
Intercept 0.00 −3.41 1.10 9.61 1
Age 1.00 0.87 0.97 1.03 0.00 0.02 0.03 1
Female 1.02 0.97 0.50 2.07 0.02 0.36 0.00 1
Income 0.98 0.80 0.80 1.19 −0.03 0.10 0.06 1
41–48 hours 1.74 0.20 0.74 4.06 0.55 0.43 1.62 1
49–54 hours 1.43 0.52 0.48 4.25 0.36 0.56 0.42 1
≥55 hours 2.15 0.10 0.86 5.35 0.77 0.47 2.71 1
Model 3
Intercept 0.01 −2.63 1.13 5.34 1
Age 1.00 0.98 0.97 1.03 0.01 0.02 0.01 1
Female 0.91 0.80 0.45 1.85 −0.09 0.36 0.06 1
Income 1.00 0.98 0.82 1.21 0.01 0.10 0.01 1
PSC>37 0.32 0.001 0.16 0.63 −1.15 0.35 10.98 1
Model 4
Intercept 0.18 −2.63 1.12 5.50 1
Age 1.00 0.92 0.97 1.03 0.00 0.02 0.01 1
Female 0.95 0.89 0.47 1.95 −0.05 0.36 0.02 1
Income 0.95 0.64 0.78 1.17 −0.05 0.10 0.22 1
PSC>37 0.31 0.01 0.16 0.61 −1.17 0.35 11.31 1
41–48 hours 1.85 0.16 0.79 4.37 0.62 0.44 1.99 1
49–54 hours 1.41 0.54 0.47 4.22 0.34 0.56 0.38 1
≥55 hours 2.20 0.09 0.88 5.51 0.79 0.47 2.85 1
Model 5
Intercept 0.00 −3.29 1.11 8.74 1
Age 1.00 0.98 0.97 1.03 0.00 0.02 0.00 1
Female 1.00 0.99 0.50 2.03 0.00 0.36 0.00 1
Income 1.02 0.83 0.84 1.24 0.02 0.10 0.05 1
WE >56.6 0.68 0.25 0.35 1.31 −0.39 0.34 1.34 1
Model 6
Intercept 0.23 −3.28 1.10 8.84 1
Age 1.00 0.89 0.97 1.03 0.00 0.02 0.02 1
Female 1.07 0.85 0.53 2.20 0.07 0.36 0.04 1
Income 0.97 0.80 0.80 1.19 −0.03 0.10 0.06 1
WE >56.6 0.63 0.18 0.32 1.23 −0.46 0.34 1.82 1
41–48 hours 1.79 0.18 0.76 4.19 0.58 0.43 1.78 1
49–54 hours 1.58 0.41 0.53 4.74 0.46 0.56 0.67 1
≥55 hours 2.31 0.07 0.92 5.81 0.84 0.47 3.19 1
Model 7
Intercept 0.13 −1.83 1.19 2.33 1
Age 1.00 0.89 0.97 1.03 0.00 0.02 0.02 1
Female 0.51 0.17 0.19 1.34 −0.68 0.50 1.87 1
Continued
6 Zadow AJ, et al. BMJ Open 2021;11:e044133. doi:10.1136/bmjopen-2020-044133Open access
BMJ Open: first published as 10.1136/bmjopen-2020-044133 on 23 June 2021. Downloaded from http://bmjopen.bmj.com/ on October 28, 2021 by guest. Protected by copyright.
Table 4 Continued
Time 1 OR P value LB UB B SE Wald df
Income 0.96 0.70 0.79 1.17 −0.04 0.10 0.15 1
PSC>37 0.04 0.01 0.01 0.32 −3.32 1.11 8.90 1
PSC × sex 4.63 0.04 1.10 19.51 1.53 0.73 4.36 1
41–48 hours 1.85 0.16 0.23 1.27 0.62 0.44 1.99 1
49–54 hours 1.34 0.60 0.25 2.23 0.30 0.56 0.28 1
≥55 hours 2.32 0.09 0.18 1.13 0.80 0.47 2.90 1
Model 8
Intercept 0.21 −1.64 1.30 1.57 1
Age 1.00 0.91 0.97 1.03 0.00 0.02 0.01 1
Female 0.26 0.08 0.06 1.15 −1.36 0.76 3.15 1
Income 0.98 0.87 0.80 1.20 −0.02 0.10 0.03 1
WE >56.6 0.03 0.00 0.00 0.30 −3.57 1.21 8.75 1
WE × sex 10.28 0.01 1.76 59.94 2.33 0.90 6.71 1
41–48 hours 1.80 0.18 0.77 4.25 0.59 0.44 1.82 1
49–54 hours 1.65 0.37 0.55 4.95 0.50 0.56 0.80 1
≥55 hours 2.37 0.07 0.94 6.02 0.86 0.47 3.31 1
95% CIs.
B, beta coefficient; LB, lower bound; PSC, psychosocial safety climate; UB, upper bound.
Table 5 Predicting long working hours with PSC; multiple logistic regression analysis
Time 1 OR P value LB UB B SE Wald df
41–48 hours
Model 1
Intercept 0.00 −2.95 0.56 27.94 1
Age 1.02 0.01 1.00 1.04 0.02 0.01 6.45 1
Female gender 0.96 0.78 0.69 1.32 −0.05 0.17 0.08 1
Income 1.20 0.00 1.10 1.32 0.19 0.05 15.33 1
PSC 1.21 0.26 0.87 1.69 0.19 0.17 1.30 1
49–54 hours
Model 2
Intercept 0.00 −3.60 0.74 23.76 1
Age 1.02 0.09 1.00 1.04 0.02 0.01 2.89 1
Female gender 0.40 0.00 0.26 0.63 −0.92 0.23 15.81 1
Income 1.51 0.00 1.34 1.72 0.41 0.06 42.04 1
PSC 0.93 0.70 0.62 1.37 −0.08 0.20 0.15 1
≥55 hours
Model 3
Intercept 0.00 −4.00 0.69 33.64 1
Age 1.02 0.04 1.00 1.04 0.02 0.01 4.14 1
Female gender 0.54 0.00 0.36 0.80 −0.62 0.20 9.41 1
Income 1.53 0.00 1.36 1.72 0.42 0.06 51.04 1
PSC 1.04 0.85 0.72 1.50 0.04 0.19 0.03 1
Reference category for hours is 35–40.
B, beta coefficient; LB, lower bound; PSC, psychosocial safety climate; UB, upper bound.
Zadow AJ, et al. BMJ Open 2021;11:e044133. doi:10.1136/bmjopen-2020-044133 7Open access
BMJ Open: first published as 10.1136/bmjopen-2020-044133 on 23 June 2021. Downloaded from http://bmjopen.bmj.com/ on October 28, 2021 by guest. Protected by copyright.
Table 6 Predicting long working hours with WE; multiple logistic regression analysis
Time 1 OR P value LB UB B SE Wald df
41–48 hours
Model 1
Intercept 0.00 −2.88 0.55 27.91 1
Age 1.02 0.01 1.00 1.04 0.02 0.01 6.34 1
Female gender 0.92 0.60 0.66 1.27 −0.09 0.17 0.27 1
Income 1.20 0.00 1.09 1.32 0.18 0.05 14.95 1
WE 1.27 0.15 0.92 1.74 0.24 0.16 2.11 1
49–54 hours
Model 2
Intercept 0.00 −3.97 0.73 29.26 1
Age 1.02 0.12 1.00 1.04 0.02 0.01 2.41 1
Female gender 0.37 0.00 0.23 0.58 −1.01 0.23 18.69 1
Income 1.50 0.00 1.33 1.70 0.41 0.06 40.34 1
WE 2.45 0.00 1.61 3.72 0.89 0.21 17.43 1
≥55 hours
Model 3
Intercept 0.00 −4.17 0.68 37.66 1
Age 1.02 0.05 1.00 1.04 0.02 0.01 3.71 1
Female gender 0.50 0.00 0.34 0.75 −0.69 0.20 11.50 1
Income 1.52 0.00 1.35 1.71 0.42 0.06 49.83 1
WE 1.86 0.00 1.28 2.70 0.62 0.19 10.47 1
Reference category for hours is 35–40.
B, beta coefficient; LB, lower bound; UB, upper bound.
predictor in the model (table 4, model 4). A formal test between 7 and 9) and used multinominal regression to
of H4 was conducted using a Monte Carlo bootstrapping estimate the odds of developing new major depressive
procedure52 which provides more accurate confidence symptoms due to PSC and WE measured as continuous
limits and statistical power than other methods53 54 of the variables and LWHs after controlling for age, gender and
indirect effect of PSC on depressive symptoms via LWHs. income (see online supplemental tables 2a and 3a). IBM
Next, we tested hypotheses with WE48 as the predictor SPSS V.25 was used for all the statistical analyses.
and tested H5 (table 4, model 5) and H6 (table 4, model
6; table 6, models 1–3; online supplemental table 2a,
model 1) using procedures outlined for H1–H4. RESULTS
We also conducted a range of additional analyses to Analysis of participation data, as shown in table 1, shows
assess whether sex was a modifier of expected relation- no significant difference in the sample that participated
ships. We added interaction terms after main effects. Inter- at T1 only (n=844) compared with the repeated measures
actions between PSC and sex (table 4, model 7) and WE sample (T1 and T2, n=2023) (see figure 2) in terms of
and sex (table 4, model 8) were also conducted. Finally, hours worked in the past week or levels of depression.
we conducted sensitivity analysis where we excluded However, participants in the matched sample reported
those with mild symptoms of depression (PHQ-9 scores significantly less PSC than those who participated at T1
Table 7 Relationship between work engagement (WE) and major depression symptoms mediated by long working hours
(LWH) (sensitivity analysis)
LWH to major depression symptoms Mediation
Hours WE to LWH (with WE in the model) LB, UB
41–48 vs 35–40 hours 0.03 (SE=0.01) 0.96 (SE=0.46) 0.001, 0.07 (significant)
≥55 vs 35–40 hours 0.06 (SE=0.01) 1.06 (SE=0.50) 0.004, 0.13 (significant)
n=997. 95% CIs.
LB, lower bound; UB, upper bound.
8 Zadow AJ, et al. BMJ Open 2021;11:e044133. doi:10.1136/bmjopen-2020-044133Open access
BMJ Open: first published as 10.1136/bmjopen-2020-044133 on 23 June 2021. Downloaded from http://bmjopen.bmj.com/ on October 28, 2021 by guest. Protected by copyright.
only. In the final sample, 35.3% reported low PSC levels model 5). As shown, WE is not significantly related to
(≤37). Of the LWHs, 16.5% worked very long hours major depression symptoms. H6, that engagement is
(>55 hours/week) (table 2). related to LWHs, was supported. WE (dichotomous) was
At T1, there were 119 cases (6.6% of 1795) of major significantly positively related to working 49–54 hours
depression symptoms (scores ≥10) among employees (table 6, model 2) and ≥55 hours (table 6, model 3)
working ≥35 hours/week. After removing T1 cases of compared with the reference group (35–40 hours). Since
major depression symptoms there were 37 new cases of LWHs were not related to depression with WE in the
major depression symptoms at T2 (3.4% of 1084). model (table 4, model 6) this implied that WE was not
As shown in table 3, the older the participants, the related to depression via LWHs.
lower the level of major depression symptoms; women We conducted sensitivity analysis excluding those with
were more likely to be depressed, report less income and mild symptoms of depression (PHQ-9 scores between 7
work less hours than men. Income levels were not related and 9) controlling for age, gender and income, and with
to major depression symptoms. Income was positively PSC and WE as continuous measures (see online supple-
related to hours worked, that is, those with more income mental table 2a, model 1). Being in the 41–48 LWH cate-
were working longer hours. PSC was not associated with gory (B=0.96, SE=0.46, p=0.04, lower bound (LB)=0.16,
the demographic measures but was inversely related to upper bound (UB)=0.96) and in the ≥55 hour category
major depression symptoms. Likewise, long hours worked (B=1.06, SE=0.50, p=0.03, LB=0.13, UB=0.92) increased
were positively related to major depression symptoms at the odds of developing major depression symptoms.
both time points but the effects were much smaller. H1 was partly supported for the first time. There were
Table 4 shows the results of the multiple logistic regres- still significant effects for PSC, indicating that low PSC
sion predicting new cases of major depression symptoms. increased the chance of developing major depression
In model 1, we entered the demographics and none were symptoms (B=−0.05, SE=0.02, p=0.04, LB=0.92, UB=0.99).
significant. H1 proposed that LWHs would positively H2 was supported (again). WE was not related to major
relate to new cases of major depressive symptoms. None depression (H5 was not supported again) indicating that
of the LWH categories were related to major depression WE does not mediate the relationship between PSC and
symptoms (table 4, model 2). H1 was not supported. major depression symptoms.
H2 proposed that PSC would be inversely related to new With LWHs as outcomes (see online supplemental
cases of major depression symptoms. As shown in model table 3a, models 1–3), PSC was not related to long hours
3 (table 4), PSC was inversely associated with depression (H3 was not supported again). WE was significantly asso-
(B=−1.15, SE=0.35, pOpen access
BMJ Open: first published as 10.1136/bmjopen-2020-044133 on 23 June 2021. Downloaded from http://bmjopen.bmj.com/ on October 28, 2021 by guest. Protected by copyright.
Figure 4 Work engagement, long working hours and
major depression symptoms. Reference category is 35–40
hours. B, beta coefficient; ns, not significant. #Engagement
dichotomous. †Engagement continuous. φThis model
excluded mild symptoms of major depression (nine-item
Patient Health Questionnaire (PHQ-9) scores 7–9), controls
for psychosocial safety climate (PSC). *pOpen access
BMJ Open: first published as 10.1136/bmjopen-2020-044133 on 23 June 2021. Downloaded from http://bmjopen.bmj.com/ on October 28, 2021 by guest. Protected by copyright.Open access
BMJ Open: first published as 10.1136/bmjopen-2020-044133 on 23 June 2021. Downloaded from http://bmjopen.bmj.com/ on October 28, 2021 by guest. Protected by copyright.
implications for organisations seeking to improve WE. It Data availability statement Data are available in a public, open-access
may be more effective to develop organisational systems repository. The data are stored in the Australian Data Archive (ADA) at the Australian
National University. The website for this resource is ada.edu.au and the email
and climate to protect psychological health (PSC). address is ada@anu.edu.au.
Further research examining the role of WE and LWHs is Supplemental material This content has been supplied by the author(s). It has
recommended. not been vetted by BMJ Publishing Group Limited (BMJ) and may not have been
Change in working life with increasing levels of work peer-reviewed. Any opinions or recommendations discussed are solely those
from home for some groups may make it difficult to of the author(s) and are not endorsed by BMJ. BMJ disclaims all liability and
responsibility arising from any reliance placed on the content. Where the content
clearly define hours of work. For example, employees includes any translated material, BMJ does not warrant the accuracy and reliability
answering emails from home in the evenings or week- of the translations (including but not limited to local regulations, clinical guidelines,
ends may not count these hours as part of their number terminology, drug names and drug dosages), and is not responsible for any error
of hours worked. Disentangling these relationships and and/or omissions arising from translation and adaptation or otherwise.
the boundaries between work and home life, and the role Open access This is an open access article distributed in accordance with the
Creative Commons Attribution Non Commercial (CC BY-NC 4.0) license, which
of unpaid work68 would elucidate these complex rela-
permits others to distribute, remix, adapt, build upon this work non-commercially,
tionships and impact on major depression. The burden and license their derivative works on different terms, provided the original work is
of LWHs for women may interact with or add to the properly cited, appropriate credit is given, any changes made indicated, and the use
demands they face at home.25 68 In this regard, gender is non-commercial. See: http://creativecommons.org/licenses/by-nc/4.0/.
would be a proxy for additional demands people face ORCID iD
outside their work context. Thus, conceptually, home– Amy Jane Zadow http://orcid.org/0000-0002-2440-8962
work interference and work–home interference might
be good candidates for possible moderating effects that
should be investigated in future research. Also, different
time lags could be used; 12 months may be a too short REFERENCES
1 Kessler RC, Aguilar-Gaxiola S, Alonso J, et al. The global burden
time frame within which to expect LWHs to lead to major of mental disorders: an update from the who world mental health
depression symptoms. (WMH) surveys. Epidemiol Psichiatr Soc 2009;18:23–33.
2 Theorell T, Hammarström A, Aronsson G, et al. A systematic review
including meta-analysis of work environment and depressive
Author affiliations symptoms. BMC Public Health 2015;15:738.
1 3 Virtanen M, Jokela M, Madsen IE, et al. Long working hours and
Centre for Workplace Excellence, University of South Australia, Adelaide, South
Australia, Australia depressive symptoms: systematic review and meta-analysis of
2 published studies and unpublished individual participant data. Scand
School of Medicine, Institute of Work, Health and Organisations, University of
J Work Environ Health 2018;44:239–50.
Nottingham, Nottingham, UK 4 Watanabe K, Imamura K, Kawakami N. Working hours and the onset
3
Faculty of Law, Management and Economics, Johannes Gutenberg University of depressive disorder: a systematic review and meta-analysis.
Mainz, Mainz, Germany Occup Environ Med 2016;73:877–84.
4
Department of Environmental and Occupational Health Sciences, State University 5 Lee S, McCann D, Messenger JC. Working time around the world.
International Labour Office Geneva, 2007. Available: http://www.ilo.
of New York Downstate School of Public Health, Brooklyn, New York, USA
org/wcmsp5/groups/public/@dgreports/@dcomm/@publ/documents/
publication/wcms_104895.pdf [Accessed 3 Sep 2019].
Twitter Amy Jane Zadow @zadow_i 6 Rimmer A. Covid-19: junior doctor calls on colleagues to gather
supplies for staff working long hours. BMJ 2020;368:m1072.
Contributors AJZ conceived and designed the study, assisted with the statistical 7 Yang C, Chen Z-L, Chen L-Y, et al. Burnout in healthcare: a sign of
analysis and drafted the manuscript. MFD completed the statistical analysis and death by overwork for doctors in China. BMJ 2019;366:l5582.
substantially assisted with the manuscript draft. CD and PL advised on statistical 8 Herrman H, Kieling C, McGorry P, et al. Reducing the global burden
aspects, data interpretation, and contributed to the manuscript draft. All authors of depression: a Lancet-World psychiatric association Commission.
reviewed the manuscript and approved the final version to be published. All authors Lancet 2019;393:e42–3.
had full access to all the data in the study and take responsibility for the integrity of 9 Ferenchick EK, Ramanuj P, Pincus HA. Depression in primary care:
part 1—screening and diagnosis. BMJ 2019;50:l794.
the data and the accuracy of the data analysis.
10 Patten SB, Williams JVA, Lavorato DH, et al. Why is major depression
Funding This study was supported by three Australian Research Council grants: (1) prevalence not changing? J Affect Disord 2016;190:93–7.
DP087900 Australian Research Council Discovery Grant. Dollard MF, Winefield AH, 11 Nieuwenhuijsen K, Bruinvels D, Frings-Dresen M. Psychosocial
LaMontagne AD, Taylor AW, Bakker AB, Mustard C. Working wounded or engaged? work environment and stress-related disorders, a systematic review.
Occup Med 2010;60:277–86.
Australian work conditions and consequences through the lens of the job demands-
12 Netterstrøm B, Conrad N, Bech P, et al. The relation between work-
resources model. (2) LP100100449 Australian Research Council Linkage Grant. related psychosocial factors and the development of depression.
Dollard MF, Winefield AH, Taylor AW, Smith PM, Nafalski A, Bakker A, Dormann C. Epidemiol Rev 2008;30:118–32.
State, organisational, and team interventions to build psychosocial safety climate 13 Stansfeld S, Candy B. Psychosocial work environment and mental
using the Australian Workplace Barometer and the StressCafé.(3) FL200100025 health--a meta-analytic review. Scand J Work Environ Health
Australian Research Council Laureate Fellowship. Dollard MF. 2006;32:443–62.
14 Bonde JPE. Psychosocial factors at work and risk of depression: a
Disclaimer The research was designed, conducted, analysed and interpreted systematic review of the epidemiological evidence. Occup Environ
entirely by the authors independent of the funding sources. Med 2008;65:438–45.
15 Harvey SB, Modini M, Joyce S, et al. Can work make you
Competing interests None declared. mentally ill? A systematic meta-review of work-related risk
Patient consent for publication Not required. factors for common mental health problems. Occup Environ Med
2017;74:301–10.
Ethics approval Ethics approval was provided by the University of South Australia 16 Siegrist J, Wege N. Adverse psychosocial work environments and
Ethics Committee (ID: P083-08 and 0000020420) and participants gave informed Depression-A narrative review of selected theoretical models. Front
consent before taking part. All participants gave written informed consent before Psychiatry 2020;11:66.
enrolment in the study, which was conducted in accordance with the principles of 17 Karasek RA. Job demands, job decision latitude, and mental strain:
the Australian National Statement on Ethical Conduct in Human Research. implications for job redesign. Adm Sci Q 1979;24:285–308.
18 Siegrist J. Adverse health effects of high-effort/low-reward
Provenance and peer review Not commissioned; externally peer reviewed. conditions. J Occup Health Psychol 1996;1:27–41.
12 Zadow AJ, et al. BMJ Open 2021;11:e044133. doi:10.1136/bmjopen-2020-044133Open access
BMJ Open: first published as 10.1136/bmjopen-2020-044133 on 23 June 2021. Downloaded from http://bmjopen.bmj.com/ on October 28, 2021 by guest. Protected by copyright.
19 Adams JS. Inequity in social exchange. In: Leonard B, ed. Advances labour/employment-and-unemployment/labour-force-australia/latest-
in experimental social psychology. New York, NY: Academic Press, release [Accessed 13 Aug 2020].
1965: 267–99. 42 Dollard MF, Bailey TS. The Australian workplace barometer. Australia:
20 Greenberg JCohen JR, ed. Equity and justice in social behaviour. Australian Academic Press, 2014.
New York: Academic Press, 1982. 43 Härmä M, Ropponen A, Hakola T, et al. Developing register-
21 Milner A, Smith P, LaMontagne AD. Working hours and mental health based measures for assessment of working time patterns
in Australia: evidence from an Australian population-based cohort, for epidemiologic studies. Scand J Work Environ Health
2001-2012. Occup Environ Med 2015;72:573–9. 2015;41:268–79.
22 Rugulies R, Aust B, Madsen IE. Effort-reward imbalance at work 44 Kivimäki M, Jokela M, Nyberg ST, et al. Long working hours and risk
and risk of depressive disorders. A systematic review and meta- of coronary heart disease and stroke: a systematic review and meta-
analysis of prospective cohort studies. Scand J Work Environ Health analysis of published and unpublished data for 603,838 individuals.
2017;43:294–306. Lancet 2015;386:1739–46.
23 Bannai A, Tamakoshi A. The association between long working hours 45 Kivimäki M, Virtanen M, Kawachi I, et al. Long working hours,
and health: a systematic review of epidemiological evidence. Scand socioeconomic status, and the risk of incident type 2 diabetes: a
J Work Environ Health 2014;40:5–18. meta-analysis of published and unpublished data from 222 120
24 Alfredsson L, Spetz CL, Theorell T. Type of occupation and near- individuals. Lancet Diabetes Endocrinol 2015;3:27–34.
future hospitalization for myocardial infarction and some other 46 Rugulies R, Ando E, Ayuso-Mateos JL, et al. WHO/ILO work-related
diagnoses. Int J Epidemiol 1985;14:378–88. burden of disease and injury: protocol for systematic reviews of
25 Virtanen M, Ferrie JE, Singh-Manoux A, et al. Long working hours exposure to long working hours and of the effect of exposure to long
and symptoms of anxiety and depression: a 5-year follow-up of the working hours on depression. Environ Int 2019;125:515–28.
Whitehall II study. Psychol Med 2011;41:::2485–94. 12. 47 Hall GB, Dollard MF, Coward J. Psychosocial safety climate:
26 Kleppa E, Sanne B, Tell GS. Working overtime is associated with development of the PSC-12. Int J Stress Manag 2010;17:353–83.
anxiety and depression: the Hordaland health study. J Occup Environ 48 Schaufeli WB, Bakker AB, Salanova M. The measurement of work
Med 2008;50:658–66. engagement with a short questionnaire: a cross-national study. Educ
27 Dormann C, Owen M, Dollard M, et al. Translating cross-lagged Psychol Meas 2006;66:701–16.
effects into incidence rates and risk ratios: the case of psychosocial 49 Spitzer RL, Kroenke K, Williams JB. Validation and utility of a self-
safety climate and depression. Work Stress 2018;32:248–61. report version of PRIME-MD: the PHQ primary care study. JAMA
28 Bailey TS, Dollard MF, Richards PAM. A national standard for 1999;282:1737–44.
psychosocial safety climate (PSC): PSC 41 as the benchmark for low 50 Levis B, Benedetti A, Thombs BD, et al. Accuracy of patient health
risk of job strain and depressive symptoms. J Occup Health Psychol Questionnaire-9 (PHQ-9) for screening to detect major depression:
2015;20:15–26. individual participant data meta-analysis. BMJ 2019;365:l1476.
29 Dollard MF, Bakker AB. Psychosocial safety climate as a 51 Kroenke K, Spitzer RL, Williams JB. The PHQ-9: validity of a brief
precursor to conducive work environments, psychological health depression severity measure. J Gen Intern Med 2001;16:606–13.
problems, and employee engagement. J Occup Organ Psychol 52 Selig JP, Preacher KJ. Monte Carlo method for assessing mediation:
2010;83:579–99. An interactive tool for creating confidence intervals for indirect
30 Dollard MF. Psychological safety climate: A lead indicator of work effects [Computer software], 2008. Available: http://quantpsy.org/
conditions, workplace psychological health and engagement and medmc/medmc.htm
precursor to intervention success. In: Biron C, Karanika‐Murray M, 53 Preacher KJ, Selig JP. Advantages of Monte Carlo confidence
Cooper CL, eds. Managing psychosocial risks in the workplace: intervals for indirect effects. Commun Methods Meas 2012;6:77–98.
addressing process and context. New York, NY: Routledge 54 Mackinnon DP, Lockwood CM, Williams J. Confidence limits for the
Psychology Press, 2012: 77–101. indirect effect: distribution of the product and resampling methods.
31 Dollard MF, Karasek RA. Building psychosocial safety climate: Multivariate Behav Res 2004;39:99–128.
Evaluation of a socially coordinated PAR risk management stress 55 Loh MY, Idris MA, Dollard MF, et al. Psychosocial safety climate as
prevention study. In: Houdmont J, Leka S, eds. Contemporary a moderator of the moderators: Contextualizing JDR models and
occupational health psychology: global perspectives on research and emotional demands effects. J Occup Organ Psychol 2018;91:620–44.
practice. Chichester, UK: Wiley-Blackwell, 2010: 208–33. https:// 56 Pien L-C, Cheng Y, Cheng W-J. Psychosocial safety climate,
onlinelibrary.wiley.com/doi/abs/ workplace violence and self-rated health: a multi-level study among
32 Law R, Dollard MF, Tuckey MR, et al. Psychosocial safety climate hospital nurses. J Nurs Manag 2019;27:584–91.
as a lead indicator of workplace bullying and harassment, job 57 McLinton SS, Loh MY, Dollard MF, et al. Benchmarking working
resources, psychological health and employee engagement. Accid conditions for health and safety in the frontline healthcare
Anal Prev 2011;43:1782–93. industry: perspectives from Australia and Malaysia. J Adv Nurs
33 Bond SA, Tuckey MR, Dollard MF. Psychosocial safety climate, 2018;74:1851–62.
workplace bullying, and symptoms of posttraumatic stress. Org Dev 58 Bronkhorst B, Vermeeren B, climate S. Worker health and
J2010;28:37–56. organizational health performance. Int J Workplace Health Manag
34 Dollard MF, Tuckey MR, Dormann C. Psychosocial safety climate 2016;9:270–89.
moderates the job demand-resource interaction in predicting 59 Virtanen M, Kivimäki M. Saved by the Bell: does working too
Workgroup distress. Accid Anal Prev 2012;45:694–704. much increase the likelihood of depression? Expert Rev Neurother
35 Shimazu A, Schaufeli WB, Bakker AB, et al. Work engagement: an 2012;12:497–9.
emerging concept in occupational health psychology. Biosci Trends 60 Waldron I, Herold J, Dunn D. Reciprocal effects of health and labor
2008;2:187–200. force participation among woman: evidence from two longitudinal
36 Bakker AB, Leiter MP. Work engagement: Introduction. In: Bakker studies. J Occup Med 1982;24:295–310.
AB, Leiter MP, eds. Work engagement: a Handbook of essential 61 Evans-Lacko S, Knapp M. Importance of social and cultural
theory and research. New York: Taylor & Francis, 2010: 1–10. factors for attitudes, disclosure and time off work for depression:
37 Burke RJ. Workaholism in organizations: concepts, results and future findings from a seven country European study on depression in the
research directions. Int J Manag Rev 2000;2:1–16. workplace. PLoS One 2014;9:e91053.
38 Schaufeli WB, Taris TW, van Rhenen W. Workaholism, burnout, 62 Ganster DC, Rosen CC, Fisher GG. Long working hours and well-
and work engagement: three of a kind or three different kinds of being: what we know, what we do not know, and what we need to
employee well-being? Appl Psychol 2008;57:173–203. know. J Bus Psychol 2018;33:25–39.
39 Taris TW, Schaufeli WB, Shimazu A. The push and pull of work: The 63 Kim I, Kim H, Lim S, et al. Working hours and depressive
differences betwen workaholism and work engagement. In: Bakker symptomatology among full-time employees: results from the fourth
AB, Leiter MP, eds. Work engagement: a Handbook of essential Korean National health and nutrition examination survey (2007-2009).
theory and research. New York: Taylor & Francis, 2010: 39–54. Scand J Work Environ Health 2013;39:515–20.
40 Australian Bureau of Statistics. Part-Time refers to all employed 64 Albrecht SC, Kecklund G, Rajaleid K, et al. The longitudinal
persons who usually worked less than 35 hours a week and either relationship between control over working hours and depressive
did so during the reference week or did not work that week, Jul 2020, symptoms: results from SLOSH, a population-based cohort study. J
cat. No. 6202.0. Available: http://www.abs.gov.au/ausstats/abs@.nsf/ Affect Disord 2017;215:143–51.
mf/6202.0 [Accessed 13 Aug 2020]. 65 Summerfield M, Bevitt A, Freidin S. HILDA user manual – release
41 Australian Bureau of Statistics. Labour force, Australia Headline 16. Melbourne: Institute of Applied Economic and Social Research
estimates of employment, unemployment, underemployment, University of Melbourne, 2017. https://melbourneinstitute.unimelb.
participation and hours worked from the monthly labour force survey edu.au/__data/assets/pdf_file/0006/2597865/HILDA-User-Manual-
16 November 2020. Available: https://www.abs.gov.au/statistics/ Release-16.0_LATEST.pdf
Zadow AJ, et al. BMJ Open 2021;11:e044133. doi:10.1136/bmjopen-2020-044133 13Open access
BMJ Open: first published as 10.1136/bmjopen-2020-044133 on 23 June 2021. Downloaded from http://bmjopen.bmj.com/ on October 28, 2021 by guest. Protected by copyright.
66 Amagasa T, Nakayama T. Relationship between long working hours 68 Peristera P, Westerlund H, Magnusson Hanson LL. Paid and unpaid
and depression in two working populations: a structural equation working hours among Swedish men and women in relation to
model approach. J Occup Environ Med 2013;54:868–74. depressive symptom trajectories: results from four waves of the
67 Guthier C, Dormann C, Voelkle MC. Reciprocal effects between Swedish longitudinal occupational survey of health. BMJ Open
job stressors and burnout: a continuous time meta-analysis of 2018;8:e17525.
longitudinal studies. Psychol Bull 2020;146:1146–73.
14 Zadow AJ, et al. BMJ Open 2021;11:e044133. doi:10.1136/bmjopen-2020-044133You can also read