Potlatch Corporation Eric J. Cremers - President & Chief Operating Officer
←
→
Page content transcription
If your browser does not render page correctly, please read the page content below
Potlatch Corporation   Eric J. Cremers
                       President & Chief Operating Officer

                                                         September 2013
Forward-Looking Statement
                  Forward‐Looking Statements

This presentation contains certain forward-looking statements within the meaning of the Private Litigation Reform Act of 1995 as amended,
including without limitation, statements about future company performance, the company’s business model, strength of the company’s balance
sheet and credit metrics, dividend levels and yields, direction of markets and the economy, regional softwood nominal price trend, long term trend
of higher sawlog prices, Southern sawlog prices, Pacific Northwest sawlog prices, pulpwood prices, impact of Chinese demand for wood products
on sawlog pricing, impact of pellet plant additions on pulpwood pricing, management of timberlands to optimize values, Southern sawlog
inventories, estimated 2013 harvest levels, future harvest levels and their relation to market trends, forecast of inventory of available live and dead
lodgepole pine in B.C., impact of the pine beetle on North American lumber supply, forecasts of North American exports of lumber to China,
forecast of U.S. housing starts, the company’s capital structure, weighted average cost of debt, real estate business potential and land
development potential, real estate value opportunities, biomass opportunities, forecasts of estimated wood use by announced facilities in the U.S.,
management of the output of our Wood Products facilities, increase of lumber and panel prices along with housing recovery, North American
lumber operating rates and capacity, forecast Canadian lumber production, debt repayment, cashflow, estimated 2013 funds available for
distribution, dividend policy and dividends, global wood pellet consumption outlook, new and existing home inventory and months supply, U.S.
lumber consumption and similar matters. These forward-looking statements are based on current expectations, estimates, assumptions and
projections that are subject to change, and actual results may differ materially from the forward-looking statements. Factors that could cause
actual results to differ materially include, but are not limited to, changes in timberland values; changes in timber harvest levels on the company’s
lands; changes in timber prices; changes in policy regarding governmental timber sales; changes in the United States and international
economies; changes in the level of domestic construction activity; changes in international tariffs, quotas and trade agreements involving wood
products; changes in domestic and international demand for wood products; changes in production and production capacity in the forest products
industry; competitive pricing pressures for the company’s products; unanticipated manufacturing disruptions; changes in general and industry-
specific environmental laws and regulations; unforeseen environmental liabilities or expenditures; weather conditions; changes in fuel and energy
costs; changes in raw material and other costs; the ability to satisfy complex rules in order to remain qualified as a REIT; changes in tax laws that
could reduce the benefits associated with REIT status; and other risks and uncertainties described from time to time in the company’s public
filings with the Securities and Exchange Commission. All forward-looking statements are made as of the date of this presentation, and the
company does not undertake to update any forward-looking statements.
                                                                                                                                                          2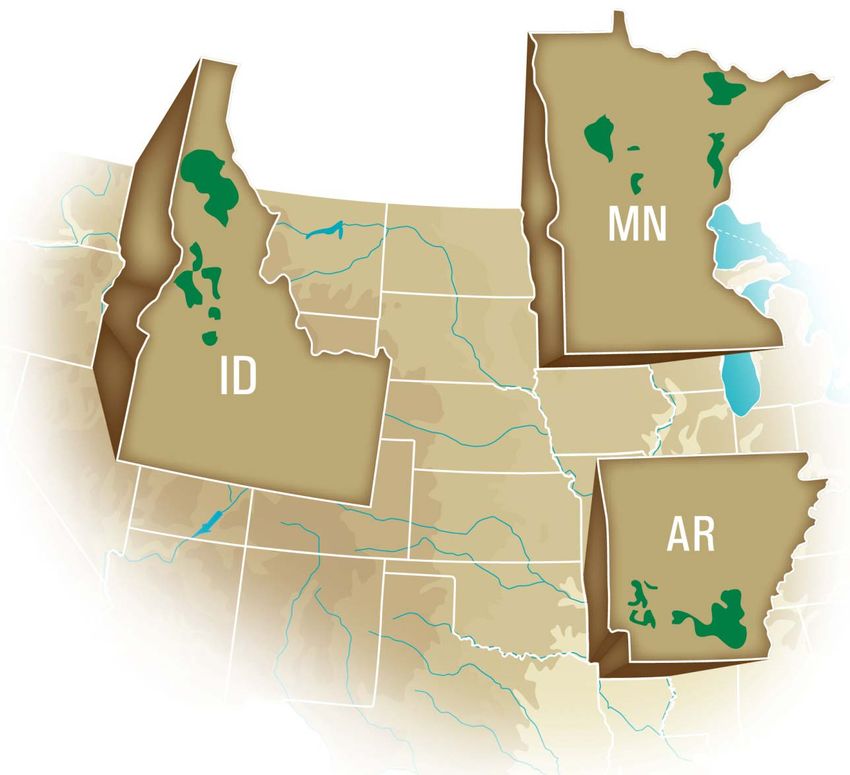
Company Overview
Converted to tax efficient REIT in 2006
Single level of taxation
Potlatch
Corporation Lower cost of capital
(REIT)
Fourth largest U.S. Timber REIT
~1.4 million acres of owned timberland
High margin, low risk real estate business
Five wood products manufacturing facilities
Resource Taxable REIT
(Timberlands) Subsidiaries Enterprise value of $2.1 billion(1)
Market cap of ~$1.8 billion
Net debt(2) of ~$0.3 billion
Strong balance sheet with solid credit metrics
LSD PPD Real CPD Wood
North South
Estate Products
Attractive dividend at $1.24 per share, yielding 3.1%(1)
(1) Based on August 28, 2013 closing stock price of $39.59 per share.
(2) We define net debt as the total of short-term and long-term debt less cash and short-term investments, see reconciliation on page 29.
3
Potlatch Business Overview
            Potlatch owns approximately 1.4 million acres of FSC-certified timberland in
          Arkansas, Idaho and Minnesota and five wood products manufacturing facilities.

Timberlands(1)

Idaho:                    806,000 acres
Arkansas:                 406,000 acres
Minnesota:                203,000 acres
Total:                 1,415,000 acres
 (1)   As of June 30, 2013, excludes 1,000 acres in Wisconsin.                             4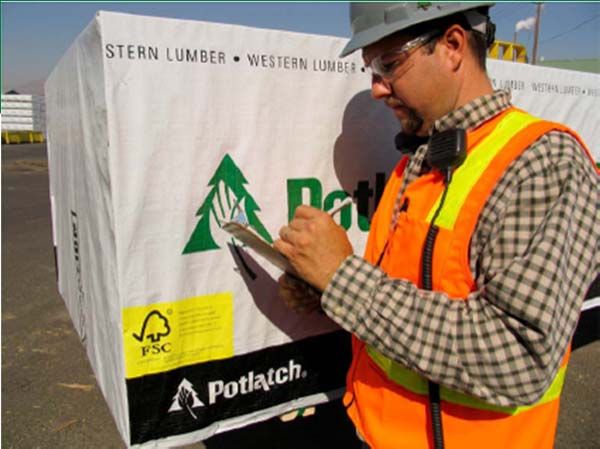
Potlatch Business Overview
Potlatch produces about 650 million board feet of lumber and 160 million square feet
                    of plywood at five manufacturing facilities.

                                                                     Wood Products
                                                                     Manufacturing Facilities

                                                                                                5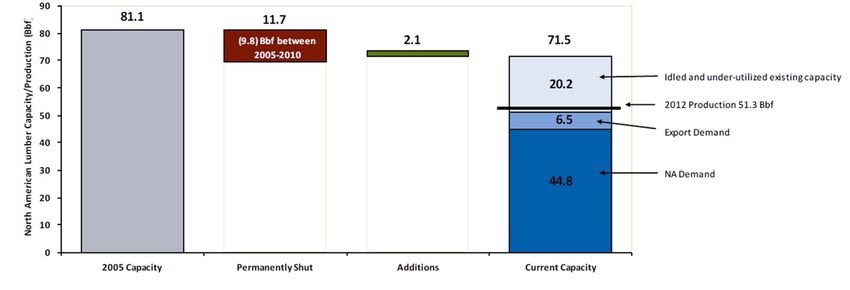
Potlatch Financial Overview
    ($ in millions)

                                                                                                                                                   Wood
                                                 Resource                                       Real Estate
                                                                                                                                                  Products

2012 Segment Revenues(1)                            $208                                               $38                                               $329
2012 Segment EBITDDA(2)                              $66                                               $34                                               $52
Segment EBITDDA Margin(3)                           31.7%                                            89.5%                                               15.8%

                                                       Historical Consolidated Revenue and EBITDDA(1)(2)

                              $800         $607                                                                                                                $624
                                                             $575                                  $585               $549               $575
                              $600                                              $516

                              $400
                                                $102               $107               $131              $151               $110               $114                $142
                              $200
                                 $0
                                             2007               2008               2009               2010              2011               2012             2013 LTM *
                                                                                         Revenue      EBITDDA

 * As of June 30, 2013.
 (1) Segment revenues and historical consolidated revenues presented prior to intersegment eliminations.
 (2) See page 38 of this presentation for definitions of EBITDDA and segment EBITDDA and page 28 for reconciliations to most comparable GAAP measures.                   6
 (3) Segment EBITDDA Margin is defined as Segment EBITDDA divided by Segment Revenues.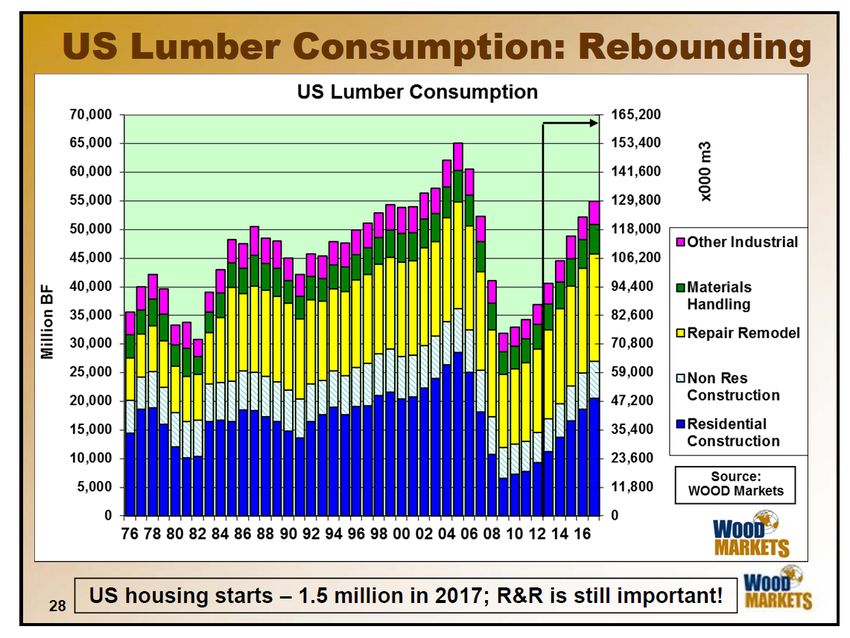
Total Housing Starts
      (in thousands)

                        Housing starts are presently far below the long-term average.

2,500
                                                                                                                                      Actual(1) Forecast(2)

                                                                                 Average Starts Since 1971:
2,000                                                                                   1.5 million

1,500

1,000

 500

      0
            71     73      75      77     79      81      83      85        87    89   91    93    95   97   99   01   03   05   07   09   11 13F 14F
                                                                                            Year
 (1) Source: U.S. Census Bureau.                                                                                                                        7
 (2) Forecast based on average of 8 different economic forecasting firms.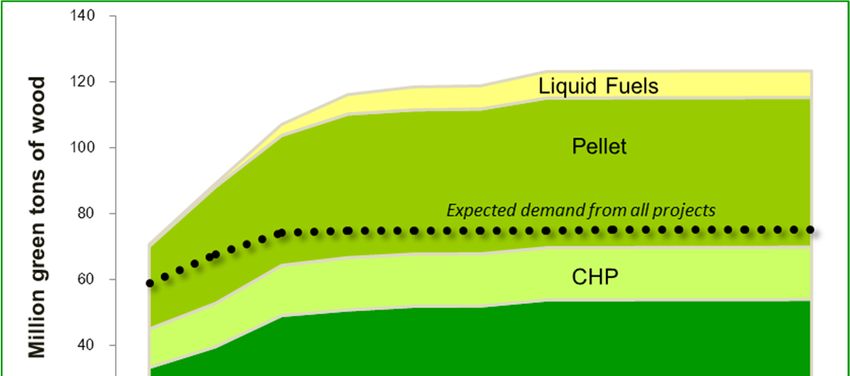
Regional Softwood Nominal Price Trends
$/Ton
$120 Sawlog South - Stumpage The price of sawlogs, in
PNW WS DF - Delivered
conjunction with harvest
Pulpwood South - Stumpage
volume, drives our revenue
$100 stream
Long-term trend line is for
higher sawlog prices
$80
Recent weakness in Southern
sawlog prices driven by
$60 depressed housing starts
Recent strength in Pacific
$40 Northwest sawlog prices
driven by Chinese demand
Pulpwood prices relatively flat
$20
over time, but pellet plant
additions should ultimately put
$0
upward pressure on prices
1977 1979 1981 1983 1986 1988 1990 1992 1995 1997 1999 2001 2004 2006 2008 2010 2013
8
Source: Timber Mart-South, Oregon Department of Forestry, and Potlatch estimates.
Sawlog Inventories in the South
In the South, plantation investments have improved inventory growth rates.
U.S. South Private Operable Softwood Sawtimber Inventory
In the U.S. South, the lumber industry expanded dramatically during the 1980’s and 1990’s
putting pressure on the softwood resource
Increased productivity from intensive silvicultural investments began to stabilize the
softwood inventory in the early 2000’s 9
Source: Hancock Timber Resource Group & RISI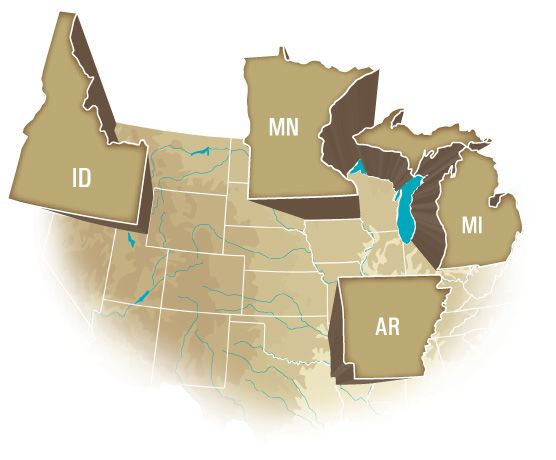
Potlatch Has An Attractive Timber Inventory & Harvest Profile
Potlatch’s focus has been on its timber
resource base since conversion to a REIT in Potlatch Fee Harvest Log Volume
Tons in millions
2006
5.0
Sawlogs Pulpwood
Active management and timberland 4.4
diversification to maximize value of the 4.2 4.1
4.0 3.9
resource base 3.8 3.7
3.6
Geographic diversity 3.3
Species diversity
End-use market diversity 3.0
Attractive distribution of timber across age-
classes 2.0
Flexibility to monetize sawlog or pulpwood
harvests
We have the flexibility to increase or decrease 1.0
harvest volume to meet market conditions
2012 harvest volume lowered to 3.6 million
tons to preserve net asset value 0.0
2006 2007 2008 2009 2010 2011 2012 2013F
Southern log prices remain weak and additional
harvest deferrals may preserve value for our
shareholders
10Attractive Inventory & Harvest Profile
Potlatch Sawlog Harvest
Fee Harvest Sawlog Volume Sawlog Prices
(tons in millions) ($/ton)
$80
3.5 $80
$73
Potlatch’s Resource cash flows are
$72 3.0 highly dependent on its sawlog
$70 3.0
2.9 $67 $70 harvest volume and pricing
3.0
2.8 $63 2.7
$60 Northern region sawlog prices have
2.4 2.5 $60
2.5 $53
been improving, influenced by
2.2 Chinese demand in the Pacific
$50 Northwest
2.0
However, sawlog prices remain
$40
depressed in the South
1.5
$30 We have the flexibility to increase our
harvest when market conditions
1.0 improve
$20
0.5
$10
0.0 $0
2006 2007 2008 2009 2010 2011 2012 2013F
11Inventory of Available Live and Dead Lodgepole Pine in BC
By Years since Attack, 1999-2020
BC’s timber inventory continues to decay.
Million m3
1600
Forecast
1400
1200
1000
800
600
400
200
0
99 00 01 02 03 04 05 06 07 08 09 10 11 12 13 14 15 16 17 18 19 20
Live 12 yrs
12
Source: FEA September 2012 PresentationNorth American Exports of Lumber to China
Softwood Lumber Exports to China (% of Total Demand on North America Mills)
North America Lumber Lumber Exports to
Exports to China China as % of North
(Billion Board Feet) American Demand
Actual Forecast
7 NA Lumber Exports to China 12%
% of Demand on NA Mills
6 10%
5
8%
4
6%
3
4%
2
1 2%
0 0%
2006 2007 2008 2009 2010 2011 2012 2013 F 2014 F
13
Source: RISI North American Demand & FEA (Export to China).Estimated Wood Use by Announced Facilities in the U.S. (Million Green Tons) Source: Forisk Consulting 14 Note: Expected demand is estimated wood use by all projects that pass the technology and status screens.
Historic Lumber & Panel Prices

                       Both the lumber and panel prices have been increasing along with
                                            the housing recovery.
     $550

     $500

     $450

     $400

     $350

     $300

     $250

     $200

     $150
         Jan-06       Sep-06      May-07    Jan-08   Sep-08   May-09   Jan-10   Sep-10   May-11     Jan-12   Sep-12   May-13
                                           RL Panel Composite $/MSF     RL Lumber Composite $/MBF

Source: Random Lengths – August 2013.                                                                                          15
North American Lumber Operating Rates and Average Annual Prices
(U.S.$)
2013E
2012
North American Wood Products Industry Capacity Utilization (%)
16
Source: RBC Capital MarketsWood Products Segment
Five manufacturing facilities, lumber and plywood
Sell to wholesalers for use in homebuilding and construction
Potlatch operates four sawmills in Idaho, Arkansas, Minnesota and Michigan as
well as one industrial-grade plywood mill in Idaho
Maximizing production gives attractive operating environment
Weak US$ versus CAD$ is beneficial to this segment
Wood Products Segment EBITDDA(1)
$ in millions
$80 $73
$60 $52
$41
$40 $13 $14 $15 $15
$20
$0
-$20 ($4) ($11)(3)
(2)
2005 2006 2007 2008 2009 2010 2011 2012 2013 *
LTM
* As of June 30, 2013.
(1) See page 38 of this presentation for the definition of segment EBITDDA and page 28 for reconciliation to most comparable GAAP measures. 17
(2) Wood Products EBITDDA excludes $31 million for Canadian lumber settlement.
(3) Wood Products EBITDDA includes asset impairment charge of $3 million.Real Estate Overview
Frequently assess acreage to maximize Land Portfolio
Core Timberland
value through sale of non-core timberland ~1.2 million acres
Non-Strategic Timberland
~15,000 acres
real estate Rural Real Estate
~95,000 acres
More than 3,000 miles of desirable water
HBU/Development
frontage ~125,000 acres
More than 9 million people live within three
states of ownership
Idaho: 806,000 acres Arkansas: 406,000 acres Minnesota: 203,000 acres
Coeur d’Alene
Little Rock Brainerd
McCall
Hot Springs
Minneapolis
Boise Sun Valley St. Paul
Potlatch Timberlands(1)
(1) As of June 30, 2013, excludes 1,000 acres in Wisconsin. 18Real Estate Values Are Unique to Each Category
CONSERVATION NON-STRATEGIC RURAL REAL HIGHER-BETTER-USE
EASEMENT TIMBERLAND ESTATE DEVELOPMENT
$400 to $1,000 per acre $500 to $1,500 per acre $1,000 to $1,500 per acre $2,000 to $7,000 per acre
120,000
Opportunity dependent 10,000 to 20,000 acres 80,000 to 90,000 acres 110,000 to 120,000 acres
Characteristics: Characteristics: Characteristics: Characteristics:
- Habitat related - Fringe of ownership - Fringe of ownership - Property attribute focus
- Appropriate payment for - Location disadvantage - Opportunity varies by - Investor interest
opportunity sold - Higher operation cost geographic market - Explore proper land use
- Selective core lands - Recreation character and entitlements
- Capital allocation focus
and amenities - Emerging development
- Adjacent ownership focus
influence
LOWER VALUE HIGHER VALUE
OPPORTUNITIES OPPORTUNITIES
19Significant Real Estate Portfolio
Realization of Non-Core Timberland Asset Values
$ in millions $/Acre Price Per Acre
$3,868
$90 Segment Revenue
$4,500
$85.2
$2,969
$4,000
5.9
$2,639
$2,598
$80 $3,500
$2,329
$3,000
$2,054
$2,007
9.2
$1,527
$2,500
$1,312
$1,434
$70
$1,259
$1,345
$1,218
$1,182
$1,248
$65.4
$1,229
$1,108
$2,000
1.2
$752
$1,500
$745
$711
$60 5.6
$379
$1,000
12.5 $50.0 $500
$50 $46.1 $0
5.4 2007 2008 2009 2010 2011 2012 2013*
LTM
$40 9.3 $38.3
12.4 $31.8
70.1
Acres
$30 Acres Sold
$24.1 20.5 21.0 120,000
46.1 15.0 104,737
$20 7.9 100,000
32.2
80,000
$10 14.3 13.7 60,669
16.2 16.3 60,000
44,786
36,458
$0 3.0 3.1 40,000
22,944
(1) 16,175 18,491
2007 2008 2009 2010 2011 2012 2013* 20,000
LTM 0
Conservation Easement HBU/Development (2)
2007 2008 2009 2010 2011 2012 2013*
Rural Real Estate Non-Strategic Timberland
LTM
* As of June 30, 2013. 20
(1) Segment Revenue in 2008 excludes sale of building.
(2) Excludes the sale of the Boardman, Oregon tree farm of 17,000 acres.Potlatch Timberland Holdings Changes
Acres (000’s)
1,800
(1)
1,700 218 (33) 36 (61)
1,653
1,628 (45)
1,600 1,583 (105)
1,500 1,471 (3) 1,468 1,478 (37)
1,441 7 (24)
1,424 (8) 1,416(2)
1,400
1,300
1,200
1,100
1,000
2005 2006 2007 2008 2009 2010 2011 2012 2013*
PCH Owned Acreage at End of Period PCH Acquired Acreage During the Year PCH Sold Acreage During the Year
* As of June 30, 2013. 21
(1) Includes the sale of the Boardman, Oregon tree farm of 17,000 acres.
(2) Acreage through June 30, 2012, includes 1,000 acres from Wisconsin.Balance Sheet Review
June 30, 2013 Conservative capital structure
($ in millions) Actual Covenant
Key credit statistics 6/30/2013 Requirements
ASSETS Net debt to enterprise value 14.3% N/A
Cash and short-term investments $ 50 Interest coverage ratio 5.90x 3.00x
Other current assets 70 Timberland coverage ratio 5.97x 3.00x
Leverage ratio 2.20x 5.00x
Long-term assets 577
Total assets $ 697
Undrawn $250 million revolver
LIABILITIES & EQUITY 6.6% weighted average cost of debt
Current liabilities $ 59
Long-term debt 320 Rated Baa3 by Moody’s, BB+ by S&P
Other liabilities 163
Total liabilities 542 Fixed Debt: $273 million or 85%
Equity 155 Floating-Rate Debt: $47 million or 15%
Total liabilities & equity $ 697
Note: We define net debt as the total of short-term and long-term debt less cash and short-term investments, see page 29 for reconciliation. The Minimum Interest Coverage Ratio is our
twelve months ended EBITDDA divided by interest expense for the same period. See page 38 of this presentation for the definition of EBITDDA and page 28 for reconciliation to
most comparable GAAP measures. 22Conservative Capital Structure: Long-Term Debt Maturity Profile
($ in millions)
Mandatory principal repayments of only $39 million from 2013-2017
$200
$150
$150
$100
$66
$50 $42
$23
$11 $14
$5 $6 $3
$0 $0 $0 $0 $0
$0
2013 2014 2015 2016 2017 2018 2019 2020 2021 2022 2023 2024 2025 2026
23Strong Cash Flow Generation
($ in millions)
Total EBITDDA(1) Segment EBITDDA(1)
$160 Resource
$151
$120 $97 $95 $105 $83 $82
$142 $77 $66
$80
$140 $40
$131
$0
2007 2008 2009 2010 2011 2012 2013*
$120 $114 LTM
$107 $110
$102
$100
Real Estate
$120
$80 $80 $41 $60 $79 $46
$40 $21 $34 $27
$0
$60 2007 2008 2009 2010 2011 2012 2013*
LTM
$40
Wood Products
$120
$80 $73
$20 $52
$40 $14 $15 $15
$0
-$40 ($4) ($11)
$0 (2)
2007 2008 2009(2) 2010 2011 2012 2013* 2007 2008 2009 2010 2011 2012 2013*
LTM LTM
* As of June 30, 2013.
(1) See page 38 of this presentation for the definition of EBITDDA and Segment EBITDDA and page 28 for a reconciliation to most comparable GAAP measures.
24
(2) Consolidated and Wood Products EBITDDA includes a $3 million asset impairment charge.Funds Available for Distribution (FAD)
($ in millions)
$120
$111
$105
$100
$92
$85
$81 $81 $82
$80 $77
$74 $74
$64
$60
$53
$50 $50
$40
$20
$0
(1)
2007 2008 2009 2010 2011 2012 2013
FAD Dividend Distribution
LTM
(1) As of June 30, 2013.
Note: See page 38 of this presentation for the definition of FAD and see page 29 for a reconciliation to most comparable GAAP measures. Excludes dividend distribution of 25
Clearwater Paper stock in 2008.Conclusion
Potlatch maintains a very attractive asset base of ~1.4 million acres of timberland
Our Resource segment has the potential to generate more cash flow
We have deferred harvest volumes to preserve and enhance NAV
We have the ability to expand high margin sawlog harvest levels
Wood Products business is generating solid cash flow
Industry supply appears to be struggling to keep up with increased demand
Real Estate segment has low risk, high margin attributes
Attractive dividend
Strong balance sheet with attractive debt cost and maturity profile
Long-term industry trends are very favorable
Housing starts on solid recovery path
Exports to China from North America should remain robust
Pine beetle in B.C. and lower AAC in eastern provinces will lower supply from Canada
Biomass continues to hold promise
26Appendix
EBITDDA and Segment EBITDDA Reconciliation
      ($ in millions)
                                                                                                           Fiscal Year

                                                                            2007              2008     2009(1)      2010            2011         2012      2013 LTM

Consolidated
Net income                                                                 $     74      $       73    $    81     $     40     $      40    $      43     $    67
Less:
               Income tax benefit (provision)                                    17              25         16            (5)          (4)          (17)        (20)
Add:
           Net cash interest expense                                             15              20         20            26           25           23           23
           Depreciation, depletion, and amortization                             26              30         35            31           29           26           27
           Basis of real estate sold                                              4               9         11            49           14            5            5
           Non-cash asset impairment and eliminations                             -               -          -             -           (2)           -            -
Consolidated EBITDDA                                                       $    102      $      107    $   131     $     151    $     110    $     114     $   142

Resource
Operating income                                                           $     82      $       76    $    82     $     62     $      60    $      50     $    64
Depreciation, depletion, and amortization                                        15              19         23           21            17           16          18
Resource Segment EBITDDA                                                   $     97      $       95    $   105     $     83     $      77    $      66     $    82

Real Estate
Operating income                                                           $     17      $       32    $    49     $     30     $      31    $      28     $    22
Basis of real estate sold                                                         4               9         11           49            14            6           5
Depreciation                                                                      -               -          -            -             1            -           -
Real Estate Segment EBITDDA                                                $     21      $       41    $    60     $     79     $      46    $      34     $    27

Wood Products
Operating income (loss)                                                    $      4      $      (14)   $   (21)    $      7     $       7    $      45     $    67
Depreciation                                                                     10              10         10            8             8            7           6
Wood Products Segment EBITDDA                                              $     14      $       (4)   $   (11)    $     15     $      15    $      52     $    73
                                                                                                                                                                       28
(1)   Consolidated and Wood Products EBITDDA includes a $3 million asset impairment charge.
Potlatch Net Debt & FAD Reconciliations
($ in millions)
Net Debt At December 31 At June 30
($ in millions) 2008 2009 2010 2011 2012 2013
Long-term debt $ 221 $ 368 $ 363 $ 345 $ 349 $ 320
Current installments on long-term debt 101 - 5 22 8 -
Current notes payable 129 - - - - -
Cash (1) (2) (6) (8) (17) (6)
Short-term investments (3) (53) (85) (63) (63) (44)
Net Debt $ 447 $ 313 $ 277 $ 296 $ 277 $ 270
FAD Calculation Fiscal Year At June 30
($ in millions) 2008 2009 2010 2011 2012 2013 LTM
Operating income (loss):
Resource $ 76 $ 82 $ 62 $ 60 $ 50 $ 64
Real Estate 32 49 30 31 28 22
Wood Products (14) (21) 7 7 45 67
Eliminations and adjustments (1) 8 2 2 (1) (1)
93 118 101 100 122 152
Corporate administration (25) (33) (30) (30) (39) (40)
Net cash interest expense (20) (20) (26) (26) (23) (23)
Environmental Remediation Charge - - - - - (2)
Income tax benefit (provision) 25 16 (5) (4) (17) (20)
Net income 73 81 40 40 43 67
Depreciation, depletion and amortization 30 35 31 29 26 27
Basis of real estate sold 9 11 49 14 5 5
Capital expenditures (20) (16) (15) (17) (21) (25)
Non-cash asset impairment & eliminations - - - (2) - -
Funds Available for Distribution $ 92 $ 111 $ 105 $ 64 $ 53 $ 74
Distributions to Common Stockholders (1) $ 81 $ 81 $ 82 $ 74 $ 50 $ 50
29
(1) Excludes distribution of Clearwater Paper stock in 2008.Potlatch Sawlog and Pulpwood
Pricing in the Northern and Southern Regions (Delivered)
SAWLOG PULPWOOD
$/ton $/ton
North South North South
$100 $50
$80 $40
$60 $30
$40 $20
$20 $10
$0 $0
Q1 Q3 Q1 Q3 Q1 Q3 Q1 Q3 Q1 Q3 Q1 Q3 Q1 Q1 Q3 Q1 Q3 Q1 Q3 Q1 Q3 Q1 Q3 Q1 Q3 Q1
2007 2008 2009 2010 2011 2012 2013 2007 2008 2009 2010 2011 2012 2013
30North American Lumber Industry Operated at 72% of Capacity in 2012*
Source: RBC Capital Markets
*This information comes from RBC and Potlatch makes no representation as to its accuracy.
31Lumber Capacity Changes Announced for 2013-2014
Company Location Capacity Timing
(million bf)
Dubreuil Lumber Dubreuilville, ON Canada 100? 2013?
Eacom Timber Timmins, ON Canada 112 Q3 2013, C$25 mm rebuild after fire
Kenora F.P. Kenora, ON Canada 80 2013
Longlac Lumber Longlac, ON Canada 100? Q3 2013?
McKenzie Lumber Inc. Hudson, ON Canada 200? Q1 2013
Paper Excellence Scotsburn, NS Canada 100 Q1 2013 running full (restarted in 2012)
Resolute F.P. Ignace, ON Canada 75? 2014, C$32mm upgrade
Resolute F.P. Comtois, QC Canada Q2 2013, C$9 mm upgrade
Resolute F.P. Senneterre QC Canada Q2 2013, C$2 mm upgrade
Resolute F.P. Thunder Bay, ON Canada 75? Q1 2013, adding 3rd shift
Resolute F.P. Atikokan, ON Canada 150 Construction Q2 2013, start-up early 2014
White River Forest Products White River, ON Canada 110 Q3-Q4, 2013
Canfor Elko, BC Canada 40 Q3 2013, C$40 mm upgrade
Canfor Mackenzie, BC Canada 80-90 Q4 2013, C$40 mm upgrade
Carrier Lumber Big River, SK Canada 250? 2013-2014 unconfirmed
Hampton Affliates Burns Lake, BC Canada 200-230 2014, rebuild after fire
Lakeside Prince George, BC Canada 180? 2014, rebuild after fire
Spray Lake Sawmills Cochrane, AB Canada 75-100? Q4 2013, adding 2nd shift
West Chilcotin F.P. Ulkatcho, BC Canada 115? Q1 2013
West Fraser Chetwynd, BC Canada 100 2013 Phase 2, $35 mm
West Fraser Edson, AB Canada 180 Q4 2013, rebuild of sawmill and new planer
Weyerhaeuser Drayton, AB Canada 70 Q3 2014 C$23mm upgrade, 35% increase
Plum Creek Evergreen, MT U.S. 40 Q2 2013, one shift
Vaagen Brothers (4 Corner) Eager, AZ U.S. 110? late 2012, full ramp-up May 2013
Saratoga FP Saratoga, WY U.S. Q1 2013
Lewis County Lumber Winlock, WA U.S. 45 Expects to produce green Fir studs
Umpqua Lumber Riddle, OR U.S. 70-75 Started up Q4/12, produces studs
Seneca Eugene, OR U.S. Hiring as 2013
Swanson Eugene, OR U.S. Hiring as 2013, running at 75% of capacity
Canfor Darlington, SC U.S. 30-40 2013 $3.6 mm for kilns
Franklin Lumber Franklin, VA U.S. 60 Q4, 2013 - one shift
Hankins Lumber Grenada, MS U.S. 115 Q2 2013
Interfor Thomaston, GA U.S. 80 2014? doubling capacity by adding kilns
Klausner Lumber One Enfield, NC U.S. 350-550 2014 est.
Klausner Lumber Two Suwannne County, FL U.S. 350-550 2014 est.
Klausner Lumber Three? SC U.S. Possibly a third mill, but likely after others
Idaho Timber Coushatta, LA U.S. 100 Q3 2013, idled 2008 by Hood Industries
Southern Parallel F.P. Albertville, AL U.S. 100 Q2 2013
West Fraser McDavid, FL U.S. 100 Q4 2013, one shift basis, $10-$15mm restart
North America 2013 ……… 2300-2500 million board feet
2014 ……… 1600-1900 million board feet 32
Source: ERA Forest Products Monthly, January 2013 Total Incremental Additions ……… 3900-4400 million board feetCanadian Lumber Production Outlook
British Columbia Lumber Production Will Not There is Some Room for Growth in Ontario and
Add Much to Total North American Supply Quebec Output
Forecast Forecast
Source: FEA, September 2012 33Global Wood Pellet Consumption Outlook to 2020 Source: Wood Markets, February 2013, Wood Pellet Association of Canada 34
35
Source: ERA Forest Products Overview, July 2013
New & Existing Home Inventory & Months Supply

 New Home Inventory & Months Supply                                                 Existing Home Inventory & Months of Supply
Thousands of Homes                                                        Months Million                                               Months
For Sale at month-end                                                     Supply Homes                                                 Supply
  500                                   New Home Inventory                     13    4.1                                                   13.0
                                                                                                                           2 million was
                                        Months Supply of New Homes             12    3.9
  450                                                                                                                     average before   12.0
                                                                               11    3.7                                    the housing
  400                                                                          10
                                                                                     3.5                                  boom and bust.   11.0
                                                                                     3.3                                                   10.0
  350                                                                          9
                                                                                     3.1
                                                                               8     2.9                                                   9.0
  300
                                                                               7     2.7                                                   8.0
  250                                                                          6     2.5
                                                                                     2.3                                                   7.0
  200                                                                          5
                                                                                     2.1                                                   6.0
                                                                               4                Existing Home Inventory
  150                                                                                1.9
                                                                                                                                           5.0
                                                                               3                Months Supply
                                                                                     1.7
  100                                                                          2     1.5                                                   4.0
        2008       2009           2010           2011           2012    2013            2008   2009   2010      2011       2012     2013

   Source: APA, Housing Starts April 2013, release date May 16, 2013.
                                                                                                                                           36
U.S. Lumber Consumption: Rebounding
Source: Wood Markets
37Definitions of Non-GAAP Measures
EBITDDA is a non-GAAP measure that management uses to evaluate the cash generating capacity of the company. EBITDDA, as we
define it, is net income (loss) adjusted for net cash interest expense, provision (benefit) for income taxes, depreciation, depletion and
amortization, basis of real estate sold and non-cash asset impairment and eliminations.
Funds Available for Distribution (FAD), as we define it, is net income (loss) adjusted for depreciation, depletion and amortization, basis of
real estate sold, non-cash asset impairment and eliminations and capital expenditures. For purposes of this definition, capital expenditures
exclude all expenditures relating to direct or indirect timberland purchases in excess of $5 million.
Segment EBITDDA from continuing operations, as we define it, is segment operating income (loss) adjusted for depreciation, depletion,
amortization and the basis of real estate sold.
38You can also read