Sphera Franchise Group Investor & Analyst Call - H1 2022 Results 30.08.2022
←
→
Page content transcription
If your browser does not render page correctly, please read the page content below
Sphera Franchise Group
Investor & Analyst Call

H1 2022 Results
30.08.2022
Disclaimer
      This presentation is not, and nothing in it should be construed as, an offer, invitation or recommendation in respect of shares issued by Sphera Franchise Group SA
      ("Sphera"), or an offer, invitation or recommendation to sell, or a solicitation of an offer to buy shares in Sphera.

      Neither this presentation nor anything in it shall form the basis of any contract or commitment. This presentation is not intended to be relied upon as advice or
      recommendation to investors or potential investors and does not take into account the investment objectives, financial situation or needs of any investor.

      All investors should consider this presentation in consultation with a professional advisor of their choosing when deciding if an investment is appropriate.

      Sphera has prepared this presentation based on information available to it, including information derived from public sources that have not been independently
      verified. No representation or warranty, express or implied, is provided in relation to the fairness, accuracy, correctness, completeness or reliability of the information,
      opinions or conclusions expressed herein.

      This presentation should not be considered a comprehensive representation of Sphera's business, financial performance or results.

      This presentation may contain forward-looking statements. These statements reflect Sphera’s current knowledge and its expectations and projections about future
      events and may be identified by the context of such statements or words such as “anticipate,” “believe”, “estimate”, “expect”, “intend”, “plan”, “project”, “target”,
      “may”, “will”, “would”, “could” or “should” or similar terminology.

      Sphera undertakes no obligation to update or revise these forward–looking statements to reflect events or circumstances that arise after the date made or to reflect
      the occurrence of unanticipated events. Inevitably, some assumptions may not materialize, and un-anticipated events and circumstances may affect the ultimate
      financial results. Projections are inherently subject to substantial and numerous uncertainties and to a wide variety of significant business, economic and competitive
      risks.

      Therefore, the final results achieved may vary significantly from the forecasts, and the variations may be material.

2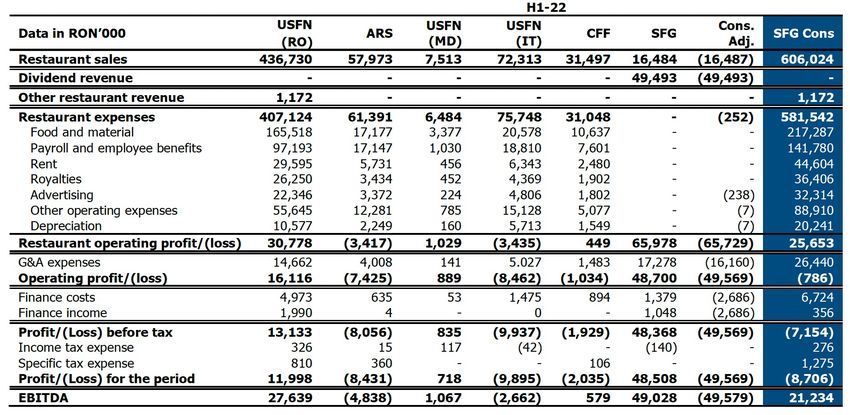
Welcome to SFG’s H1 2022 Results Call

       Calin Ionescu                     Valentin Budes                     Monica Eftimie                  Zuzanna Kurek
       CEO                               CFO                                CMO                             IR

      Sphera Franchise Group’s unaudited H1 2022 results are available for download on our website: www.spheragroup.com.

      The recording of this conference call will be available on our website shortly.

      For any questions related to Sphera Franchise Group’s activity on the Bucharest Stock Exchange, please contact our IR
      team at: investor.relations@spheragroup.com.
3
Agenda for today’s call

        1   H1 2022 Highlights

       2    Business updates from H1 2022 & beyond

       3    Brand Performance

       4    Q&A session

       5    Annex: Key H1 2022 Financials

4
H1 2022 Highlights

5

SFG Performance in H1 2022
• Best quarter in history: SFG delivered the best sales quarter in history, registering RON
327.4 million in revenues, + 40% YoY. All brands registered record sales, across all markets
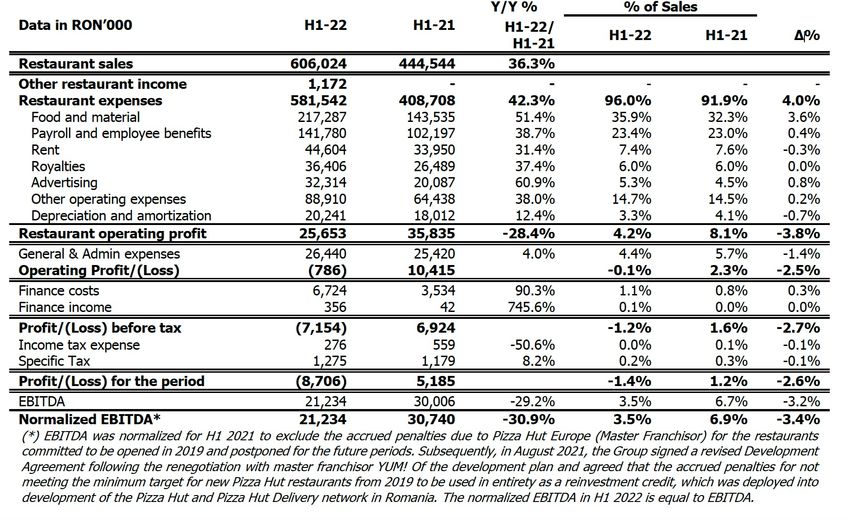
Data in RON’000 H1-22 H1-21 Y/Y % of activity in a rapid ramp-up following the lifting of the COVID-19 restrictions.
Restaurant sales 606,024 444,544 36.3% • Positive evolution in Q2 2022: The restaurant expenses slowed down in Q2 2022,
1,172 - - amounting to 95% of the cost of sales vs 98% registered in Q1 2022, due to the successful
Other restaurant income
transfer of part of the costs to the end customers. In Q2 2022, Group recorded EBITDA of
581,542 408,708 42.3%
Restaurant expenses RON 17.5 million (+1% YoY), net profit of RON 2.2 million (-54% YoY). The decrease in
Restaurant operating profit 25,653 35,835 -28.4% the net profit in Q2 2022 was due to the inflation, energy prices, lack of government
26,440 25,420 4.0%
facilities. However, Q2 2022 net profit has registered a substantial increase of RON 13.1
General & Admin expenses
million vs. Q1 2022.
EBITDA 21,234 30,006 -29.2%
• Expenses main challenge in H1 2022: Restaurant expenses grew faster than revenues,
Normalized EBITDA* 21,234 30,740 -30.9% registering a 42% increase YoY, reaching RON 581.5 million. This was driven firstly by a
(786) 10,415 - 51% increase in cost of food and material costs (due to costs of poultry rearing, energy
Operating Profit/(Loss)
costs, the minimum wage increase, inflationary environment). The feed grain prices
6,724 3,534 90.3%
Finance costs continued to grow in H1 2022 due to lingering war in Ukraine, driving the increase in the
Finance income 356 42 745.6% raw material prices. Payroll costs grew 39% YoY, reaching RON 141.8 million due to wage
increases, a new bonus scheme, and raising benefits. The number of employees increased
Profit/(Loss) before tax (7,154) 6,924 -
by 19% YoY, primarily due to larger network.
Income tax expense/(credit) 276 559 -50.6%
• Other operating expenses increased 38% YoY, reaching RON 88.9 million due to an
Specific Tax 1,275 1,179 8.2% almost doubling of the utility costs, which reached RON 21.2 million (+91%), and a 20%
(8,706) 5,185 -
increase in the third-party expenses, to RON 45.4 million.
Profit/(Loss) for the period
• G&A: The G&A costs increased 4% YoY in H1 2022 reaching RON 26.4 million, however
the weight of G&A in sales decreased 1.4pp in Q2 2022 vs previous quarter.
• Partial recovery of Q1 2022 loss: The excellent topline performance and positive
Results excl. IFRS16
bottom line in the second quarter helped recover part of the losses that the Group
6 registered in Q1 2022, resulting in RON 606 million in consolidated revenue (+36% YoY),
EBITDA of RON 21.2 million (-29% YoY), net loss of RON 8.7 million.
SFG H1 2022 Performance

                             606
                      6%                                     608
                    +3
                                                        0%            30.7
         444.5                                        +4

                             327.4
    H1                                                                            -31%

                                                              322.3
                     +4
                       0%             434.1
          233.1

                                                                                            21.2

                                                                      17.6
                                        208.3 225.8
                                                        3%
    Q2                                                +4                         -1%

                                                                                             3.8 17.5
                             278.6

                                                              285.7
          211.4

                                                        7%

                                                                      13.1
    Q1                 2%                             +3                         -71%
                     +3

          2021               2022       2021                  2022    2021                   2022

         Restaurant Sales            Expenses (Restaurant + G&A)       Normalized EBITDA
                  in RON m                 in RON m, excl. IFRS16
                                                                             in RON m, excl. IFRS16

7
SFG H1 2022 Performance breakdown
    Contribution to H1 2022 turnover

                                            5.2%
       11.9%           1.2%
                                  9.6%
                                                     Q1

                                                           46%        54%

               86.8%                      85.2%                          Q2: 15%
                                                          Q3: 27.8%            Q2

             Per market                  Per brand         Per quarter
8
Business updates from H1 2022 & beyond

9

COVID-19 & FISCAL UPDATES
         Restrictions
     •       Lifting of the restrictions in all markets of activity in Q2 2022: As of 09.03.2022, Romania has lifted all the COVID-19
             restrictions and consequently, both vaccinated and unvaccinated customers can enter shopping malls and restaurants without
             limitations. The restrictions in Italy were loosened as of 01.04.2022, and lifted as of 01.05.2022, and in the Republic of
             Moldova were lifted as of 19.04.2022

      Facilities granted
         •    Technical unemployment: there were limited technical unemployment grants provided in Q1 2022, which amounted to RON
              0.2 million. In Q2 2022, there were no technical indemnities granted.
         •    No room for negotiations: There was a limited opportunity to renegotiate lease agreements in Q1 2022 therefore the
              renegotiations in the period were not substantial. No renegotiations as of Q2 2022.

         Fiscal updates
         •    Change of the social contributions for part time contracts, starting with 1st of August 2022.
         •    Cancellation of specific tax starting with 1st of January 2023 (replaced by profit tax/income tax).
         •    Increase of VAT rate for restaurant and catering services and hotel accommodation from 5% to 9% and the increase of VAT
              rate for non-alcoholic beverages containing added sugar or other sweeteners or flavorings from 9% to 19%, starting with 1st of
              January 2023.
         Disclaimer: no application norms available at this moment for the changes starting with 1st of January 2023
10
Restaurant development, Staff
Number of stores
• 174 restaurants operated: SFG operated 174 restaurants as of 30.06.2022, out of which 94 KFC restaurants in Romania, 2 in
Moldova and 20 in Italy, as well as 14 Taco Bell restaurants, 42 Pizza Hut restaurants (of which 22 Pizza Hut and 20 Pizza Hut
Delivery, of which 3 Fast Casual Delivery restaurants), 1 PHD subfranchise and 1 Paul restaurant in Romania.
• 5 new openings in H1 2022: Sphera opened 5 new restaurants (4 in Q1 2022 and 1 in Q2 2022): 2 KFC (Colosseum Mall,
Bucharest & drive thru Catex commercial center, Calarasi), Taco Bell (City Park Mall, Constanta), 2 Pizza Hut (Fast Casual Delivery
in Militari Shopping Centre, Bucharest & Express in Shopping City Targu Jiu). One restaurant was closed in Q2 2022 – Pizza Hut
in AFI Cotroceni.
• New development agreement for 2022 for Taco Bell: CFF will benefit from progressive financial incentives from YUM!,
depending on the number of newly opened restaurants. For any exceeding of the minimum number of 2 new net restaurants,
CFF will benefit from additional financial incentives.
Staff
• 19% increase in employees YoY: As of 30.06.2022, the Group had 5,230 employees, out of which 4,885 in Romania, 260
in Italy and 85 in the Republic of Moldova. In H1 2022, the Group continued the project of hiring employees from abroad. So
far, Sphera hired over 200 employees from Sri Lanka, with most of them currently working for USFN Romania.
11Capital Markets, Sustainability & Dividends
FTSE Russell
• Inclusion in the FTSE Global Microcap: SFG shares are included, as of March 21st, 2022, in the FTSE Russell indices for
Emerging Markets, FTSE Global Micro Cap index. Liquidity criteria has been met each month since the beginning of 2022 (to be
maintained in index, company needs to meet liquidity criteria 8/12 months).
Receiving Food Safety Certification
• On June 3rd, 2022, the company informed the market about receiving the ISO 22000:2018 certification, which sets out the
requirements for a food safety management system and addresses all organizations in the food industry, regardless of size or
sector
Sustainability
• New Sustainability Report: In July 2022, Sphera published its Sustainability Report for years 2020-2021, available HERE.
• Make good easy: As part of our on-going commitment to the environment over 100 HQ employees volunteered for a one-day
trash removal in the Râioasa Forest in Săbăreni, Ilfov in July.
Dividend payment
• RON 0.9021 gross dividend paid out: In the OGSM from February 4th, 2022, the shareholders approved the dividend
distribution amounting to RON 35,000,884.61 from the undistributed net profit of 2020, fixing a gross dividend per share at RON
0.9021. The payment date was 30.05.2022.
122022 Guidance
• Inflation in 2022 exceeded the levels estimated in Approved Budget: the food and material costs due to inflation are
expected to exceed the estimates used in preparing the 2022 budget. This is due to the increase in all material costs categories
with the greatest impact seen in: chicken, shortening, vegetables, mozzarella, beef, cheese and flour prices as well as in energy,
affecting various operating restaurant cost lines.
• Updated guidance for food & material costs: the weight of these costs in sales are estimated to increase with 2.3pp
compared to the Approved Budget due to the reasons enumerated above. This increase will result in a restaurant gross margin
between RON 808-873 million.
• Continued cost control in 2022: to mitigate the negative effect of the increase in the food and material costs, the
management will focus on tighter cost-control and will consequently target lowering restaurant operating expenses share in net
sales with 0.6pp compared to the Approved Budget and lowering G&A expenses by 6.6%.
13Marketing
KFC: Drive frequency and maximize relevance
• KFC focused on strengthening favorability for the burger layer by successfully launching an innovative burger in Q2 called Zinger
Mozzarella. The unique communication campaign resulted in strong same-store sales growth and an increase in restaurant visits.
• Building a distinctive and relevant brand leads to higher sales, therefore, in Q2 we launched a brand campaign focused on craving,
an important asset for KFC and a key business driver for QSR.
• We continued our effort to reinforce the “value for money” perception by communicating the Tuesday Bucket through a 360
campaign that drove traffic in the stores and by offering coupons through our mobile app.
• KFC is a trusted and beloved brand in its category and for its 25th year anniversary we offered prizes and discounts to both loyal
customers and dedicated employees.
• With the aim of boosting sales and reinforcing the best tasting chicken attribute, KFC launched Popcorn Chicken, a new core
product which was communicated in digital using our social entertainment channel approach.
Pizza Hut: Build sales and increase distinctiveness
• Pizza Hut continued its value journey in Q2 by launching Pepperoni, our most loved recipe, at a special price with the aim of
increasing transactions through attracting new users and reinforcing our pizza expert attribute.
• In June we launched a repositioning campaign as the favorite pizza of Romanian families with the objective of reversing the sales
trend and bringing to life the power of the brand. By building a clear territory for Pizza Hut the brand will become more relevant
and for everyday occasions increasing the brand power and the regular consumer base.
• As a secondary layer the brand communicated value offers for the dine-in and delivery channels which resulted in same-store sales
14 growth.Marketing
Taco Bell: Drive trial and build brand
• Taco Bell focused its communication in Q2 on product innovation with a value price point by re-launching the Chalupa with the aim
of building both consideration and trial while making the core products affordable.
• With the aim of continuing to build a cult brand and to deliver strong sales Taco Bell launched a brand campaign which
communicated its most important attribute in the category, its distinctiveness of the experience and products offered to its
customers, under the tagline “nothing ordinary”.
• The brand launched its TIK TOK channel, adding to its ownable digital assets, to be closer to its die-hard Taco Bell lovers and early
Taco Bell adopters.
The digital normal
• Focusing on ease of access for our consumers who expect frictionless experiences, we continued our digital journey and
communicated through digital media our “click & collect” services and ecommerce platforms, with the objective of expanding our
user base and gaining repeat visits from existing users.
Pricing adaptation to the market conditions
• In the current economic climate, we increased the prices in June for the three brands in order to protect the bottom line and
absorb the increased cost of inputs. At the same time, we focused on value offerings to the customer to ensure continued
traffic, visits, and transactions.
15Brand performance 16
All Store Performance
            KFC Romania                                                       114.9%

                                                                                         42.8%
     •   Q2’22 was another quarter of continued increase for KFC                                                    37.3%
                                                                                                           23.6%
         Romania as all store performance improved 37% YoY due     14.3%
                                                                                                  20.3%

         to good like-for-like performance paired with the sales
         generated by the 6 new KFC restaurants that were
                                                                              Q2’21                        Q1’22    Q2’22
         opened between Q3’21 and Q2’22.                           Q1’21                 Q3’21    Q4’21

     •   Same-store performance of KFC Romania improved 28%
         YoY due to the lack of any COVID-19 restrictions,
         allowing all customers to freely enter malls and                        Same Store Performance
         restaurants.
     •   KFC Romania ended H1’22 with EBITDA of RON 27.6
                                                                                112.4%
         million and net profit of RON 12 million.
     •   20% of all orders at KFC Romania were made for delivery
         in Q2’22, a 7pp decrease compared to Q1’22.
     •   Highest share of own sales channels in Q2 since the
         onset of the pandemic.                                                           39.8%
                                                                                                                   28.3%
                                                                                                  14.3%    15.1%
                                                                      14.1%

17                                                                              Q2’21     Q3’21    Q4’21   Q1’22   Q2’22
                                                                      Q1’21
All Store Performance
KFC Italy & KFC Republic of Moldova 114.5%
88%
70.3%
58.4%
KFC Italy 26%
2.5%
• All-store performance registered 58% sales increase in Q2’22 vs. Q2’21, Q1’21 Q2’21 Q3’21 Q4’21 Q1’22 Q2’22
while the like-for-like evolution was the best of all the Group, registering
a 57% sales increase in Q2'22 vs. Q2’21. Same Store Performance
102.7%
• USFN Italy closed H1’22 with RON 2.6 million negative EBITDA. In Q2,
79.2%
KFC Italy registered better performance versus previous quarter, 73%
56.9%
lowering the net loss with 36%, despite increasing the sales just with
16%, thanks to the maturity of the existing units, thus validating the
20.8%
Group’s business model in Italy. Q1’21
• 12% of orders in Q2’22 were for delivery, 2pp QoQ decrease. -6%
Q2’21 Q3’21 Q4’21 Q1’22 Q2’22
All Store Performance
179.3% KFC Moldova
• Sales in the Republic of Moldova increased 45% in Q2’22 YoY, reaching RON
4.1 million.
• KFC Moldova closed H1’22 profitable, with EBITDA of RON 1.1 million and net
44.8%
35.3%
22.8%
profit of RON 0.7 million.
19% 22.3%
18 • Sales for delivery decreased 4pp QoQ, reaching 31% of total sales.
Q1’21 Q2’21 Q3’21 Q4’21 Q1’22 Q2’22Pizza Hut & Taco Bell
All Store Performance
Pizza Hut 108.4%
• Pizza Hut’s continued YoY increases, registering a positive evolution of all 71.4%
store performance of 46% in Q2’22 vs Q2’21 as a combined effect of 5 new 54.6% 55.3%
45.5%
openings between Q3’21 and Q2’22 and an increase in the same stores sales
by 36%.
Q1’21
• 40% of all orders were made for delivery in Q2’22
Q2’21 Q3’21 Q4’21 Q1’22 Q2’22
• Highest share of own sales channels in Q2 since the onset of the pandemic.
-32.6%
• Pizza Hut closed H1’22 with negative EBITDA of RON 4.8 million and a net
loss of RON 8.4 million.
245.4% Taco Bell
All Store Performance
• Taco Bell’s same store performance in Q2’22 registered a 34% increase YoY
while all store performance appreciated 40%.
62.8%
• Between Q3’21 and Q2’22, Taco Bell opened 2 new restaurants.
43.6%
48.2%
39.6%
• Taco Bell closed H1’22 with EBITDA of RON 0.6 million and a loss of RON 2
million.
13.1%
• 32% of all orders in Q2’22 were for delivery, 9pp QoQ decline.
19
Q1’21 Q2’21 Q3’21 Q4’21 Q1’22 Q2’22Q&A Session 20
Annex: Key H1 2022 Financials

21
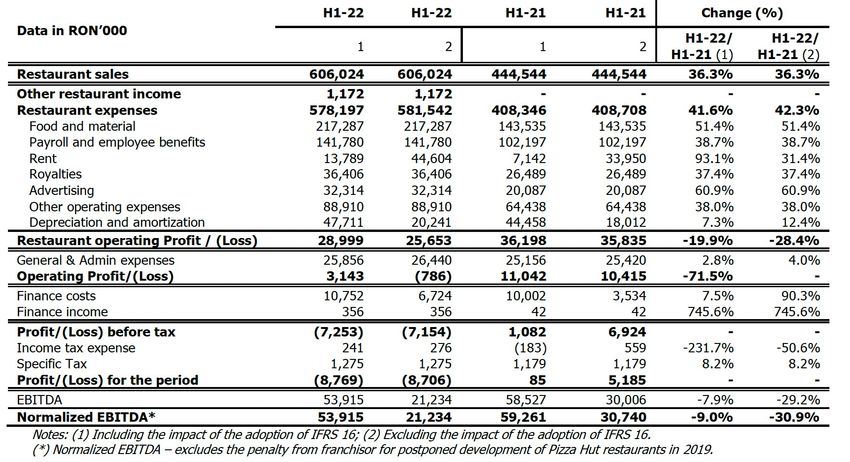
Summary of H1 2022 Consolidated FS

22                                        Results excl. IFRS16
Summary of H1 2022 Consolidated FS
     (with and without IFRS 16 impact)

23
Breakdown of H1 2022 results by entity 24 Results excl. IFRS16
Overview of the H1 2022 G&A expenses
     (with and without IFRS 16 impact)

25
Thank you for joining us!
Sphera Franchise Group’s unaudited H1 2022 results are available for download our website: www.spheragroup.com.
The recording of this conference call will be available on our website shortly.
For any questions related to Sphera Franchise Group’s activity on the Bucharest Stock Exchange, please contact our IR
team at: investor.relations@spheragroup.com.
26You can also read