Productivity of Railway Stations: Case Study - New Delhi Railway Station - CORE
←
→
Page content transcription
If your browser does not render page correctly, please read the page content below
Proceedings of 7th Transport Research Arena TRA 2018, April 16-19, 2018, Vienna, Austria

        Productivity of Railway Stations: Case Study - New Delhi
                             Railway Station
                                       Rohit Anand a,b,*, Dr. Sanjay Gupta c
       a
         Architect cum Transport Planner, C-48-C, D.D.A. Old Flats, Paschim Puri, Punjabi Bagh Club Road, New Delhi 110063, India
ᵇFormer Student, Department of Transport Planning, School of Planning & Architectue, 4-Block-B, Indraprastha Estate, New Delhi 110002,
                                                                   India
c
  Professor, Department of Transport Planning, School of Planning & Architectue, 4-Block-B, Indraprastha Estate, New Delhi 110002, India

Abstract

Railway stations, an important component of urban transport infrastructure, remains a lot to be desired in
developing countries resulting in their poor productivity. Very little research has been carried out in the field of
critically analyzing the causative factors of poor performance of stations in India. Delhi, the national capital of
India, has six major railway station terminals besides 29 smaller stations cumulatively handling 1.195 million
passengers per day. The present paper is an attempt to assess the performance of the largest railway station of
Delhi i.e. New Delhi Railway Station (NDLS), with daily passenger footfall of 0.5 million, as the case study and
evolve alternate strategies to improve its productivity. The study reveals that the track-side peripheral areas are
most critical in terms of level of service (LOS). The study estimated the utilization levels of all platforms over 24
hours period. Two alternate strategies were proposed and evaluated, namely “staggering of train schedule” &
“crowd management” scenarios which result in 8% & 47% improvement in the performance level respectively.

Keywords: Productivity; KPI; Operational Characteristics; level of service; alternate strategies; Railway Station.

*
 Corresponding author. Tel.: +91-9910610598
E-mail address: ar.rohitanand90@gmail.com

                                                                                                                                       1
Rohit Anand / TRA2018, Vienna, Austria, April 16-19, 2018
1. Introduction
Railway Stations are the important component in regional and city’s transport system as these are the gateway
into the towns along with focal point of economic and social activities. In India, railways play a crucial role in
transporting people as well as freight as it caters over 8.107 billion passengers and nearly 1.108 billion tonnes of
freight annually. Indian railways has world's largest railway network comprising 66,687 km length of route
network and 7,216 stations as on March 2016 (Year Book 2015-16, Ministry of Railways). Railway stations in
India are facing many challenges and most of the efforts in Indian railways are targeted towards running more
trains to cater increasing demand, but improving station’s environment to cater that much of demand is
completely neglected. Station facilities are obsolete and needs to be upgraded as well as land side connectivity is
absent in most of the railway stations. National Transport Development Policy Committee (NTDPC) report has
clearly highlighted that passenger services provided by Indian Railways are low to medium level of service &
comfort with poor facilities as well as poor upkeep of stations and recommends to redevelop stations for smooth
flow and comfortable experience of passengers as also to ensure clean and hygienic environment (India
Transport Report, 2014).
2. Literature Review
2.1. Functional Areas of Railway Stations
The functional areas of railway stations comprise the
following areas (Kandee, 2004) as shown in Figure 1:
Core Area: Focus on processing passengers like
Ticketing, Information, Waiting and Restrooms.
Transition Area: Connect transit facilities in the core
areas to the transportation modes like Telephones and
Commercial spaces.
Peripheral Area: Support circulation outside the main
building like platforms, tracks and vehicle service
spaces. It is further divided into two parts i.e. City-
side peripheral area and Track-side peripheral area.
Administrative areas: Control both traffic and station
Fig. 1: Flow diagram of functional elements within railway
management. station
2.2. The Indian Railways showcases all details for station’s up-gradation, development or redevelopment
(Manual for Standards and Specifications for Railway Stations, 2009). Some of salient features of this manual
relevant to present study are:
Indian railway stations are divided into four types i.e. Line Stations, Terminal Stations, Transfer Stations
and Inter-modal Stations.
The general sequence of the component spaces in railway station follows the customer’s path: entry,
through the control area, to the platform, and onto the train.
For provision of passenger amenities, Indian railway stations are categorized based on annual passengers
earning of the station having categories A1, A, B, C, D, E and F.
The objective of the Indian Railways is “To maximize passenger convenience with fast and efficient
passenger flow” and Design Approach & Hierarchy should be done from whole to part keeping in mind
three orders of preference i.e. primary, secondary and tertiary order.
Local city developmental bye-laws and master plan shall be followed in designing the capacity of
infrastructure facilities, such as building design. However Indian and international standard codes can be
applied as and when required.
2.3. Key Performance Indicators (KPI)
The following KPIs have been identified by conducting reconnaissance survey of various railway stations in case
city of Delhi (Granberg and Munoz, 2013):
2
Rohit Anand / TRA2018, Vienna, Austria, April 16-19, 2018
Dwell Time: It is the average time a person is in a space/process and is measured as “average time
spent/passenger”. Shorter dwell time is the indicator of better planned station as the movement of
passengers is fast and is the indicator of passenger’s convenience and station productivity.
Level of Service (LOS): As per Indian Railway manual, LOS performance standards provide a method of
sizing passenger circulation elements that respond to the demands of pedestrian behavior based on John J.
Fruin’s Pedestrian Planning and Design, 1987 (Manual for Standards and Specifications for Railway
Stations, 2009; HCM, 2010 and IATA, 2014).
o Average Passenger Space (m²/passenger)
o Flow Rate (passenger/m/min)
2.4. Passenger Handling capacities of Railway stations around the world
Four major railway stations in India namely “New Delhi”, “Mumbai Central”, “Chennai Central” and “Howrah”
which lies under A1 category, reveal that on an average, major Indian railway stations handle 16,500 passengers
daily per hectare of station area.. However review of three major railway stations in London (U.K.) that are
“King’s Cross”, “Waterloo” and “Victoria” reveal that these on an average handle 74,000 passengers per day per
hectare of station area which is about four and half times that of Indian stations.
3. Data Base
Various primary surveys were conducted in the case study station i.e. New Delhi Railway Station (NDLS) to
collate and analyze the data base. These included:
Station facility audit survey: Objective was “to cross-check the availability of passenger’s amenities in the
railway station as per the standards of Indian Railway Manual”.
Station user rating survey (250 samples): Objective was “to comprehend the user’s outlook (satisfaction
level) on the activities/components to identify the critical areas of the station for further detailed surveys
and analysis”.
Station user characteristics survey (250 samples): Objective was “to analyze user’s characteristics” i.e.
dwell time of each movement and activity; profession; income level; time spent on the platforms or
waiting lounge; and luggage carried.
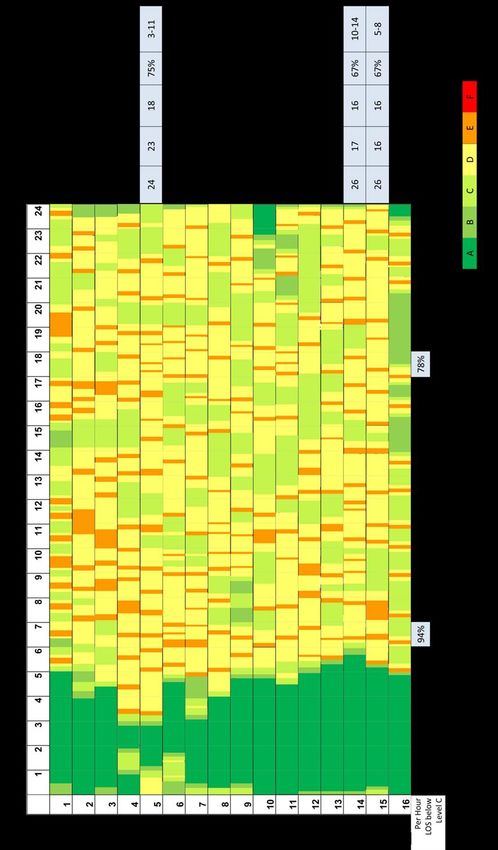
Passenger counts at Platforms, FOBs, Staircase and escalator: Objective was “to estimate current daily
footfalls” and “to analyze LOS” with observation and videography approach. CCTV footages of total 40
hours duration at 20 locations during peak hours (9am–10am morning peak and 5pm–6pm evening peak)
was collected from Northern Railway and analyzed. In addition observation method has been used for
passenger counts wherever videography data was not available.
Fig. 2: Snapshots of Various CCTV Cameras’ Footage at different Locations
The major source of secondary data for the present study is the Redevelopment Report of New Delhi Railway
Station, prepared in the year 2008 by Terry Farrell & Partners and the current “Platform Berthing Chart” from
New Delhi Railway station management describing operational details of all the trains like train type, train
timings, platform number, train operations etc.
3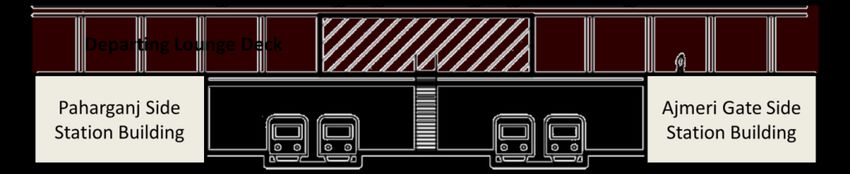
Rohit Anand / TRA2018, Vienna, Austria, April 16-19, 2018

4. Study Area

4.1. City Profile
Delhi has an area of 1,483 sq. km. According to 2011 census of India, the population of Delhi is 16.7 million.
The corresponding population density was 11,297 persons per sq. km. with 93% population falling under urban
area. The city acts as the nodal point for five national highways and intercity rail corridors, carrying large
volumes of heterogeneous passenger and goods traffic. It is a major rail hub on the map of India. The Delhi
division falls under Northern Railways and it has approximate track kilometer of 2,875 km (Figure 3). Delhi
Division runs 582 Mail/Express & Passenger trains. The city has network of 35 stations out of which Old Delhi,
New Delhi, Hazrat Nizamuddin, Anand Vihar, Sarai Rohilla and Delhi Cantt being the major stations while rest
29 are small stations. All the railway stations in Delhi cumulatively handle around 1.195 million passengers
everyday out of which topmost four major railway stations that are New Delhi, Old Delhi, Hazrat Nizamuddin
and Anand Vihar Terminus, handle around 1.06 million passengers daily accounting for 88.70% of total
passengers handled.

4.2. New Delhi Railway Station
The New Delhi Railway Station, situated between
Ajmeri Gate and Paharganj is the main railway station
in Delhi and has been considered for detailed study as
currently it is serving highest number of passengers
i.e. 0.5 million and train operations i.e. over 350 trains
daily with 16 platforms. Station holds the record for
‘largest route interlocking system’ in the world along
with the Kanpur Central Railway Station i.e. 48
numbers of interlocking.

5. New Delhi Railway Station Characteristics

5.1. Physical Characteristics                                                  Fig. 3: Delhi City Map with Railway Tracks

At New Delhi station the railway land is spread over an area of 86 ha out of which 41.1 hectare is railway station
area (48% of total). Railway Station area except yard area is 24.5 ha (28% of total) (Table 1). The main buildings
of station cover one ha (10,000 sq.m) area with G+3 height. The station has two entry/exits points one at
Paharganj (Gate no.1) and second at Ajmeri Gate (Gate no.2).

Table 1. Station area details (excluding yard).
S.No.             Railway Station Area            Area (m²)      Area (ha.)        %                 Area Type               %
  1      Station Building                             10,000            1.00       4.08    Core and Transit Area             4.08
  2      Commercial (Hotels/Yatri Niwas)              16,500            1.65       6.73    Transit Area                      6.73
  3      Parcel/Cargo Handling Area                   20,000            2.00       8.16    Peripheral Area                   8.16
  4      Platforms and Tracks                        130,000           13.00      53.06    Track-Side Peripheral Area       53.06
  5      Circulation                                  46,200            4.62      18.86
  6      Parking                                      14,800            1.48       6.04
                                                                                           City-Side Peripheral Area        27.96
  7      Metro Station                                  3,000           0.30       1.22
  8      Others                                         4,500           0.45       1.84
         Total                                       245,000           24.50        100                                      100
Source: Indian Railway (Northern) and area calculation through Google Earth maps, 2016

It is also observed that platforms and tracks are spread out in more than 50% area of the station’s total area of
24.5 hectare. Thus track side peripheral area is the most critical area out of all others remaining as it is also
important from the point of view of train operations as well as operations of station.

                                                                                                                                 4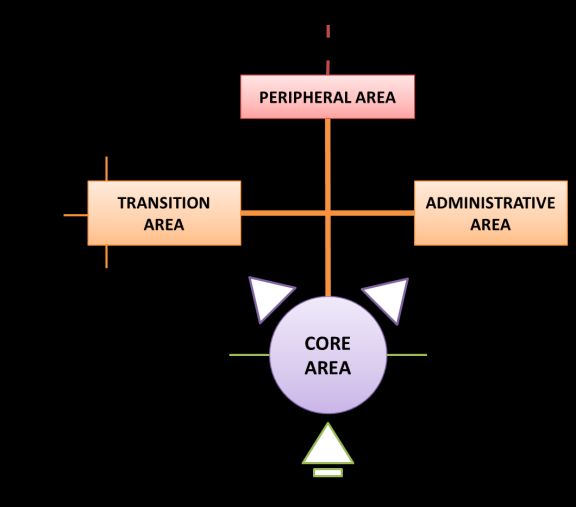
Rohit Anand / TRA2018, Vienna, Austria, April 16-19, 2018
5.1.1. Development Norms for Railway Stations in Delhi
According to norms and standards given in Delhi Master Plan 2021, railway stations are permitted to cover 70%
land area under operations and 30% land area under building and 1.0 Floor Area Ratio (FAR). Present situation
of station is as follows:
Station total area of plot = 24.5 ha
Area under Operation = 13 ha (53% out of permissible 70%)
Area under buildings = 1.6 ha (6.5% out of permissible 30%)
Area covered on all floors is 48,500 m², hence FAR consumed is 0.2 (20% of permissible)
It is observed that areas under “operation & building” and FAR are underutilized and there is the scope for future
expansion of station infrastructure (facilities or buildings).
5.2. Operational Characteristics
5.2.1. Trains Movement
Total 351 trains (106 originating, 106 terminating and 139 passing) are being operated from the station out of
which maximum 275 trains (87 originating, 87 terminating and 103 passing) gets scheduled per day for
operations. Share of express trains is highest with 41% followed by Electric Multiple Unit (EMU) trains with
28% share. Platform number 5 is the busiest platform with the operation of average 23 trains/day followed by
platform number 3 with the operation of average 22 trains/day.
Fig. 4: Hourly Train Operation Distribution (Daily Average)
As shown in above Figure 4, morning and evening peak hours have been identified as 9am to 10am and 5pm to
6pm with on average 22 and 21 trains daily operations respectively.
5.2.2. Daily Footfalls Estimation
According to the secondary data, an estimated 0.25 million passengers/day were observed in terms of footfalls
while an estimated 0.35 million passengers/day were observed as per Ministry of Railways. About 245 trains
operated everyday from 12 platforms. It is estimated that by the year 2026 the daily footfalls are expected to
reach 0.5 million passengers/day (NDLS Redevelopment Report, 2008).
The daily footfalls estimation in this study has been done using station’s videography data by head. The process
involved counting passengers at all entry/exits (eight points), four at Paharganj and four at Ajmeri Gate side in
evening peak hours. A total of around 36,000 passengers enter and exit the station in peak hours, out of which
Paharganj and Ajmeri Gate sides contributing 40% and 60% share respectively. By applying peak hour factor of
7.45% of 24 hours footfalls (NDLS redevelopment report 2008), the daily passenger footfalls estimated in 2016
as 0.48 million approx. as shown in Table 2 below.
Table 2. Total Daily Passenger Footfalls at New Delhi Railway Station.
Both Directions
(24 Hours Footfalls by taking 7.45% as Peak Hour Factor)
Directions Entry Exit Total Directional Distribution
Paharganj 89,200 101,600 190,800 40 %
Ajmeri Gate 157,800 134,200 292,000 60 %
247,000 235,800 482,800 100 %
Source: Primary Survey, 2016
5Rohit Anand / TRA2018, Vienna, Austria, April 16-19, 2018
5.2.3. Dwell Time (DT)
The total dwell time for departing passenger (unreserved), departing passenger (reserved) and arriving passenger
observed is 46, 37 and 14 min. respectively. Of these 65% – 68% of dwell time is spent in track-side peripheral
area i.e. platforms, walkways and stairs/elevators/escalators by departing passengers followed by city-side
peripheral area with 13% – 28% of dwell time spent by passengers as shown in Table 3 below.
Table 3. Average Dwell Time
Departing Passenger Departing Passenger
Arriving Passenger
Station Component (Unreserved) (Reserved)
(in Minutes)
(in Minutes) (in Minutes)
City-Side Peripheral Area 6 6 4
Core Area 5 1 0
Administrative and Transit Area 1 1 1
Circulation 4 4 4
Track-Side Peripheral Area
Waiting at Platform 30 25 5
Total 46 37 14
Source: Primary Survey, 2016
5.3. Passenger Characteristics
The following four attributes have been studied:
Time spent by users at Platforms/Waiting Areas: The distribution of passengers by time spent in the
station premises shows that most of the passengers are spending 20-30 minutes at station followed by 10-
20, 30-45, 45-60, >60 and 0-10 minutes.
Profession of users: The distribution of passengers by profession of users shows that maximum numbers
of passengers are business people with 27% share followed by govt. employee 22%, professionals 17%,
students 15%, private employees 14% and others 5%.
Income Levels of users: The distribution of passengers by their monthly income. shows that the maximum
number of passengers earn between INR 5,000 to 15,000 (31%) while 27% of passengers earns between
INR 15,000 to 30,000.
Luggage carried by users: Luggage carrying characteristics by passengers is the most relevant to estimate
the average amount of luggage carried by each passenger/commuter. It plays vital role in estimating LOS.
It is observed that “space occupied by one bag is equal to space occupied by one passenger”. Survey
results shows that 44% passengers are carrying one bag as their luggage and average number of baggage
carried per passenger is coming out to be 1.02 (approx. 1 bag/person) excluding hand bags.
5.4. Passenger Ratings
With the help of 250 passengers’ ratings and opinion for each movement and/or activity in using station, it has
been concluded that track-side peripheral areas i.e. vertical circulation & platforms are getting primary concern
from user perspective as well as according to Indian Railway Manual for better planning & design for
productivity improvements in station.
5.5. Major Issues
Absence of adequate hold-up areas for crowd management; lesser space provided at island platforms as compare
to side platforms; large amount of luggage carried by passengers (on an average, one bag per person) etc. are
major issues observed at the station.
6Rohit Anand / TRA2018, Vienna, Austria, April 16-19, 2018
6. Level of Service Assessment
The Level of Service (LOS) of different circulation zones of track-side peripheral area, based on Fruin’s LOS
tables (1971) and Highway Capacity Manual (HCM), 2010 are used to evaluate the station performance.
6.1. Walkway (FOB)
For determining LOS of walkway, average space (sq.m./passenger) is the criteria according to HCM 2010.
Surveys were conducted in evening peak hours (5pm-6pm) at central FOB, which shows that overall LOS of
FOB is at level D ranging from level C (26% length of FOB) to level E (12% length of FOB).
6.2. Staircase and Escalator
For determining LOS for staircases and escalators, the average space (sq.m./passenger) is the criteria according
to HCM 2010. Effective width of staircases has been considered as 3.5 m. which is less than the actual width 4.5
m. because of encroachments by station users. The primary survey results show that staircases are serving at
LOS D and escalators are serving at LOS C during peak hours.
6.3. Platforms
LOS and time taken in evacuating platform was calculated for each train type service with all three behaviours
i.e. arriving, departing and passing trains on both, side and island platforms. Methodology adopted was head-
counts from each snapshot captured in platform’s two rounds with 10 minutes time interval at platforms in front
of each train coach to calculate LOS.
Assuming that one train service type’s LOS will remain same at other times of the day and at same platform
type, the LOS behaviour pattern throughout the day at all platforms was estimated as presented in Figure 5
which reveals that:
LOS at platforms during peak hours
o Morning Peak (6am – 7am) : 94% platform areas have LOS ≥ D
o Evening Peak (5pm – 6pm) : 78% platform areas have LOS ≥ D
LOS at busiest platforms
o Platform Number 5 : 75% of the day duration have LOS ≥ D
o Platform Number 14 – 15 : 67% of the day duration have LOS ≥ D
Performance of side and island platforms
o Average LOS of Side Platform : 25–33% day-time LOS ≥ D
o Average LOS of Island Platform : 50–75% day-time LOS ≥ D
At aggregate level, platforms are serving at LOS ≥ D for 25–75% day-time duration.
Whereas, LOS should not increase above level C as per Indian Railway Manual 2009 standards except for
seasonal peak in which LOS D can be tolerated.
7Rohit Anand / TRA2018, Vienna, Austria, April 16-19, 2018
Fig. 5: Pattern of LOS Behaviour throughout the Day
8Rohit Anand / TRA2018, Vienna, Austria, April 16-19, 2018
7. Alternate Strategies for Improvement in Station Productivity
7.1. Strategy 1: Staggering of Train Schedule
Staggering of train schedule is an immediate action plan, which can be implemented with limitations of
directional platforms i.e. platform number 1-4, 5-11, and 12-16 caters north bound, passing, and east & south
bound trains respectively and only short distance (up to 700 km radius) trains can be shifted into the early
morning slot of 1am - 5am, rest of the trains can be only flipped on other platforms without any change in
timings, as shown in Figure 6 below.
Fig. 6: Examples of Staggering
By evaluating platform number 1-4 in which side and island platforms are critical for the 33% and 63% share of
the day respectively i.e. LOS ≥ D, 4% to 8% improvement can be witnessed in LOS of platforms throughout the
day after applying this strategy.
7.2. Strategy 2: Crowd Management
The strategy of creating “departing lounge deck” on available 60,000 sq.m. area above platforms and tracks as
shown in Figure 7, at existing FOB level with better facilities for access/dispersal is a potential for crowd
management. It has been estimated that FAR will improve from existing 0.2 to 0.44, whereas permissible is 1.0
and as per norms and standards, waiting hall should have provision of 5 sq.m. area per passenger, while area
available per passengers will be 5.45 sq.m. by creating deck.
Fig. 7: Deck’s Conceptual Section with Vertical Movement at Island Platform
In this strategy 21% to 47% improvement can be witnessed in LOS of 1 to 4 platforms throughout the day. It is
best short term strategy with improved circulation, reduced dwell time and enough space/area available to
provide world class facilities.
7.3. Creating Directional Terminal for Destined Trains
As a strategy for creating directional terminals it has been estimated that 255,884 (53%) out of total 0.5 million
passengers using destined & originating trains at New Delhi Railway Station can be easily shifted to proposed
directional railway terminals i.e. Holambi Kalan in north, Anand Vihar in east, Hazrat Nizamuddin in south and
Bijwasan in west direction and allows passing trains only from New Delhi.
9Rohit Anand / TRA2018, Vienna, Austria, April 16-19, 2018
8. Summing Up
The present study concludes that railway stations in India have poor handling capacity of passengers compared
to European stations. There are gaps in the use of land resources available for infrastructure development such as
area under operations, buildings and FAR are under-utilized as compare to permissible norms. Absence of
adequate hold-up areas for crowd management; lesser space provided at island platforms as compare to side
platforms; large amount of luggage carried by passengers (on an average, one bag per person) etc. have been
identified as major issues at stations which also affects station productivity.
Two alternate scenarios in the case study station were evolved, namely i.e. “staggering of train schedule” which
is an immediate action plan and “crowd management” by creating departing lounge deck which is a short term
strategy. Other than these, medium term strategy of “creating directional terminal for destined trains” can also be
implemented. After evaluating all these proposed scenarios, it has been found that case station productivity can
be improved by adopting the strategies in the paper.
Further it is also observed that city-side transport system from the station to different parts is greatly neglected
by the railway station planners and should get right priority by providing requisite public transport services,
integration and adequate parking facilities. In addition it is proposed that air space over stations need to utilized
for value capture by developing commercial or mixed-use development based on PPP mode.
9. References
Year Book 2015-16, Indian Railways Statistical Publications 2015-16, Ministry of Railways (Railway Board), Government of India.
India Transport Report: Moving India to 2032 (June 2014), National Transport Development Policy Committee (NTDPC), Planning
Commission, Government of India.
Manual for Standards and Specifications for Railway Stations. Ministry of Railways (Railway Board), Government of India, June 2009.
Indian Railways: Lifeline of Nation (White Paper), Government of India, Ministry of Railways, New Delhi, February 2015
New Delhi Railway Station Redevelopment Report, 2008. Consultants namely Terry Farrell & Partners; Ove Arup & Partners and SMEC
International Pty Ltd. for Government of India, Ministry of Railway, Delhi.
Highway Capacity Manual (HCM) 2010. Transportation Research Board (TRB) of the National Academies, Washington DC.
Hariharan, S. (March 2015). Modernisation of Railway Stations in India. Submitted to Institute of Rail Transport, New Delhi.
New Level of Service Concept. International Air Transport Association (IATA) and Airports Council International (ACI) World, Canada.
2014.
Granberg, T. A. and Munoz, A. O. (2013). Developing key performance indicators for airports. Linkoping University, Sweden.
NSW Sustainable Design Guidelines for Rail v2.0, NSW Government, Transport for NSW, September 2012
Station Planning Standards and Guidelines, 2012 edition. London Underground, Transport for London.
Station Capacity Assessment Guide, Network Rail, May 2011
Kandee, S. (2004). Intermodal Concept in Railway Station Design. Department of Interior Design, School of Fine and Applied Arts,
Bangkok University.
Passenger Flows in Underground Railway Stations and Platforms, Report 12-43. Mineta Transportation institute, San José State University,
San José, CA.
10You can also read