PROFILING BARRIERS TO SOCIAL INCLUSION IN IRELAND - THE RELATIVE ROLES OF INDIVIDUAL CHARACTERISTICS AND LOCATION SEAMUS MCGUINNESS, ADELE WHELAN ...
←
→
Page content transcription
If your browser does not render page correctly, please read the page content below

RESEARCH
SERIES
NUMBER 71   PROFILING BARRIERS TO SOCIAL
July 2018
            INCLUSION IN IRELAND
            THE RELATIVE ROLES OF INDIVIDUAL
            CHARACTERISTICS AND LOCATION
            SEAMUS MCGUINNESS, ADELE WHELAN, ADELE BERGIN AND
            JUDITH DELANEY

                         ENCE FOR POL
                       ID            IC
                     EV                Y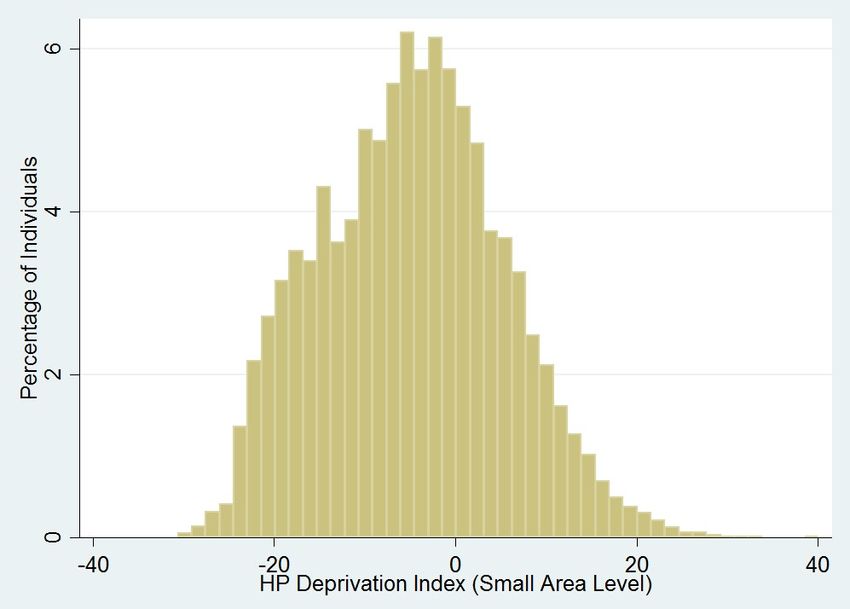
PROFILING BARRIERS TO SOCIAL INCLUSION IN
IRELAND: THE RELATIVE ROLES OF INDIVIDUAL
CHARACTERISTICS AND LOCATION

Seamus McGuinness

Adele Whelan

Adele Bergin

Judith Delaney

July 2018

RESEARCH SERIES
NUMBER 71

Available to download from www.esri.ie
© The Economic and Social Research Institute
Whitaker Square, Sir John Rogerson’s Quay, Dublin 2

ISBN 978-0-7070-0445-7

DOI https://doi.org/10.26504/rs71

This Open Access work is licensed under a Creative Commons Attribution 4.0 International License
(https://creativecommons.org/licenses/by/4.0/), which permits unrestricted use, distribution, and
reproduction in any medium, provided the original work is properly credited.
ABOUT THE ESRI
The mission of the Economic and Social Research Institute is to advance evidence-
based policymaking that supports economic sustainability and social progress in
Ireland. ESRI researchers apply the highest standards of academic excellence to
challenges facing policymakers, focusing on 12 areas of critical importance to
21st-century Ireland.
The Institute was founded in 1960 by a group of senior civil servants led by
Dr T.K. Whitaker, who identified the need for independent and in-depth research
analysis to provide a robust evidence base for policymaking in Ireland.

Since then, the Institute has remained committed to independent research and
its work is free of any expressed ideology or political position. The Institute
publishes all research reaching the appropriate academic standard, irrespective
of its findings or who funds the research.
The quality of its research output is guaranteed by a rigorous peer review
process. ESRI researchers are experts in their fields and are committed to
producing work that meets the highest academic standards and practices.

The work of the Institute is disseminated widely in books, journal articles and
reports. ESRI publications are available to download, free of charge, from its
website. Additionally, ESRI staff communicate research findings at regular
conferences and seminars.
The ESRI is a company limited by guarantee, answerable to its members and
governed by a Council, comprising 14 members who represent a cross-section of
ESRI members from academia, civil services, state agencies, businesses and civil
society. The Institute receives an annual grant-in-aid from the Department of
Public Expenditure and Reform to support the scientific and public interest
elements of the Institute’s activities; the grant accounted for an average of 30 per
cent of the Institute’s income over the lifetime of the last Research Strategy. The
remaining funding comes from research programmes supported by government
departments and agencies, public bodies and competitive research programmes.
Further information is available at www.esri.ie
THE AUTHORS
         Seamus McGuinness is a Research Professor, Adele Whelan is a Research Officer,
         Adele Bergin is a Senior Research Officer, and Judith Delaney is a Post-Doctoral
         Research Fellow at the Economic and Social Research Institute. All members of
         the research team have adjunct research positions at Trinity College Dublin.
         Seamus McGuinness and Adele Bergin are also Research Fellows of the Institute
         for the Study of Labour (IZA), Bonn, Germany.

         ACKNOWLEDGEMENTS
         The work carried out in this report was funded by Pobal as part of the Research
         Programme on Community Development and Social Inclusion. We would like to
         thank all the individuals involved within Pobal who provided assistance during the
         project, particularly, Martin Quigley, Richard Deane, Lucy Pyne, Ela Hogan,
         Catherine Sheehan, Rebecca McCarthy and Jerry Murphy. Valuable contributions
         were made by members of the Research Programme Steering Committee: Tony
         Fahey, Helen Russell, Martin Quigley, Richard Deane and Jerry Murphy. Sincere
         thanks are also due to Dr John Cullinan (NUIG), who acted as an external
         reviewer, for his suggestions and contributions to the final draft. Finally, our
         thanks go to the Director of the Economic and Social Research Institute (ESRI) and
         two internal ESRI referees for their comments on earlier drafts of this report.

This report has been peer-reviewed prior to publication. The authors are solely responsible for the
content and the views expressed.
CONTENTS Executive Summary .................................................................................................................................. i Chapter 1 Introduction ......................................................................................................................... 1 Chapter 2 International evidence ........................................................................................................ 3 2.1 Jobless households ................................................................................................................. 3 2.2 Lone parents ........................................................................................................................... 4 2.3 Homeless or affected by housing exclusion............................................................................ 5 2.4 Disability.................................................................................................................................. 5 2.5 Ethnic minorities ..................................................................................................................... 6 Chapter 3 The SICAP programme ......................................................................................................... 8 Chapter 4 Data and methodology ...................................................................................................... 11 Chapter 5 Results ............................................................................................................................... 17 Chapter 6 Summary and conclusions ................................................................................................. 34 Bibliography .......................................................................................................................................... 37 Appendix ............................................................................................................................................... 42
LIST OF TABLES
Table 1    Compositional distribution of SICAP clients by programme goals.................................................. 11
Table 2    Summary of social barrier information from SICAP participants, 2016 .......................................... 17
Table 3    Barriers to full economic and social inclusion reported by SICAP clients, 2016 ............................. 19
Table 4    Combinations of barriers reported by SICAP participants, 2016 .................................................... 19
Table 5    Combinations of barriers reported by gender, 2016 ...................................................................... 20
Table 6    Probit models of social barrier information, 2016.......................................................................... 26
Table 7    Probit models of single and multiple barriers across goals, 2016 .................................................. 28
Table 8    Probit models of experiencing barrier(s) by area deprivation, 2016 .............................................. 29
Table 9    Dominance analysis showing the percentage contribution of each variable to the explained risk of
           experiencing each barrier, 2016 ..................................................................................................... 30
Table 10   Proportion of clients reporting barriers at lot level by deprivation index, 2016 ............................ 31
Table 11   Ordinary least squares model results of individuals experiencing barrier(s) by lot, 2016 ............. 31
Table 12   Probit models of social barrier information with population density added to the model, 2016.. 33
Table A1   Probit model of non-response, 2016 .............................................................................................. 42

LIST OF FIGURES
Figure 1   How did the share of lone parent clients vary with the population share of lone parents at lot
           level in 2016? .................................................................................................................................. 14
Figure 2   How did the share of SICAP clients with disabilities vary with the population share of individuals
           with disabilities at lot level in 2016?............................................................................................... 15
Figure 3   Social barrier information for all 47,511 observations ................................................................... 18
Figure 4   Social barrier information for sample of 33,697 completed observations ..................................... 18
Figure 5   Distribution of SICAP participants by Pobal HP Deprivation Index (SA), 2016................................ 21
Figure 6   How did the average number of individual barriers match the HP deprivation score at the lot level
           in 2016? .......................................................................................................................................... 22
Figure 7   How did the average individual Pobal HP Deprivation Index (SA) match the HP deprivation score
           at lot level in 2016?......................................................................................................................... 23
Executive Summary | i
EXECUTIVE SUMMARY
The Social Inclusion and Community Activation Programme (SICAP) represents a
major component of Ireland’s community development strategy, led by the
Department of Rural and Community Development (DRCD).1 Pobal managed the
initial set-up and design phase of the social inclusion programme and has
responsibility for a wide range of programme functions. The SICAP programme
budget for 2016 was €35.8 million. SICAP aims to tackle poverty, social exclusion
and inequality through local engagement and partnerships between
disadvantaged individuals, community organisations and public sector agencies.
In order for SICAP to succeed in meeting its goal, it is important that the
programme can successfully target the individuals who are most in need of
assistance. The purpose of this study is to provide an in-depth analysis of the
extent to which SICAP clients experience potential barriers to economic and
social inclusion. We focus on five key potential barriers, which reflect some of the
groups explicitly targeted under SICAP and have also been shown internationally
to represent significant challenges to inclusion. They are: (a) belonging to a
jobless household, (b) being a lone parent, (c) having a disability, (d) being
homeless or affected by housing exclusion and (e) belonging to an ethnic
minority.
The aim of this study is to inform policy by shedding light on a number of issues:
1. individual characteristics that are most common among individuals reporting potential
barriers to social inclusion;
2. the extent to which the incidence of potential barriers varies according to spatial
dimensions such as the area level of deprivation, population density or urbanicity;
3. potential implications of the findings for the future administration of the SICAP
programme.
KEY FINDINGS AND ISSUES
We show that the incidence of potential barriers reported to SICAP Programme
Implementers (PIs) will heavily reflect the demographic profile of the areas within
which the PIs operate. In 2016, the potential barrier most commonly reported by
SICAP beneficiaries was belonging to a jobless household, which was reported by
over 40 per cent of SICAP clients. Almost 12 per cent of beneficiaries were lone
parents, 7 per cent reported having a disability, 4 per cent were homeless or
1
The SICAP programme is co-funded by the European Social Fund (ESF) and receives a special allocation under
the Youth Employment Initiative (YEI). Before July 2017 the programme was overseen by the Department of
Housing, Planning and Local Government (DHPLG).i i | P r o fi l in g Ba r ri er s to So c ia l In clu s io n i n I r ela n d
affected by housing exclusion and 4 per cent belonged to an ethnic minority.
In order to help match the design of policy interventions to the specific needs of
the target groups, multivariate models were estimated to capture the
characteristics most commonly associated with each of the potential barriers to
inclusion. Generally, gender has a relatively low influence on the risk of
experiencing most potential barriers, with being female typically raising the risk
by 2 to 3 percentage points. The clear exception to this is being a lone parent, as
females are 25 percentage points more likely to report this potential barrier
when compared to males. Age appears to be a particularly important risk factor
for belonging to a jobless household, being a lone parent or reporting a disability.
In particular, SICAP beneficiaries aged under 25 are approximately 20 percentage
points less likely to be members of jobless households or lone parents. Being in
the 56+ age category raises the probability of reporting a disability by 10
percentage points relative to the 16–24 age group. Higher levels of educational
attainment are associated with a lower probability of reporting all potential
barriers. In particular, beneficiaries educated to above Leaving Certificate level
(NFQ Level 5) are at least 10 percentage points less likely to belong to a jobless
household, be a lone parent or have a disability. Nationality plays an important
role for housing difficulties and disability, with European Union (EU) nationals less
likely to report most potential barriers.
The Pobal Haase Pratschke (HP) Deprivation Index for Small Areas (SA) is a key
component of SICAP’s Resource Allocation Model (RAM), which is designed to
determine the amount of funding allocated to particular geographical areas
under SICAP. This Pobal HP Deprivation Index (SA) was found to raise the
likelihood that individuals will report being a lone parent and/or belonging to a
jobless household. This suggests that persons facing these potential barriers are
more heavily concentrated within more deprived areas. Nevertheless, the Pobal
HP Deprivation Index (SA) measure was not a predictor of disability, housing
problems or ethnic minority in beneficiaries, suggesting that persons
experiencing such potential barriers are more evenly distributed across areas
with varying levels of deprivation.
With respect to whether an individual was domiciled in a rural or an urban
location, after controlling for all other factors, beneficiaries living in urban
locations were between 4 and 10 percentage points more likely to report each of
the five potential barriers. The level of urban disadvantage was highest for lone
parents and jobless households. The results suggest that urban environments
influence an individual’s risk of experiencing potential barriers in ways that are
unrelated to the level of deprivation in the area where they live. The models
suggest that individuals living in urban locations experience additional difficulties
beyond the level of deprivation, or population density, in their immediate area.Executive Summary | iii Our analysis of the data at PI level did not suggest that PIs in deprived areas tended to have a more disadvantaged clientele, as measured by the percentage of total recipients reporting one or more potential barriers. However, the average incidence of reported barriers among PIs in urban areas is 18 percentage points higher than the rural equivalent. This confirms the analysis from the individual level data that urban environments are associated with a greater prevalence of social risk factors that are not related to area levels of deprivation or population density. It is not evident that the higher concentration of disadvantaged clients among PIs located in urban locations is sufficiently captured within the current SICAP funding model. There is evidence that PIs focus on targeting individuals from areas with higher levels of disadvantage. Nevertheless, it is observed that 40 per cent of participants qualify for assistance without reporting any of the five identified barriers and more than two-thirds of SICAP participants come from small areas that are not classified as disadvantaged (with a Pobal HP Deprivation Index (SA) of greater than –10). These findings support the view that existing funding arrangements reflect historical funding patterns rather than a strict implementation of SICAP’s RAM, which is designed to skew funding heavily towards areas with high levels of social disadvantage. In the event of increased funding being assigned to the SICAP programme, the allocation of such additional resources should be highly focused on areas with the highest concentrations of individuals meeting the SICAP target group criteria. Furthermore, we would contend that aspects of the RAM should be modified to account for the research findings that target populations are more likely to be heavily concentrated in urban areas.
Introduction | 1
CHAPTER 1
Introduction
This study uses data on individuals accessing assistance under Ireland’s social
inclusion and community development programme to measure the relative
impact of individual and spatial factors on various barriers to social inclusion. The
information used for the study comes from data captured for the 2016 Social
Inclusion and Community Activation Programme (SICAP). SICAP is a large-scale
national programme aimed at tackling poverty, social exclusion and long-term
unemployment through local engagement and partnerships between
disadvantaged individuals, community organisations and public sector bodies.
Assistance under the programme is targeted towards individuals and local
community groups meeting particular criteria.
This study seeks to address a number of specific research questions related to the
following barriers to social inclusion:
belonging to a jobless household;
being a lone parent;
having a disability;
being homeless or affected by housing exclusion;
belonging to an ethnic minority (members of the Travelling Community, Roma,
refugees, asylum seekers).
These five particular barriers were chosen for further analysis as they were
present in the IRIS dataset and these issues have been shown internationally to
represent significant challenges to economic and social inclusion (see Chapter 2).
They also encompass the majority of the SICAP target groups (see Chapter 3).
With regard to these particular forms of social disadvantage, this study addresses
the following questions.
1. To what extent do personal characteristics and location vary with the particular barrier
to social inclusion being reported?
2. Do the characteristics of individuals reporting various forms of barriers to social
inclusion vary according to the associated area deprivation level or does targeting
make such spatial factors irrelevant?
3. What are the key characteristics of individuals reporting multiple, as opposed to single,
forms of disadvantage?2 | Pr of i l in g B a r r i er s t o So c ia l In clu s io n i n I r ela n d
4. Does the intensity of reported social barriers vary spatially?
From a policy perspective, the research provides evidence relating to the
individual profiles most commonly observed among individuals reporting
particular barriers to social inclusion and also examines the extent to which
spatial factors, specifically the area-level deprivation and urban/rural controls,
remain relevant within a highly targeted policy context. Furthermore, the study
examines the extent to which personal characteristics and area-level deprivation
impact the relative risk of individuals reporting each of these barriers. Given that
these barriers reflect select target groups, the research will allow bodies such as
government departments and Pobal to further tailor programmes and resources
to the needs of individuals experiencing different forms of disadvantage. Given
that SICAP expenditure is not exclusive to areas of high deprivation, we are also
interested in the extent to which SICAP can effectively identify individuals
experiencing barriers in more affluent areas. While it is recognised that the
occurrence of barriers to social and economic inclusion may be lower in more
affluent areas, effective implementation suggests that Programme Implementers
(PIs) should still be accessing individuals facing these difficulties irrespective of
area-level deprivation.
The report is structured as follows. Chapter 2 reviews the literature on the key
factors associated with the specific forms of disadvantage being considered;
Chapter 3 provides detail on the SICAP programme, its funding mechanism and
targeting strategy; Chapter 4 discusses the data and methodology; Chapter 5
addresses the results from the specific research questions; and a summary and
conclusions are provided in Chapter 6.International evidence | 3
CHAPTER 2
International evidence
In 2010 the European Commission, as part of the Europe 2020 strategy for smart,
sustainable and inclusive growth, set a target to reduce the number of people
subject to poverty and social exclusion by 20 million. In addition, it was proposed
to raise the employment rate of those aged 20–64 to 75 per cent. In any society,
ensuring that all individuals have the opportunity and support to prosper, both
economically and socially, is a priority for government. However, in order for the
Irish government to succeed in meeting this challenge it is necessary to
understand exactly what the main barriers to economic and social inclusion are
within Ireland. This report discusses the five key barriers outlined above: jobless
households, lone parents, homeless or those affected by housing exclusion,
disability and ethnicity. While we do not assert that these are the only, or even
the primary, barriers to inclusion within an Irish context, they do reflect some of
the principal constraints that underpin Ireland’s most prominent strategy against
social exclusion, i.e. SICAP.
2.1 JOBLESS HOUSEHOLDS
At least half of those living in jobless households in the majority of EU countries
are either income poor or deprived2 (de Graaf-Zijl and Nolan, 2011). Ireland has
one of the highest rates of jobless households in the EU. The proportion of
persons aged 0–59 living in jobless households in the second quarter of 2017 was
11 per cent (Central Statistics Office (CSO), 2017).3 In 2010, the percentage of
households that were jobless stood at 22 per cent, which was double the EU-15
average of 11 per cent (Watson et al., 2012). Those living in jobless households
were most likely to be lone parents, to have few or no education qualifications, to
have a disability and to live in households where no member has ever worked.
The combination of these factors makes those living in jobless households
particularly susceptible to poverty and social exclusion. There is also some
regional disparity, with almost 23 per cent of jobless households located in the
Border region, but only 14 per cent in the Mid-East region (O’Rorke, 2016).
Nickell (2004) argues that a decrease in demand for low-skilled labour explains
the rise in workless households within the UK; however, few causal explanations
have been forwarded to explain the high occurrence in Ireland.
2
Deprivation is based on nine questions related to whether the individual does not own a colour TV, does not
own a telephone, does not own a washing machine, does not own a car, cannot afford a meal with meat or
fish or vegetarian equivalent every second day, cannot afford to keep home warm, is in arrears on
rent/mortgage or loans or utility bills, or can’t afford one week annual holiday away from home. The authors
use a threshold of four in deciding whether an individual is materially deprived or not.
3
See http://www.cso.ie/en/releasesandpublications/er/qnhs-fu/qnhshouseholdsandfamilyunitsq22017/4 | Pr of i l in g B a r r i er s t o So c ia l In clu s io n i n I r ela n d
In 2015, the European Commission issued a Country Specific Recommendation to
Ireland which referred to the household joblessness and low work intensity
issue.4 Almost 1 in 5 (19 per cent) of people in Ireland in 2015 belonged to Very
Low Work Intensity (VLWI) households, which measures people aged 0–59 years
only living in households where adults worked less than 20 per cent of the total
work potential over one year. The European Commission suggested that in order
to combat the high degree of jobless households in Ireland the government
should slowly reduce benefit payments, so that individuals are not discouraged
from working due to a loss of benefits once they enter employment. The
government recently launched Pathways to Work 2016–2020, which aims to
increase employment within jobless households by making work more rewarding
with the help of the Housing Assistance Payment and the Single Affordable
Childcare Scheme. However, there are two worrying trends with jobless
households: firstly, those in jobless households are just over half as likely to enter
employment as an individual from a working household (Watson et al., 2016);
secondly, during the recovery after the recent Great Recession, the proportion of
jobless households obtaining a job did not keep pace with the general rise in
employment, suggesting that getting those from jobless households into
employment may require more than just creating jobs. The low transition into
employment and the fact that other members in the household are less likely to
have ever worked suggest that joblessness may become culturally embedded
within the household, which can lead to a high degree of intergenerational
transmission of jobless households. Headey and Verick (2006), using Australian
data, found that people who lived in jobless households at age 14 were more
likely to be welfare dependent and in poverty later in life.
2.2 LONE PARENTS
Lone parents consistently rank as the group most vulnerable to poverty and social
exclusion in Ireland (Watson et al., 2016). In 2014, 58 per cent of lone parents in
Ireland were at risk of poverty or social exclusion, compared to only 35 per cent
in Sweden (European Institute for Gender Equality (EIGE), 2016). Their high
poverty rates may be partly driven by low employment rates. In 2016, only 56.4
per cent of lone parents were in employment compared to 74.4 per cent of two-
parent households (CSO, 2017). It is not clear what the mechanisms driving low
employment levels are, but it could be that lone parents prefer to stay at home
and look after their children, or alternatively, it may be the case that they just
cannot find a suitable job or affordable childcare. It may also be due to the fact
that 43 per cent of lone parents in Ireland have at most lower secondary
education, which is higher than the EU average with the corresponding
4
The CSR in 2015 said: ‘Take steps to increase the work intensity of households and to address the poverty risk
of children by tapering the benefits and supplementary payments upon return to employment and through
better access to affordable childcare.’International evidence | 5 proportion, for example, in Slovakia at just 7 per cent (Chzhen and Bradshaw, 2012). Low education levels mean that the jobs available to lone parents often do not pay enough to justify forgoing welfare payments. Consistent with this hypothesis, Zagel (2014), using German and British data, finds that lone parents with at least tertiary education are more likely to be employed than their lower educated counterparts. This poverty trap is made substantially worse in Ireland by the high level of childcare costs. The cost of childcare in Ireland is one of the highest in Europe, representing about 45 per cent of the average wage (EIGE, 2016). High childcare costs have been noted by the European Commission, in a country-specific recommendation to Ireland, as a substantial barrier to female labour market participation. In addition to barriers to employment, lone parents are more likely to suffer from mental stress compared to those with a partner (Watson et al., 2016). 2.3 HOMELESS OR AFFECTED BY HOUSING EXCLUSION The level of homelessness in Ireland has increased substantially over the past year. In January 2017 there were 1,172 homeless families in Ireland, with that figure rising to 1,530 by November 2017. Of the homeless families in November, 946 (62 per cent) were single-parent families (Department of Housing, Planning and Local Government (DHPLG), 2017a). The rise in homelessness is thought to be driven both by a sharp increase in rents after the recession and by the low supply of housing in Ireland. Not having a home constitutes one of the most severe consequences of poverty and leads to a vicious cycle of economic and social exclusion. Those who do not have a permanent address will struggle to find employment, as employers are reluctant to hire individuals with no fixed address. In addition, there can be difficulties associated with basic banking and the ability to obtain loans and, therefore, individuals may be forced into accessing black market finance and spiralling debt. Homeless individuals will find it difficult to feel part of their community and are also likely to experience many forms of prejudice (Phelan et al., 1997). Some other individuals in society face housing difficulties and live in constant worry of losing their home; for example, Focus Ireland (2016) found that almost one-third of individuals worry about and/or struggle to pay their rent every month. This is not without due cause, as 1694 homes were repossessed in 2016 – the highest number to date (Central Bank, 2017). In July 2016, the government launched the Rebuilding Ireland initiative, an action plan for housing and homelessness with the target to ensure that everyone has access to a home (DHPLG, 2017b). 2.4 DISABILITY Across the EU-28 almost 40 per cent of individuals with a disability face risk of poverty or social exclusion (EIGE, 2016), while for Ireland this figure is even higher
6 | Pr of i l in g B a r r i er s t o So c ia l In clu s io n i n I r ela n d

             at almost 50 per cent (Watson et al., 2016). Disabled individuals may be
             particularly susceptible to social exclusion if they cannot participate in local
             events due to inadequate facilities or the fact that they are reluctant to join a
             group for fear of being discriminated against. Gannon and Nolan (2006) find that
             disabled individuals are significantly less likely to engage in social activities as
             measured by participation in a club, evenings out, or meeting individuals on a
             regular basis. Individuals with a disability are only about half as likely to be in
             employment as those who do not have a disability (Watson and Nolan, 2011).
             This may be partly driven by low education levels. For example, 43 per cent of
             individuals with a disability had not progressed beyond primary education
             compared with 19 per cent of all adults (CSO, 2007a). Over one-third of
             individuals with disabilities who were not employed indicated that they would
             like to work if the conditions were right (CSO, 2012). Many individuals may not
             actively search for employment, for a variety of reasons including fear of losing
             welfare payments, lack of knowledge of suitable jobs and/or employer
             discrimination (CSO, 2007b). Disabled individuals also face direct monetary costs
             in terms of paying for disability-related goods and services and thus require extra
             income in order to have the same standard of living as an equivalent non-
             disabled person. Cullinan and Lyons (2015) find that the extra economic cost in
             Ireland is large (35.4 per cent of income or €207 per week) and varies according
             to the severity of the disability; they note that measures of poverty which use
             income as a proxy will tend to underestimate the level of poverty for a disabled
             person.

             In 2015, in order to provide a more inclusive society for individuals with a
             disability, the government launched the Comprehensive Employment Strategy for
             People with Disabilities 2015–2024 (Department of Justice and Equality, 2015).
             The initiative is designed to support disabled individuals who are sufficiently able
             and would like to work. The strategy is focused on making work pay,5 engaging
             employers, building skills, providing coordinated support and promoting job
             retention and re-entry. There is also a target to increase the number of
             individuals employed in the public sector who have a disability from 3 per cent to
             6 per cent.

             2.5        ETHNIC MINORITIES
             Those with a different ethnicity or cultural background such as Travellers, Roma,
             refugees or asylum seekers may face particular barriers to social and economic
             integration. This is due to a number of factors including low education levels, a
             nomadic lifestyle and prejudice or discrimination. The levels of education of these
             groups is particularly low. For example, only 1 per cent of Travellers have a

5
 The central question addressed by the ‘Make Work Pay Group’ was whether the net financial outcomes for
recipients of employment participation act as barriers or enablers to employment.
International evidence | 7 college degree compared to 30 per cent of non-Travellers (Watson et al., 2017). In 2014, Eurostat found that 40 per cent of adults born in a country outside the EU-28 were at risk of poverty or social exclusion; another report found that nine out of ten Roma men and women were living in poverty (EIGE, 2016). On average across EU countries, just 21 per cent of Roma women and 35 per cent of Roma men were in employment in 2014, while 42 per cent did not have adequate housing (FRA, 2014). In June 2017, the Irish government launched the National Traveller and Roma Inclusion Strategy 2017–2021 (Department of Justice and Equality, 2017), which aims to improve the lives of the Traveller and Roma communities in Ireland. These groups are also vulnerable to discrimination when applying to rent private housing. For example, EUMC (2005) found that in several countries within the EU, including Ireland, minorities are sometimes explicitly asked not to apply. These factors are likely to increase feelings of isolation and exclusion among the affected groups and also force them into sub-standard accommodation. Asylum seekers and refugees are particularly vulnerable to poverty and social exclusion due to the traumatic and psychological distress endured and poor health. Almost half of refugees and asylum seekers coming to the EU are between the ages of 18 and 34, while 25 per cent are children (Benifei, 2016). There is a clear need to provide training and education in order to improve labour market integration levels among these groups. Barrett and Duffy (2008) found evidence of a lack of integration of immigrants into the Irish labour market, which they suggest may be due to language skills or the non-transferability of qualifications. It is likely that Roma people, refugees and asylum seekers will also face these barriers to economic integration. In addition, non-documented or illegal ethnic minorities are particularly vulnerable to labour exploitation. Their precarious resident status may lead them to accept low pay, long hours and poor working conditions (Arnold et al., 2017). Some small-scale interviews have been carried out in Ireland with refugees; a report by Galway City Council on 23 one-on-one interviews found that ‘asylum seekers and refugees did not feel integrated in this country, either because there were few opportunities to meet Irish people or because of language barriers. Some felt discriminated against’ (Stewart, 2006).
8 | Pr of i l in g B a r r i er s t o So c ia l In clu s io n i n I r ela n d

CHAPTER 3
The SICAP programme
             SICAP aims to tackle poverty, social exclusion and inequality through local
             engagement and partnerships between disadvantaged individuals, community
             organisations and public sector agencies. The programme is funded and overseen
             by the Department of Rural and Community Development (DRCD)6 and Pobal. It is
             co-funded by the European Social Fund (ESF), including a special allocation under
             the Youth Employment Initiative (YEI), with a total programme budget for 2016 of
             €35.8 million. It was rolled out on 1 April 2015 and ran until 31 December 2017.
             The goals of SICAP are as follows (Pobal, 2016):

             1    Strengthening local communities: to support and resource disadvantaged communities
                  and marginalised target groups to engage with relevant local and national stakeholders
                  in identifying and addressing social exclusion and equality issues (Social inclusion and
                  capacity building);

             2    Promoting lifelong learning: to support individuals and marginalised target groups
                  experiencing educational disadvantage so they can participate fully, engage with and
                  progress through lifelong learning opportunities through the use of community
                  development approaches (Lifelong learning);

             3    Helping people become more job ready: to engage with marginalised target
                  groups/individuals and residents of disadvantaged communities who are unemployed
                  but who do not fall within mainstream employment service provision, or who are
                  referred to SICAP, to move them closer to the labour market and improve work
                  readiness, and support them in accessing employment and self-employment and
                  creating social enterprise opportunities (Employment).

             SICAP is the successor programme to the Local and Community Development
             Programme (LCDP). It is a national programme that is led in each county by a
             Local Community Development Committee (LCDC). Following a public
             procurement process, contracts for the implementation of the new programme
             have been awarded by LCDCs to 45 Programme Implementers (PIs) covering 51
             geographic areas (Lots).

             The distribution of funds is partially determined by the Resource Allocation
             Model (RAM), which was developed for Pobal based on the Pobal HP Deprivation
             Index (SA). This deprivation index provides a method of measuring the relative
             affluence or disadvantage of a particular geographical area using data compiled
             from various censuses. It is used as a key resource to enable a targeted approach

6
 The responsibility for SICAP was previously with the Department of Housing, Planning and Local Government
(DHPCLG) but was moved in June 2017 to the Department of Rural and Community Development (DRCD).
The SICAP programme | 9 towards tackling disadvantage, by providing local analysis of the most disadvantaged areas nationwide. Percentage data for each area are provided under a range of categories such as unemployment, educational attainment and population change. There is no detail regarding the extent to which the RAM has been implemented under the current SICAP programme. However, a description of how the predecessor LCDP was available is given by Haase and Pratschke (2013). The RAM distributes resources across 51 Lot areas. The RAM is a spatial tool that is designed to allocate resources to Local Development Companies (LDCs) based on three key criteria. The three factors at the heart of the RAM are (a) the relative size of the target population, (b) its demographic profile, and (c) the relative deprivation index of the population. The model is essentially intended to skew the distribution of resources towards areas with a greater concentration of need The extent of targeting is fundamentally a policy choice, and four model options are available using the RAM (Haase and Pratschke, 2013). Under Model 1, resources are distributed according to population share. Under Model 2, resources are targeted at the bottom 48 per cent of the most disadvantaged population. Model 3 targets the bottom 22 per cent of the most disadvantaged population, while Model 4 targets the bottom 7 per cent. Based on the available documentation, the Medium Deprivation model (Model 3) was implemented under the LCDP programme. It is clear that if SICAP funding was to be allocated solely on the basis of the RAM, this would generate higher rates of total expenditure per head of population in some deprived areas. Information was available on total expenditure by 51 Lot areas and previous analysis confirmed a positive relationship between the level of deprivation and the Lot expenditure per head of population (McGuinness et al., 2016). We find that approximately 30 per cent of SICAP participants live in small areas that are classified as disadvantaged, whereas approximately 14 per cent of the population nationwide live in small areas that are classified as disadvantaged. While this suggests that SICAP funds are disproportionately targeted towards areas of social disadvantage, we would expect the share allocated to disadvantaged areas to be somewhat greater than 30 per cent if distributed purely on the basis of the RAM (Model 3). Our understanding is that the distribution of funding is based largely on historical patterns and that the RAM application to date has been primarily to ensure that funding reductions were distributed away from areas of social disadvantage. In terms of the programme administration, PIs’ spending should be split evenly, with a 5 per cent leeway (28–38 per cent), across the three goals: (i) social inclusion and capacity, (ii) lifelong learning and (iii) employment. For individuals
10 | Pr o fi l i n g Ba r ri e r s t o So ci a l In c l u si o n i n Ir e l a nd
to be eligible for programme assistance under any of these goals, they should
qualify under one or more of the 11 target groups:
children and families from disadvantaged areas;
lone parents;
new communities (including refugees and asylum seekers);
people living in disadvantaged communities;
people with disabilities;
Roma;
the unemployed (including those not on the Live Register);
low income workers/households;
Travellers;
young unemployed people from disadvantaged areas;
young people aged 15–24 who are not in employment, education or training (NEETs).Data and methodology | 11
CHAPTER 4
Data and methodology
The Integrated Reporting and Information System (IRIS) is an administrative data
capture system that is used by SICAP PIs when registering individuals for SICAP
supports. IRIS contains information about individuals, such as age, gender,
education and economic status of all SICAP participants; in addition, data are
recorded on the activities and training provided to individuals under the
programme. Table 1 shows the individual-level characteristics such as gender, age
and education most common among SICAP participants and the degree to which
they vary across the lifelong learning and employment goals. Of all SICAP
participants in 2016, 55 per cent were male and 45 per cent were female. Males
were more likely to be assisted with employment, while females were more likely
to be assisted with lifelong learning opportunities.
TABLE 1 COMPOSITIONAL DISTRIBUTION OF SICAP CLIENTS BY PROGRAMME GOALS (PER
CENT)
Variable Lifelong Learning Employment Total
Goal 2 Goal 3
Gender
Male 43 63 55
Female 57 37 45
Age
15–24 20 13 16
25–35 24 29 27
36–45 22 29 26
46–55 19 21 20
Over 55 15 8 11
Education
NFQ12 | Pr o fi l i n g Ba r ri e r s t o So ci a l In c l u si o n i n Ir e l a nd
employment, while the very young (aged 15–24) and those approaching
retirement (aged 56–65) are more likely to receive lifelong learning supports. In
terms of education, more than two-thirds of SICAP participants have at most
secondary education, i.e. have obtained a leaving certificate or less (NFQ ≤5).
More specifically, 32 per cent have below an upper-secondary education (NFQ
5) are more likely to receive
employment supports, as opposed to lifelong learning. Those with less than
secondary education are more likely to be assisted with lifelong learning, while
there is not much difference across programme goals for those with secondary
education. Overall, there are more individuals supported with employment than
with lifelong learning opportunities.
A number of target groups, along with individuals who are living in disadvantaged
areas, have been prioritised (Pobal, 2016). Specific target groups are:
children and families in disadvantaged areas;
lone parents;
NEETs (young people aged 15– 24 years who are not in employment, education or
training);
new communities (including refugees/asylum seekers);
people living in disadvantaged communities;
people with disabilities;
Roma;
the unemployed (including those not on the Live Register);
Travellers;
low income workers/households;
young unemployed people living in disadvantaged areas.
With regard to the IRIS data, while these 11 target groups are specified under the
programme, we have adopted in this analysis a focus on five tangible measures of
barriers to social and economic inclusion: (i) belonging to a jobless household, (ii)
being a lone parent, (iii) having a disability, (iv) being homeless or affected byData and methodology | 13
housing exclusion and (v) ethnic minority. This reflects both the objectives of
SICAP and the broader international policy literature discussed in Chapter 2.
In terms of the data, it is important to recognise that a proportion of individuals
will qualify for assistance under SICAP without reporting any of these specific
barriers. For instance, individuals living in disadvantaged communities (as
measured by the Pobal HP Deprivation Index (SA)), young people who are NEETs,
those who are unemployed, members of low-income households and new
communities will all qualify for assistance under the programme. In the data for
2016, around 40 per cent of SICAP participants qualify for assistance without
reporting any of our identified five barriers and this group will constitute our
reference category. This reference category will consist of young people and
parents living in disadvantaged communities, members of low income
households, the unemployed and members of new communities not reporting
any of the five barriers.8 Using this reference category enables us to assess the
extent to which various risk factors and characteristics impact the relative risk of
experiencing each of the five barriers in a way that allows for the highest level of
comparability across each risk category. Finally, it is important to note that while
some of the SICAP target groups are not reflected explicitly in the barriers, they
are reflected in our models as control variables; for example, spatial disadvantage
measures, age, NEETs, unemployment durations and migrant status.
The objective of the study is to examine the extent to which personal
characteristics and area-level deprivation impact the relative risk of individuals
reporting each of these barriers. Given that these barriers reflect select target
groups, the research will allow bodies such as government departments and
Pobal to further tailor programmes and resources to the needs of individuals
experiencing different forms of disadvantage. For example, if we find that jobless
households are predominantly experienced by young people with low levels of
schooling in rural areas, this would require a different policy approach to
targeting those with a disability if we find this issue is predominantly experienced
among older people with higher levels of schooling in urban areas.9 Furthermore,
given that SICAP expenditure is not exclusive to areas of high deprivation, we are
also interested in the extent to which SICAP can effectively identify individuals
experiencing barriers in more affluent areas. While it is recognised that the
occurrence may be lower in more affluent areas, effective implementation
suggests that PIs should still be accessing individuals facing these difficulties
irrespective of area-level deprivation. If we find that the personal characteristics
of individuals reporting particular barriers are broadly similar across areas of high
8
Of this 40 per cent, approximately one-quarter are from disadvantaged areas, allowing them to qualify for
assistance under the SICAP programme.
9
The questions related to barriers can be regarded as ‘sensitive’ questions and there is a possibility that some
individuals will choose not to disclose this information.14 | Pr o fi l i n g Ba r ri e r s t o So ci a l In c l u si o n i n Ir e l a nd
and low deprivation, this would suggest that targeting is effective.
Nevertheless, despite the existence of targeting, we would expect that the profile
of the client base will vary from area to area based on the particular demographic
and social factors that are at play in a particular Lot. Given that employment is
one of the three SICAP goals and that funding must be relatively evenly spread
across all goals, we would expect PIs to have a broadly similar share of
unemployed claimants as part of their client base. However, for other barriers
not specifically related to the goals, such as the existence of lone parents, people
with disabilities, homeless individuals, and persons from minority groups, we
might expect to see more variation across Lots. This suggests that some PIs are
likely to have more disadvantaged clients in their populations, which would
suggest that the average intensity of interventions will also be significantly higher
than for others. It is difficult to test this hypothesis using the existing data;
however, we were able to cross-tabulate the proportion of SICAP clients at a Lot
level who were lone parents or who had disabilities with the population-level
incidences from the 2016 census (see Figures 1 and 2).
FIGURE 1 HOW DID THE SHARE OF LONE PARENT CLIENTS VARY WITH THE POPULATION SHARE OF LONE
PARENTS AT LOT LEVEL IN 2016?
.25
Share of Lone Parent Clients
.05 .1 0 .15 .2
.1 .2 .3 .4
Share of Lone Parents in Population
Lone Parent Share 95% CI
Fitted valuesData and methodology | 15
FIGURE 2 HOW DID THE SHARE OF SICAP CLIENTS WITH DISABILITIES VARY WITH THE POPULATION
SHARE OF INDIVIDUALS WITH DISABILITIES AT LOT LEVEL IN 2016?
.2
Share of Clients with Disability
.05 .1
0 .15
.1 .12 .14 .16 .18 .2
Population Share with Disability
Proportion with Disability 95% CI
Fitted values
We can see that the share of clients who are lone parents in a particular Lot will
strongly reflect the share of lone parents in the Lot population. While the
relationship for individuals with disabilities is somewhat weaker, it is also
positive. Therefore, while the different targeting strategies adopted by the
different PIs will certainly affect the client base, it is also clear that the underlying
demographic and social structure of the Lot area represents a driving influence
on the client composition.
To answer our research questions, we make use of two different methods: probit
models and dominance analysis. A probit model is a type of regression model
whereby the dependent variable (variable of interest) is binary; for example, if
the person has a disability or not. This outcome variable is regressed on several
covariates (independent variables) and illustrates the association of each of the
covariates with the dependent variable, while all other covariates are held
constant at their mean values (for more information, see Aldrich and Nelson,
1984). We use a probit model to analyse the probability that an individual
experiences each of the five barriers or not. We also use it to understand the
effect of the various characteristics in explaining the probability that an individual
will report a particular barrier (or multiple barriers). The covariates (or
characteristics) that we include are as follows: age, small-area deprivation index,
education level, nationality, whether the individual aged 15–24 is NEET, lives in a16 | Pr o fi l i n g Ba r ri e r s t o So ci a l In c l u si o n i n Ir e l a nd
rural area or not,10 and length of time on live register. Age is categorised as: less
than 25 years old, 25 to 35, 36 to 45, 46 to 55, or 55 to 65. The small-area
deprivation index measures the relative affluence or disadvantage of an area
using information from previous censuses (Haase and Pratschke, 2013). Education
is composed of four categories denoting whether the individual has less than
upper-secondary education (NFQResults | 17
CHAPTER 5
Results
This chapter includes an examination of the occurrence of individual barriers and
the most common combinations of barriers reported by SICAP participants. We
investigate the distribution of individual barriers (one or more) experienced
across Lot deprivation levels and evidence of targeted approaches at Lot level. It
also presents a comprehensive analysis of the risk of individuals experiencing
barriers to full economic and social inclusion. Our multivariate regression analysis
approach attempts to determine the complex relationships in order to explain
how elements across a multitude of variables respond simultaneously to changes
in other variables. This analysis examines the determinants (using personal
characteristics and area-based measures of deprivation) of each individual barrier
reported across goal type (lifelong learning and employment) and small areas
with differing deprivation levels. In addition, this chapter examines the key
characteristics of individuals reporting multiple barriers, as opposed to single
barriers, to social and economic inclusion.
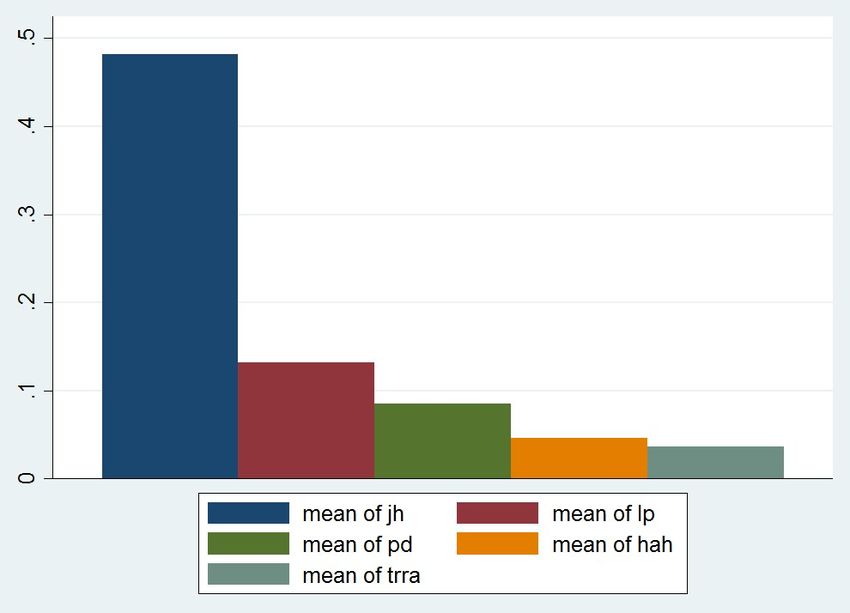
Table 2 summarises the occurrence of the various social barriers at the individual
level. The highest rate applies to jobless households (over 40 per cent) while the
reported incidence of the other barriers is relatively low. As stated above,
approximately 40 per cent of SICAP respondents did not report any of the five
barriers included in this analysis.
TABLE 2 SUMMARY OF SOCIAL BARRIER INFORMATION FROM SICAP PARTICIPANTS, 2016
(PER CENT)
Barrier Yes No No response
Jobless household 41.96 45.04 13.00
Lone parent 11.70 77.33 10.97
Person with disability 6.84 73.85 19.31
Homeless or affected by housing exclusion 3.85 80.51 15.64
Ethnic minority 3.58 85.54 10.88
Number of total observations 47,511
Notes: ‘Ethnic minority’ includes members of the Travelling Community, Roma, refugees and asylum seekers.
For each social barrier, approximately 14 per cent of cases exist where ‘no
response’ was recorded or where the response was blank,12 potentially creating
problems around sample representativeness. To investigate this further, non-
12
We have treated responses where the recording was ‘blank’ in a similar way to ‘non-response’ due to
feedback from Pobal that in such cases the person did not give consent to the recording of sensitive
information. Both appear in Table 2 as ‘No response’.18 | Pr o fi l i n g Ba r ri e r s t o So ci a l In c l u si o n i n Ir e l a nd
response was analysed with a probit model, relating non-response to gender,
age, nationality, NEET status, urban/rural location, live register duration, small-
area deprivation levels and Lot area variables (see Table A1 in Appendix).
Differences between Lot area and PI completion procedures regarding the
recording of information on IRIS were found to have the largest effect on non-
response, while individual characteristics appear to be much less important, with
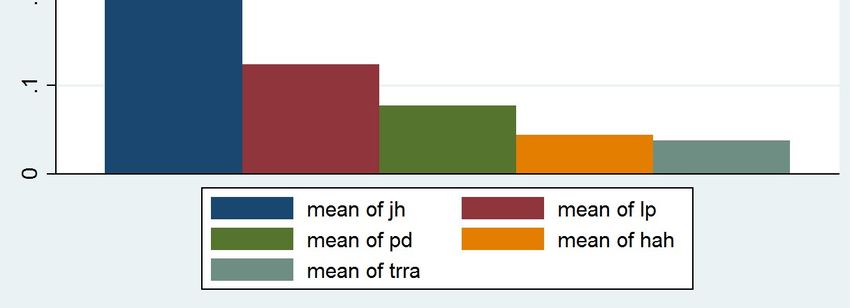
very small marginal effects. Furthermore, we have a large representative
workable sample of 33,697 participants (71 per cent of all participants) when we
restrict our sample to consider only those who responded to all the questions
relating to the five barrier categories (see Figures 3 and 4). It is clear from Figures
3 and 4, and the results of our probit model, that our sample is highly
representative of the SICAP population.
FIGURE 3 (BELOW LEFT) SOCIAL BARRIER INFORMATION FOR ALL 47,511 OBSERVATIONS
FIGURE 4 (BELOW RIGHT) SOCIAL BARRIER INFORMATION FOR SAMPLE OF 33,697 COMPLETED
OBSERVATIONS (71 PER CENT)
Notes: jh, jobless household; lp, lone parent; pd, person with a disability; hah, homeless or affected by housing exclusion;
trra, Travellers, Roma, refugees and asylum seekers.
Table 3 shows the number of barriers reported by individuals accessing SICAP
education and training programmes. Approximately 55 per cent of individuals
report either one or two barriers, while 42 per cent report none of the five
barriers. The table also shows that there is a low frequency of individuals
reporting multiple barriers, with less than 3 per cent of individuals reporting
three or more.Results | 19
TABLE 3 BARRIERS TO FULL ECONOMIC AND SOCIAL INCLUSION REPORTED BY SICAP
CLIENTS, 2016
Number of barriers reported Frequency Percentage Cumulative percentage
0 14,231 42.23 42.23
1 13,842 41.08 83.31
2 4,792 14.22 97.53
3 755 2.24 99.77
4 75 0.22 99.99
5 2 0.01 100.00
Total 33,697 100.00 100.00
Table 4 shows the most common combinations of barriers reported by
participants. In total, 31 combinations of the five specific barriers were reported;
the top eight combinations in Table 4 account for 95 per cent of all participants.
TABLE 4 COMBINATIONS OF BARRIERS REPORTED BY SICAP PARTICIPANTS, 2016
Barriers reported Frequency %
1 None 14,231 42.23
2 Jobless household 11,115 32.99
3 Jobless household and lone parent 2,259 6.70
4 Lone parent 1,164 3.45
5 Jobless household and person with a disability 1,157 3.43
6 Person with a disability 981 2.91
7 Jobless household and ethnic minority 615 1.83
8 Jobless household and homeless or affected by 513 1.52
housing exclusion
9 Other 1,662 4.94
Total 33,697
Notes: Each individual is counted under one heading only. For example, the jobless household category (number 2)
includes individuals who report being members of a jobless household but no other barrier.
Table 5 describes the combinations of barriers by gender and reveals differences
across males and females. While similar proportions of males and females
(around 42 per cent) report no barriers and both report jobless household as the
most common barrier, more males (40 per cent) than females (24 per cent)
report being in a jobless household. However, females are more likely to report
multiple barriers. For example, Table 5 shows that 12 per cent of females are in a
jobless household and are lone parents, relative to 2.5 per cent for males.You can also read