Project Report Strengthening National Policy Capacities for Jointly Building the Belt and Road towards the Sustainable Development Goals - the ...
←
→
Page content transcription
If your browser does not render page correctly, please read the page content below
Project Report
Strengthening National Policy Capacities for Jointly
Building the Belt and Road towards the Sustainable
Development Goals

                       June 2021
This report was prepared under the capacity development activities of the Development Policy Branch of the
Economic Analysis and Policy Division within the United Nations Department of Economic and Social Affairs. The
project was The Project is funded by the UN Peace and Development Trust Fund (UNPDF): "2030 Agenda for
Sustainable Development Sub-Fund" (2030 ASD Sub-Fund), and aims to contribute to strengthening the effects of
international development cooperation under the Belt and Road on the achievement of the 17 SDGs in the
participating countries, with positive spill-overs to the achievement of the SDGs in the rest of the world. Substantive
contributions from Giorgi Abashishvili, Mya Lwin Lwin Aung, Thuta Aung, Enkh-Amgalan Byambajav, Santi
Chaisrisawatsuk, Marko Danon, Eugenia Gusilov, Dawn Holland, Jaromir Hurnik, Elnur Ibrahimov, Mahfuz Kabir,
Aibek Kadyraliev, Kassymkhan Kapparov, Alma Kudebayeva, Dominique Lam, Yin Yin Nwe, Runsinarith Phim, Vanxay
Sayavong, Ganga Tilakaratna, Mahtab Uddin and David Vavra are gratefully acknowledged. Support on dissemination
from Terri Lore, Nayeon Park and Xiao Dong are acknowledged with thanks. Namsuk Kim, Lin Yang, Wen Shi, Felipe
Morgado, Sancha Foreman, Vito Intini, Roland Mollerus and Pingfan Hong provided management support for the
project. Sancha Foreman and Matthew MacGeoch were responsible for the typesetting. For more information,
please contact Namsuk Kim, Projects Coordinator, EAPD/DESA (kimnamsuk@un.org). The content, findings,
interpretations and conclusions of the project report do not necessarily represent the views of the United Nations.

                                                          2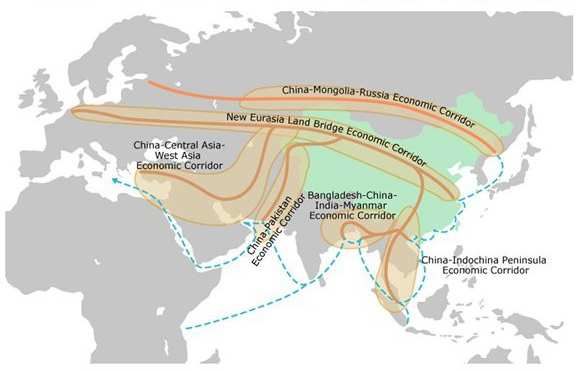
Contents
Abbreviations ............................................................................................................................................... vi
Executive summary ....................................................................................................................................... 1
1. Background and rationale ..................................................................................................................... 6
1.1. The 2030 Agenda and the Belt and Road Initiative ...................................................................... 6
1.1.1. The 2030 Agenda .................................................................................................................. 6
1.1.2. The Belt and Road Initiative.................................................................................................. 7
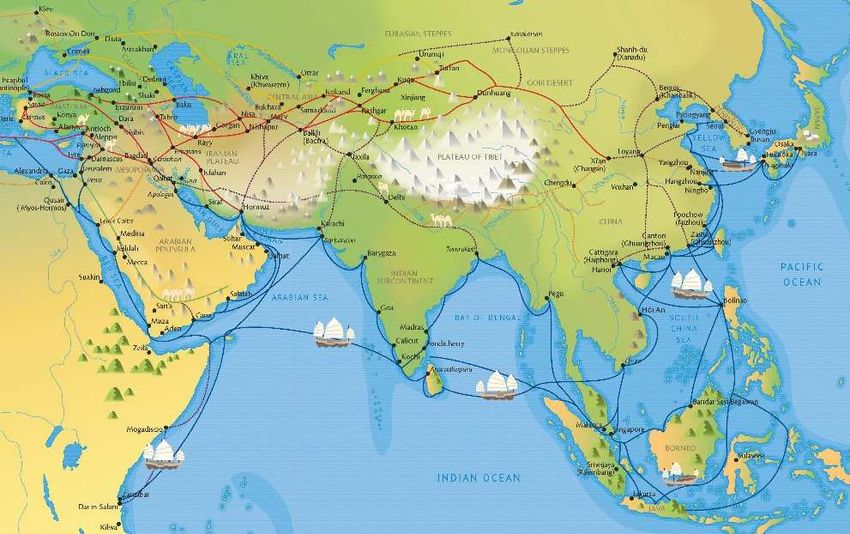
Box 1. The Silk Road........................................................................................................................... 8
1.2. The BRI-SDGs project .................................................................................................................. 12
2. National contexts ................................................................................................................................ 14
2.1. Overview of the 14 project countries ......................................................................................... 14
2.1.1. Economies ........................................................................................................................... 14
2.1.2. People ................................................................................................................................. 16
2.1.3. Environment........................................................................................................................ 19
2.1.4. Progress towards the SDGs ................................................................................................. 20
2.2. Development contexts ................................................................................................................ 23
3. Analysis of BRI progress in the project countries ............................................................................... 28
3.1. Overview ..................................................................................................................................... 28
3.1.1. Cooperation framework and policy coordination............................................................... 28
3.1.2. Facilities connectivity: infrastructure and investments ...................................................... 29
3.1.3. Unimpeded trade ................................................................................................................ 34
3.1.4. Financial integration ........................................................................................................... 36
3.1.5. People-to-people bonds ..................................................................................................... 36
3.2. Challenges and opportunities ..................................................................................................... 40
3.2.1. Challenges in trade and investment ................................................................................... 40
3.2.2. Opportunities in trade and investment .............................................................................. 41
3.2.3. Risks related to large infrastructure projects ..................................................................... 41
3.2.4. Governance of BRI projects................................................................................................. 42
3.2.5. Public sentiment and local communities ............................................................................ 444. Findings from the expanded World Economic Forecasting Model..................................................... 45
4.1. The World Economic Forecasting Model .................................................................................... 45
4.2. Project country simulations ........................................................................................................ 46
4.3. Issues highlighted by the WEFM-e process ................................................................................ 60
5. The way forward: harnessing opportunities and managing risks ....................................................... 61
5.1. Ownership, national capacities and policies ............................................................................... 61
5.2. BRI scope, projects and activities................................................................................................ 64
5.3. Coordination, planning, risk management, monitoring and evaluation..................................... 66
5.4. Transparency, communication and public perceptions.............................................................. 70
5.5. Conclusions ................................................................................................................................. 71
References .................................................................................................................................................. 72
List of figures
Figure 1. The Silk Roads: a historical perspective ......................................................................................... 8
Figure 2. Map of the Belt and Road Initiative ............................................................................................... 9
Figure 3. GNI per capita in current United States dollars (Atlas method), 2019 ........................................ 14
Figure 4. Sectoral share of value added, 2019 (percentage of GDP) .......................................................... 15
Figure 5. Percentage of total employment by sector, 2020 ....................................................................... 15
Figure 6. Human Development Index, 2019 ............................................................................................... 16
Figure 7. Life expectancy at birth, 2019 ..................................................................................................... 16
Figure 8. Mean and expected years of schooling, 2019 ............................................................................. 16
Figure 9. Income per capita rank minus human development rank, 2019................................................. 16
Figure 10. Human Assets Index, selected countries, 2020 ......................................................................... 17
Figure 11. Human Capital Index, selected countries, 2020 ........................................................................ 17
Figure 12. Youth not in education, employment or training, 2017–2019 (percentage) ........................... 18
Figure 13. Percentage of the population using the Internet, 2019 ............................................................ 18
Figure 14. Total natural resources rents, 2018 (percentage of GDP) ......................................................... 20
Figure 15. Percentage of the population using safely managed drinking water services and basic drinking
water services, 2017 ................................................................................................................................... 20
Figure 16. 2020 SDG dashboard for the 14 BRI-SDGs project countries .................................................... 21
ivFigure 17. 2020 SDG Index scores for the 14 BRI-SDGs project countries.................................................. 22
Figure 18. 2020 SDG Index rankings for the 14 BRI-SDGs project countries .............................................. 22
Figure 19. SDG 9 Index score for the 14 BRI-SDGs project countries ......................................................... 22
Figure 20. Logistics Performance Index: quality of trade and transport infrastructure ............................. 22
Figure 21. Selected WEFM-e simulations: Azerbaijan ............................................................................... 46
Figure 22. Selected WEFM-e simulations: Bangladesh .............................................................................. 47
Figure 23. Selected WEFM-e simulations: Cambodia ................................................................................. 48
Figure 24. Selected WEFM-e simulations: Czech Republic ......................................................................... 49
Figure 25. Selected WEFM-e simulations: Georgia .................................................................................... 50
Figure 26. Selected WEFM-e simulations: Kazakhstan .............................................................................. 51
Figure 27. Selected WEFM-e simulations: Kyrgyz Republic ........................................................................ 52
Figure 28. Selected WEFM-e simulations: Lao People’s Democratic Republic ........................................... 53
Figure 29. Selected WEFM-e simulations: Mongolia .................................................................................. 54
Figure 30. Selected WEFM-e simulations: Myanmar .................................................................................. 55
Figure 31. Selected WEFM-e simulations: Romania ................................................................................... 56
Figure 32. Selected WEFM-e simulations: Serbia ...................................................................................... 57
Figure 33. Selected WEFM-e simulations: Sri Lanka .................................................................................. 58
Figure 34. Selected WEFM-e simulations: Thailand.................................................................................... 59
vAbbreviations
ASEAN Association of Southeast Asian HDI Human Development Index
Nations
BCE before the Common Era ICT Information and communications
technology
BRF Belt and Road Forum for International ILO International Labour Organization
Cooperation
BRI Belt and Road Initiative IMF International Monetary Fund
CHEC China Harbour Engineering Company LDC least developed country
Ltd.
CMREC China-Mongolia-Russia Economic MoU memorandum of understanding
Corridor
CNEEC China National Electric Engineering OECD Organization for Economic
Co., Ltd. Cooperation and Development
CNY Chinese yuan (renminbi) PET polyethylene terephthalate
CO2 carbon dioxide SDG Sustainable Development Goal
COVID-19 coronavirus disease 2019 UBTZ Ulaanbataar Railway
DESA Department of Economic and Social UNDP United Nations Development
Affairs (United Nations) Programme
EAPD Economic Analysis and Policy Division UNESCO United Nations Educational, Scientific
(DESA) and Cultural Organization
EU European Union UNICEF United Nations Children’s Fund
FDI foreign direct investment WEFM World Economic Forecasting Model
FTA free trade agreement WEFM-e expanded World Economic Forecasting
Model (DESA)
GDP gross domestic product WHO World Health Organization
GNI gross national income $ United States dollar
HAI Human Assets Index € euro
HCI Human Capital Index
viExecutive summary
The Belt and Road Initiative and the 2030 Agenda
In 2013, the Government of China launched the Belt and Road Initiative (BRI) to link countries and seas
across Asia, Europe and beyond with the aim of achieving broadened and deepened cooperation, greater
prosperity, and an open world economy. The five pillars upon which the BRI was established include policy
coordination, facilities connectivity, unimpeded trade, financial integration, and people-to-people bonds.
With 140 participating countries comprising over half of the world’s population and its immense scale and
scope, the BRI can potentially have a global impact.
Although the BRI and the 2030 Agenda for Sustainable Development differ in nature and scope, they share
a vision and a number of basic principles that are similar in many respects. The BRI has the potential to
transform the lives and economies of participating countries. With under ten years left before 2030,
progress towards the realization of the Sustainable Development Goals (SDGs) is not occurring at the speed
or scale required, especially since the COVID-19 pandemic is continuing to undermine the prospects for
sustainable growth across the globe. Aligning the implementation of the BRI with the 2030 Agenda has the
potential to provide a fresh impetus and lead to tangible gains and opportunities for all countries.
The realization of the potential benefits of the BRI is not automatic. In order to harness the opportunities
brought by the BRI to accelerate the achievement of the SDGs, countries need adequate capacity. In this
context, the project entitled “Strengthening national policy capacities for jointly building the Belt and Road
towards the Sustainable Development Goals” (also referred to as the BRI-SDGs project) aims to enhance
national capacities in economic and sustainable development policy formulation, supporting countries in
their efforts to better understand the implications of the BRI and SDGs and formulate policy responses to
maximize benefits and mitigate possible risks. The fourteen BRI countries participating in the project
include Azerbaijan, Bangladesh, Cambodia, Czech Republic, Georgia, Kazakhstan, Kyrgyz Republic, Lao
People’s Democratic Republic, Mongolia, Myanmar, Romania, Serbia, Sri Lanka and Thailand. These
countries represent economies ranging from lower-middle to high income as well as different development
contexts, with the group including four least developed countries (LDCs).
The project is being implemented by the Economic Analysis and Policy Division of the United Nations
Department of Economic and Social Affairs (EAPD/DESA), with funding provided by the United Nations
Peace and Development Fund.
1BRI cooperation and investments
The present report analyses the scope and scale of BRI progress in the project countries in the light of the
Initiative’s five pillars.
The policy coordination mechanisms of the BRI consist mainly of bilateral agreements between China and
participating countries. In addition, the Belt and Road Forum for International Cooperation provides a high-
level platform for dialogue among participating countries. Differences in national definitions of what
constitutes a BRI project pose challenges for cross-country or aggregate analysis. Over the course of the
BRI-SDGs project, there have been initiatives to establish clearer boundaries and categories for BRI
investments.
During the period of the BRI-SDGs project, the BRI has spurred large investments in facilities connectivity,
primarily through infrastructure development across a variety of sectors. Transportation and logistics
infrastructure predominate in BRI investments. The BRI has also served as the impetus for diverse
investments in trade and trade infrastructure, mining, chemical and manufacturing industries, agriculture
and agro-industries, technology transfer, energy (including renewable energy) generation and connectivity,
and the development of information and communications (ICT) technology.
Two issues relevant to the unimpeded trade pillar of the BRI predominate among the project countries.
First, BRI implementation has led to improvements in border trade crossing and processing and to increased
trade turnover with China. Second, nearly all countries report negative trade balances with China; resource-
rich countries—notably Lao People’s Democratic Republic and Kazakhstan—are the exceptions.
The BRI has also had an impact on financial integration between China and participating countries. Some
examples identified in the national reports include investments in the financial sector of BRI countries,
including banks and stock exchanges.
BRI initiatives aimed at strengthening people-to-people bonds have consisted mainly of tourism, training,
sports, and educational exchanges, grant (rather than loan) assistance, and humanitarian assistance. The
BRI generally stimulated increased tourism from China until the outbreak of COVID-19 and the ensuing
pandemic. BRI countries recognize that increased tourist numbers create the need for improved tourism
infrastructure and capacities. Interventions that have had a visible positive impact on the daily life of
communities—including work on bridges, wastewater treatment plants and city water supplies—have also
been shown to make a favourable impression on visitors.
2Challenges and opportunities
The present report identifies challenges, opportunities and risks associated with BRI projects across the 14
programme countries, including with regard to governance and community relations.
Some of the main challenges linked to BRI cooperation relate to trade imbalances and debt burdens.
Negative trade balances with China are a predominant issue, though these have been alleviated to some
extent by the large-scale foreign direct investment (FDI) brought in by the BRI. Policy gaps need to be
addressed in BRI countries for trade to reach its full potential. In a number of countries, Chinese
investments have become a major source of FDI, at times raising the risk of unsustainable debt.
Achieving optimal outcomes from BRI-related opportunities requires strategic planning and coordination.
BRI transport investments have reduced travel times; this has already contributed significantly to expanding
trade, increasing investment and generating employment, which will go a long way towards alleviating
poverty. Complementary policy reforms are required to optimize the positive effects of BRI transport
projects and ensure that the gains are widely shared. Therefore, sound medium-term and long-term
national development plans are a sine qua non for maximizing benefits from BRI collaboration.
The BRI has drawn attention to the risks associated with large infrastructure projects. Large infrastructure
investments involving debt financing entail risks to debt sustainability. Governance risks, including
corruption and failures in public procurement, have been indicated in some BRI-SDGs reports. Large
infrastructure projects are known for exposing countries and communities to environmental risks, and BRI
projects are no exception. Large infrastructure projects are also known to increase social risks and
vulnerabilities. Rigorous environmental and social assessments are necessary prior to project approval, and
an oversight mechanism is needed to ensure that such assessments are not biased towards the entity
implementing the project.
Good governance and effective administration are critical to the success of BRI projects. Some national
reports indicate delays in the start-up of BRI projects and the disbursement of funds—and even the
cancellation of projects. The size and significance of BRI projects require commensurate transparency and
coordination in management and financial reporting. Data on investment and other financial commitments
are often unavailable, and there are limitations to the classification and quantification of BRI investments
within and across countries.
A careful assessment of relations between investors, Governments and local communities is needed to
ensure that public perceptions and reactions surrounding BRI investments remain positive. Reputational
risks will be incurred when political elites or large enterprises gain more from BRI projects than do local
economies. The BRI-SDGs reports recommend expanding the inclusion of local companies in BRI-funded
public investment projects and increasing the use of local skilled labour. Addressing the reputational risks
associated with the BRI requires the effective engagement of all relevant stakeholders, in line with
3international best practice. Host countries should ultimately base decision-making on coherent national
development strategies.
Simulations with the expanded World Economic Forecasting Model
Overall, the findings from the simulations generated by the expanded version of the United Nations World
Economic Forecasting Model (WEFM-e) show that BRI investments can have a positive impact, at least in
the early years. After the initial period, whether BRI investment leads to debt distress or exacts heavy
environmental costs will depend on the effectiveness of the countermeasures adopted by each country;
these could be actions taken to reduce the debt to sustainable levels, enforce existing environmental
legislation, or develop new laws as needed. The transparency, robustness and availability of data on BRI
investments are a matter of concern; available data lack coherence and transparency in terms of the
definition and the value of BRI investments for a given country.
Analysis of BRI progress in the project countries highlights the importance of clearly defining the boundaries
established within the BRI cooperation framework so that better-quality data can enable adequate
macroeconomic modelling and informed policymaking and decision-making.
The way forward: harnessing opportunities and managing risks
The experiences of the 14 project countries provide ideas and suggestions for harnessing opportunities
related to the BRI while also managing risks that could have an impact on progress towards achieving the
SDGs.
The importance of national ownership, capacity and policies stands out. These are required to maximize
synergies between BRI investments and a country’s progress towards SDGs focused on priorities such as
decent work, gender equality, environmental protection and poverty reduction. The benefits from BRI
cooperation cannot be optimized without addressing policy and institutional gaps in the host country. As
an illustration, the WEFM-e simulations for one country show a worsening government debt, budget deficit
and environmental situation after BRI investment inflows end, but the design and implementation of
comprehensive economic and environmental policies would help mitigate these adverse effects, requiring
national ownership and enabling policy frameworks.
Assessment of the scope of BRI projects and activities is key. Using the WEFM-e simulation tool would
enable policymakers and local experts to critically assess the impact of BRI-linked investments—including
the impact of BRI activities on selected SDGs—using an organized, quantitative approach. Countries would
be able to examine BRI activities from the perspectives of both economic growth and sustainable
development, taking into account potential secondary effects. Local capacity could be built through the
training of local experts and the establishment of an online platform through which these experts could
use the WEFM-e independently.
4Effective planning, coordination, risk management, and monitoring and evaluation could resolve many of
the constraints identified in BRI cooperation. Planning for BRI activities, including cross-sectoral planning,
must begin from the project inception stage. Countries need to identify niches for investment where the
BRI could optimally contribute to sustainable growth and development. Policy reforms that enhance the
positive impact of these investments or mitigate the negative impact should be identified at the planning
stage, and risk identification and risk management should also be initiated at this stage. Monitoring and
evaluation—including social, environmental and other key impact assessments—need to be planned as an
integral part of the projects. The WEFM-e simulations highlight debt risks, pointing to the need for careful
monitoring of the debt incurred in BRI projects and the application of adjustment mechanisms for debt
sustainability.
Transparency, communication and public perceptions need to be addressed. Adopting best practices in
transparency would strengthen BRI cooperation. Some BRI-SDGs national reports mention that the
Government lacks mechanisms for the transparent dissemination of data on BRI projects, and this has at
times fuelled public dissatisfaction with the BRI. Good governance practices such as open and transparent
public procurement could mitigate this risk, as could adherence to international norms around
transparency, good corporate governance, and international development cooperation.
The findings from the BRI-SDGs project validate and emphasize the critical importance of institutional
capacity, especially for policy and planning. This is the key factor in determining the success of BRI projects.
In order to optimize their gains, countries must have the institutional capacity to make appropriate policy
decisions and to plan, coordinate and manage BRI cooperation within the context of coherent and
harmonized national development plans. Without such institutional capacity, there will be no
complementarity and far less synergy between the BRI and national socioeconomic development plans and
policies.
The meetings and processes related to the BRI-SDGs project helped strengthen and deepen engagement
between policymakers and experts from participating countries. The intercountry exchanges fostered by
the project and the cross-pollination of ideas and lessons learned are a start, providing stakeholders with
valuable information they can use within their own national contexts. Strengthening institutional capacity,
however, will require longer-term investments and targeted capacity development efforts. The
recommendations provided in this project report can enhance the role of the BRI in building back better,
ensuring a green and resilient recovery from COVID-19, and achieving the SDGs.
51 Background and rationale
1.1 The 2030 Agenda and the Belt and Road Initiative
1.1.1 The 2030 Agenda
The 2030 Agenda for Sustainable Development, adopted by all States Members of the United Nations in
September 2015, sets out a plan of action for people, planet, prosperity, peace and partnership (United
Nations, General Assembly, 2015). There are 17 Sustainable Development Goals (SDGs) that form the core
of the 2030 Agenda, which calls for all countries to come together in a global partnership to end poverty
and other deprivations, improve health and education, reduce inequality, and spur economic growth while
tackling climate change and working to preserve the world’s oceans and forests.
The 2030 Agenda builds on decades of work by countries and by the United Nations. Its carefully negotiated
language of vision, principles, goals, targets and indicators has been informed by previous international
commitments and progress achieved thus far.1 Throughout, the United Nations Department of Economic
and Social Affairs (DESA) has played a key supporting role in the realization of important development
milestones. Today, DESA is the Secretariat for the annual High-level Political Forum on Sustainable
Development, which is the central United Nations platform for follow-up and review of the SDGs.
The 2030 Agenda has a comprehensive scope, spanning the economic, social and environmental
components of sustainable development. Its broad scope and scale require collective action within the
framework of a commensurate range of partnerships. Realizing the objectives articulated in the 2030
Agenda will require the synergy and integration of efforts made by individuals, societies, countries and
regions, framed by a vision that is ambitious yet rooted in pragmatism and lessons learned from past
decades.
With just under ten years left before 2030, progress towards achieving the SDGs is not being made at the
speed or on the scale required. World leaders at the SDG Summit in September 2019 “called for a Decade
of Action and delivery for sustainable development and pledged to mobilize financing, enhance national
implementation and strengthen institutions to achieve the Goals by the target date of 2030, leaving no one
behind” (United Nations, n.d.(c)). The scale and ambition of the 2030 Agenda require intensive global
engagement that brings together Governments, the private sector, civil society, the United Nations system
and other actors and mobilizes all available resources. The implementation of the 2030 Agenda and the
1These include Agenda 21 (Rio de Janeiro, 1992); the Millennium Declaration and the Millennium Development
Goals (New York, 2000); the 2015 Paris Agreement on climate change; the 2015 Sendai Framework for Disaster Risk
Reduction; the 2015 Addis Ababa Action Agenda of the Third International Conference on Financing for
Development; the 1972 Stockholm Declaration and Action Plan for the Human Environment; the Report of the World
Commission on Environment and Development: Our Common Future (Brundtland Report), adopted by the United
Nations General Assembly in resolution 42/187 (December 1987); the 2002 Johannesburg Declaration on Sustainable
Development and the Plan of Implementation of the World Summit on Sustainable Development; and “The future
we want” (Rio+20, 2012).
6achievement of the SDGs will require concrete actions, including the strengthening of international
cooperation, at the global, regional, national and subnational levels by all stakeholders.
In 2020, progress towards the SDGs suffered a major setback from the impact of the coronavirus disease
2019 (COVID-19). On 11 March 2020, the World Health Organization (WHO) declared COVID-19 a
pandemic, and as it has swept across the globe it has had a serious impact on lives and economies. The
scale of the pandemic and the rate of spread are frightening; some 83 million cases and more than 1.8
million deaths were reported for 2020, and by the end of January 2021 the numbers had soared to more
than 102 million cases and 2.2 million deaths (WHO, 2021). Globally, growth slowed down or contracted as
Governments imposed a range of containment measures restricting mobility and economic activity. Trade
plummeted and even bottomed out, picking up to a certain extent for health supplies and equipment.
In response to the COVID-19 pandemic, the United Nations General Assembly adopted resolution 74/270
of 2 April 2020, calling for global solidarity to address the crisis in all its dimensions. In the resolution, the
General Assembly recognizes that the “pandemic requires a global response based on unity, solidarity and
renewed multilateral cooperation” and emphasizes the need for “a coordinated global response to the
pandemic and its adverse social, economic and financial impact on all societies” and for “a sustainable and
inclusive recovery”. The Secretary-General of the United Nations has issued a call to “build back better”—
to support and facilitate the transition towards a sustainable economy as envisioned in the 2030 Agenda
and the Paris Agreement (United Nations Web TV, 2020).
1.1.2 The Belt and Road Initiative
China has emerged in recent decades as a critical stakeholder in global sustainable development. China is
not only the world’s most populous country, but also the world’s second largest economy and a key engine
of growth and trade. The direction of its future development and the degree of its commitment to the
provision of global public goods can have a significant impact on the entire world.
In 2013, China launched the Belt and Road Initiative linking countries across Asia, Europe and beyond. That
year, President Xi Jinping visited Central Asia and South-eastern Asia, where he proposed the initiative of
jointly building the Silk Road Economic Belt and the twenty-first century Maritime Silk Road—which
together came to be known as the Belt and Road Initiative, or BRI (National Development and Reform
Commission, Ministry of Foreign Affairs and Ministry of Commerce of the People’s Republic of China, 2015).
At the China - Association of Southeast Asian Nations (ASEAN) Expo in 2013, Chinese Premier Li Keqiang
noted that development in China could not only benefit the Chinese people, but also bring about more
development and market opportunities for ASEAN countries and other nations around the world. The
Premier also emphasized that this was but a new chapter in the long history of the maritime Silk Road that
China and South-eastern Asia had opened over 2,000 years ago (Li, 2013). The overland Silk Road is likewise
rooted in ancient history (see box 1).
7Box 1. The Silk Road
The Silk Road was not a single road but rather an ancient network of trade routes established formally
during the Han Dynasty of China. The Silk Road network linked the regions of the ancient world in commerce
from around 130 years before the Common Era (BCE), when the Han Dynasty officially opened trade with
the West, to 1453, when the Ottoman Empire boycotted trade with the West and closed the routes (Mark,
2018). General Zhang Qian from China was the man often credited with opening up the first route from
China to the West in the second century BCE (UNESCO, 2021). These routes developed over time according
to shifting geopolitical contexts.
The maritime routes have always held a significant place in the history of China. Before the third century
BCE, a Chinese marine culture started to grow, centred around harbour cities such as Quanzhou (Fujian
Province) on the south-eastern coast of China. Located at the mouth of the Jin River, Quanzhou became
the centre of several maritime roads. From the Qin Dynasty (221-206 BCE) on, navigation started to occupy
an essential place in politics, diplomacy, culture and the economy. Helped by astronavigation and the
monsoon drive, Chinese navigators started to travel to other regions of Asia. Quanzhou became an
important centre for trade between China and distant regions, especially during the Tang Dynasty (618-
907). (ibid.)
Figure 1. The Silk Roads: a historical perspective
Source: UNESCO (2021).
The vast trade networks of the Silk Roads were used for more than just merchandise and commodities.
Population movements along the routes brought about the widespread transmission and development of
knowledge, ideas, religions, cultures and beliefs, influencing the history and civilizations of the Eurasian
peoples. Many of the cities along the Silk Roads developed into centres of culture and learning. (ibid.)
8The BRI is intended to create an open, inclusive and balanced regional economic cooperation architecture.
The primary objectives of the Initiative are to enhance the economic prosperity of the countries along the
Belt and Road, to promote cooperation and exchange between different countries, and to strengthen
peace, development and cultural understanding. For the BRI to meet the interests of all stakeholders, the
countries along the Belt and Road will need to better integrate and coordinate development strategies and
economic policies and to broaden and deepen regional cooperation. The BRI embraces the current drive
towards economic globalization (including a global free trade regime and an open world economy) and
increased cultural diversity and digitalization. (National Development and Reform Commission, Ministry of
Foreign Affairs and Ministry of Commerce of the People’s Republic of China, 2015)
The BRI promotes connectivity between Asia, Europe and Africa and their adjacent seas—and the network
continues to expand. The BRI connects Eastern Asia to Europe and encompasses countries with huge
potential for economic development. The Silk Road Economic Belt focuses on bringing together China,
Central Asia, the Russian Federation and the Baltic region of Europe; linking China with the Persian Gulf and
the Mediterranean Sea through Central Asia and Western Asia; and connecting China with South-eastern
Asia, Southern Asia and the Indian Ocean. The twenty-first century Maritime Silk Road extends from the
coast of China to Europe through the South China Sea and the Indian Ocean along one route, and from the
coast of China through the South China Sea to the South Pacific along the other. On land, the Initiative takes
advantage of international transport routes, relying on core cities along the Belt and Road and using key
economic industrial parks as cooperation platforms. At sea, the Initiative focuses on jointly building smooth,
secure and efficient transport routes connecting major seaports along the Belt and Road (ibid.). The reach
of the Initiative continues to grow; “formerly centred on the broader Eurasian continent, BRI has since 2017
expanded to include the African continent, portions of Latin America, Oceania, and the Arctic Ocean”
(Rolland, 2019).
F IGURE 2. MAP OF THE BELT AND ROAD INITIATIVE
Source: Hong Kong Trade Development Council (2016).
9The BRI is taking shape alongside various efforts to enhance infrastructure connectivity and finance
connectivity in the region. These include the Australia-Japan-United States Trilateral Partnership for
Infrastructure Investment; Connecting Europe and Asia: the EU Strategy; and various bilateral and
multilateral financing mechanisms provided by international development lending institutions such as the
World Bank and Asian Development Bank.
Infrastructure investment along the Belt and Road focuses on six economic corridors (OECD, 2018):
(a) The New Eurasia Land Bridge Economic Corridor involves rail transport from China to Europe
via Kazakhstan, the Russian Federation, Belarus and Poland, reaching a number of coastal
ports in Europe. The rail routes offer rail-to-rail freight transport as well as the convenience
of “one declaration, one inspection, one cargo release” for any cargo transported.
(b) The China-Mongolia-Russia Economic Corridor includes rail links and the development of the
Steppe Road in Mongolia, which will connect with the land bridge.
(c) The China-Central Asia-West Asia Economic Corridor links Kazakhstan, the Kyrgyz Republic,
Tajikistan, Uzbekistan, Turkmenistan, the Islamic Republic of Iran and Turkey. The Corridor
runs from Xinjiang in China to join the railway networks of Central Asia and Western Asia
before reaching the Mediterranean coast and the Arabian Peninsula.
(d) The China-Indochina Peninsula Economic Corridor links Viet Nam, Thailand, Lao People’s
Democratic Republic, Cambodia, Myanmar and Malaysia. The Corridor links countries along
the Mekong River through nine cross-national highways, connecting east and west and linking
north to south. It also involves an international rail line running from Nanning to Hanoi and
introduces air routes to several major South-eastern Asian cities.
(e) The China-Pakistan Economic Corridor links the city of Kashgar in landlocked Xinjiang with the
deep-water port of Gwadar in Pakistan.
(f) The Bangladesh-China-India-Myanmar Economic Corridor connects India and China through
Myanmar and Bangladesh via road, rail, water and air linkages.
The BRI has five stated goals or priorities (National Development and Reform Commission, Ministry of
Foreign Affairs and Ministry of Commerce of the People’s Republic of China, 2015):
(a) Policy coordination means supporting the implementation of large-scale cooperation projects
and arriving at negotiated, mutually beneficial solutions.
(b) Facilities connectivity means improving the cross-border connectivity and quality of
infrastructure in the areas of land, sea and air transport, information and communications
technology (ICT), and energy.
(c) Unimpeded trade means facilitating investment and trade cooperation and, to this end,
eliminating barriers, promoting cross-border e-commerce, and servicing trade support
systems. The BRI has identified a wide range of mutual investment areas and recognizes that
Chinese enterprises should boost local economies, increase local employment, improve local
livelihoods, and assume social responsibility for protecting local biodiversity and the eco-
environment.
10(d) Financial integration means deepening cooperation in areas such as currency stabilization,
investment and financing systems, credit information systems, financial regulations, and
financial risk early-warning and crisis management.
(e) People-to-people bonds means strengthening public support for the Initiative. To this end,
the BRI is committed to promoting a range of cooperation activities and exchange
programmes in the areas of culture, sports, education,2 media, volunteerism, tourism, health,
employment, research, science and technology, and public administration. Increased
cooperation, communication and exchange can also contribute to the institutional
strengthening of public, legislative and political bodies and to poverty reduction efforts.
The BRI has the potential to exert considerable leverage over—and thus have a significant impact on—the
global economy. In June 2019, the 71 countries geographically situated along the six overland BRI economic
corridors were collectively estimated to account for over 30 per cent of global gross domestic product
(GDP) and 60 per cent of the world population (World Bank, 2019). By January 2021, 140 countries had
joined the BRI by signing a memorandum of understanding (MoU) with China (Nedopil Wang, 2021). From
2013 to June 2020, China invested about $755 billion in BRI countries (ibid.), including in the creation of
thousands of jobs (Park, 2018).
2
China provides 10,000 government scholarships to the countries along the Belt and Road every year.
111.2 The BRI-SDGs project
Tangible opportunities can be realized by aligning SDG and BRI implementation. The scale and scope of
both the 2030 Agenda and the BRI are ambitious. The BRI can and should be positioned as an accelerator
for the SDGs and the expansion of global public goods. The planning, monitoring and evaluation of BRI
implementation will need to be addressed from a perspective aligned with the architecture of the goals,
targets, and indicators that constitute the 2030 Agenda.
There is a substantial overlap between the five BRI priorities and the SDG framework. The 2030 Agenda
complements the BRI by providing a unified framework for advancing sustainable development. Aligning
the BRI with the 2030 Agenda creates a firm foundation for enhancing global development cooperation,
addressing environmental and social risks, building policy coherence and social cohesion, facilitating
effective dialogue among stakeholders, and bolstering national capacities. Working to strengthen the
complementarity between the BRI and SDGs can lead to a win-win outcome. A genuine commitment to
realizing the long-term sustainable development objectives embodied in the 2030 Agenda will likely allow
the BRI to transcend short-term commercial or political interests and garner positive support from the
citizens of participating countries (Horváth, 2017).
Realizing the vision and transformation potential of the BRI requires the mitigation of associated risks.
Participating Governments need to make strategic policy choices that will allow them to manage
environmental, social, reputational, sustainability and other risks associated with BRI-related activities.
Depending on the sector and country, policy reforms may be needed even in the pre-investment phase to
maximize net gains. For instance, it would be wasteful to build and maintain a transport corridor linking
neighbouring countries if their trade policies are not conducive to doing business. Gains from
agglomeration and transport corridors will encourage investment in their catchment areas, but
investments must be structured in a way that supports inclusive growth and does not exacerbate inequities.
Risk mitigation and complementary reforms require the strengthening of institutional capacities.
Institutional capacity is needed to assess risks, design risk scenarios for decision makers, and forecast trends
in more than one sector. The potential benefits deriving from the BRI are not automatic and require
adequate capacity and policy frameworks to ensure that investments are oriented towards the realization
of the SDGs. In 2018, EAPD/DESA launched a multi-year, multi-country project 3 to enhance national
capacities in designing coherent and integrated macroeconomic, social and environmental policies aimed
at accelerating progress towards SDG achievement; the 14 BRI countries participating in the project include
Azerbaijan, Bangladesh, Cambodia, Czech Republic, Georgia, Kazakhstan, Kyrgyz Republic, Lao People’s
Democratic Republic, Mongolia, Myanmar, Romania, Serbia, Sri Lanka and Thailand. The project, entitled
“Strengthening national policy capacities for jointly building the Belt and Road towards the SDGs”
(hereinafter referred to as the BRI-SDGs project), has the following two objectives (United Nations, n.d.(a)):
3
The project is funded by the 2030 Agenda for Sustainable Development Sub-Fund of the United Nation Peace
and Development Trust Fund.
12- Strengthened capacities of national policymakers and officials to analyse and formulate more
integrated policies, including through the use of modelling tools such as the WEFM-e;
- Strengthened and deepened engagement for policy analysis and policy dialogues among
policymakers and experts from the participating countries along the Belt and Road, including
engagement with international organizations.
This project report captures the progress achieved by the end of the pilot phase. Fourteen national reports
were prepared based on BRI-SDGs project activities and the experiences of the participating countries,
following an outline provided by DESA. The reports analyse national development and SDG strategies, BRI
activities in the respective countries, and the findings from the WEFM-e simulations and, on the basis of
this analysis, articulate policy options and strategies that can help them maximize benefits and avoid risks.
132 National contexts
Section 2.1 provides an overview of the project countries using data from international databases to enable
broad comparisons.4 Section 2.2 summarizes the development and SDG context in each country based on
the BRI-SDGs national reports as well as some international sources. Understanding the broader context
for each of the 14 project countries is critical to assessing the role of the BRI in providing pathways to
achieving the SDGs.
2.1 Overview of the 14 project countries
2.1.1 Economies
The project countries represent economies ranging from lower-middle income to high income (Figure 3),
and four of them—Bangladesh, Cambodia, Lao People’s Democratic Republic and Myanmar—are classified
as least-developed countries (LDCs) (United Nations, n.d.(b)). Industry and services are the main
contributors to GDP in some of these countries; others have workforces that operate primarily in the
agricultural sector (including forestry and fishing), yet the contribution of agriculture to GDP is relatively
small, indicating low productivity (see fFigure 4 and Figure 5).
F IGURE 3. GNI PER CAPITA IN CURRENT U NITED STATES DOLLARS (A TLAS METHOD ), 2019
Czech R. 21,940
Romania 12,630
Kazakhstan 8,820
Thailand 7,260
Serbia 7,030
Georgia 4,780
Azerbaijan 4,480
Sri Lanka 4,020
World Bank classification for 2019
Mongolia 3,790
(FY 2021)
Lao PDR 2,570 High income
Bangladesh 1,940
Upper-middle income
Cambodia 1,530
Lower-middle income
Myanmar 1,390
Kyrgyz R. 1,240
Source: World Bank, World Development Indicators.
Note: Following the establishment of income categories based on 2019 data for fiscal year 2021, Sri Lanka was
reclassified by the World Bank from an upper-middle-income to a lower-middle-income economy.
4
With data provided in the BRI-SDGs national reports not always comparable or standardized, a decision was
made to rely on international data from established sources that have undergone quality checks. International
databases used include those maintained by the United Nations Department of Economic and Social Affairs,
International Labour Organization, United Nations Children’s Fund, World Health Organization, and World Bank.
14F IGURE 4. SECTORAL SHARE OF VALUE ADDED , 2019 F IGURE 5. PERCENTAGE OF TOTAL EMPLOYMENT BY SECTOR ,
( PERCENTAGE OF GDP) 2020
Georgia 7 61 Kazakhstan 15 20 64
Thailand 8 59 Czech R. 3 37 60
Sri Lanka 7 58 Serbia 15 27 58
Romania 4 58 Kyrgyz R. 20 25 55
Czech R. 2 57 Mongolia 27 19 54
Kazakhstan 4 56 Azerbaijan 36 15 50
Bangladesh 13 53 Romania 21 30 49
Serbia 6 51 Thailand 31 23 46
Kyrgyz R. 12 50 Sri Lanka 24 30 46
Lao PDR 15 43 Georgia 41 14 44
Myanmar 21 41 Bangladesh 38 22 41
Mongolia 11 40 Cambodia 31 30 39
Cambodia 21 39 Myanmar 48 16 36
Azerbaijan 6 37 Lao PDR 62 12 26
Others Agriculture Industry Services D Agriculture Industry Services
Source: World Bank, World Development Indicators. Source: World Bank, World Development Indicators from
Notes: Percentages do not total 100 in some countries; the International Labour Organization modelled estimate.
for these, the difference has been computed and
designated as “others”. This is likely due to classification
differences under national accounting systems. No
attempt has been made to normalize to 100 per cent. Data
for Myanmar are for 2018.
152.1.2 People
Human development is an important factor in sustainable economic growth and is linked to well-being.
Based on their respective Human Development Index (HDI) values, the 14 project countries are classified
as having medium to very high levels of human development (see Figure 6). This composite index has three
dimensions: a long and healthy life, represented by life expectancy at birth (see fFigure 7Figure 7Error!
Reference source not found.); knowledge, represented by expected years and mean years of schooling (see
fFigure 8Figure 8); and a decent standard of living, represented by gross national income (GNI) per capita
(seeFigure 3) (UNDP, 2020).
F IGURE 6. HUMAN DEVELOPMENT I NDEX, 2019 F IGURE 7. L IFE EXPECTANCY AT BIRTH, 2019
Myanmar 0.583 Czech R. 79.4
Medium HD
Cambodia 0.594 Thailand 77.2
Lao PDR 0.613 Sri Lanka 77.0
Bangladesh 0.632 Romania 76.1
Kyrgyz R. 0.697 Serbia 76.0
Mongolia 0.737 Georgia 73.8
High HD
Azerbaijan 0.756 Kazakhstan 73.6
Thailand 0.777 Azerbaijan 73.0
Sri Lanka 0.782 Bangladesh 72.6
Serbia 0.806 Kyrgyz R. 71.5
Very High HD
Georgia 0.812 Mongolia 69.9
Kazakhstan 0.825 Cambodia 69.8
Romania 0.828 Lao PDR 67.9
Czech R. 0.900 Myanmar 67.1
Source: UNDP (2020). Source: UNDP (2020).
High levels of human development are not always linked to high income; they also derive from the implementation
of appropriate policies. Certain project countries, such as Sri Lanka, the Kyrgyz Republic and Georgia, have a much
higher human development status than other countries of comparable income (reflected in a high relative value when
HDI rank is subtracted from GNI per capita rank); conversely, there are those that have lower levels of human
development than other countries of comparable income (see Figure 9).
F IGURE 8. MEAN AND EXPECTED YEARS OF SCHOOLING, F IGURE 9. INCOME PER CAPITA RANK MINUS HUMAN
2019 DEVELOPMENT RANK , 2019
25 GNI per 22 23 23
Czech R. 12.7 16.8 capita rank
Kazakhstan 11.9 15.6 20 minus HDI
rank
Georgia 13.1 15.3 15
Thailand 7.9 15.0 9 9
10 7 7 8
Serbia 11.2 14.7
Romania 11.1 14.3 5 3 3
Mongolia 10.3 14.2
0
Sri Lanka 10.6 14.1
-1
Kyrgyz R. 11.1 13.0 -5
Azerbaijan 10.6 12.9 -6
-10
Bangladesh 6.2 11.6 -10
Cambodia 5.0 11.5
-15
Lao PDR 5.3 11.0 -16
-20
Lao PDR
Thailand
Myanmar
Romania
Azerbaijan
Cambodia
Mongolia
Bangladesh
Serbia
Czech R.
Kazakhstan
Georgia
Sri Lanka
Kyrgyz R.
Myanmar 5.0 10.7
Mean years of schooling Expected Years of schooling
16Source: UNDP (2020). Source: UNDP (2020).
The 14 project countries may also be examined from the perspective of the Human Assets Index (HAI) (see
fError! Reference source not found.). This is a composite index developed by DESA based on six key
indicators that contribute to building human assets in a country: under-five mortality rate, maternal
mortality ratio, prevalence of stunting, gross secondary school enrolment ratio, adult literacy rate, and
gender parity index for gross secondary school enrolment. The HAI is one of three components used by the
United Nations to determine a country’s development status (United Nations Committee for Development
Policy Secretariat, 2020). Human assets are vital to ensuring sustainable development and long-term
economic growth. Healthy and well-nourished children, education, gender equality, and functional literacy
are essential for strengthening human assets.
Human capital is closely linked to productivity and GDP. The Human Capital Index (HCI), developed by the
World Bank Group, provides a relative measure of human capital that a child born today can expect to
acquire by age 18 based on the health and education situation in a particular country.5 In countries in which
the HCI is lower than 0.50 (as is the case for Myanmar, Bangladesh and Lao People’s Democratic Republic),
a child born today is projected to be less than half as productive at age 18 as another 18-year-old that has
had the benefit of full health and a complete education. The HCI is linked to how much income a country
can generate; an HCI score of 0.50 means that the GDP per worker could be twice as high if the country
had reached the relevant health and education benchmarks (see fFigure 11) (World Bank, 2020b).
F IGURE 10. H UMAN ASSETS I NDEX, SELECTED COUNTRIES, F IGURE 11. H UMAN C APITAL I NDEX, SELECTED
2000-2020 COUNTRIES , 2020
Czech R. 0.77
98 0.73
92 94 94 95 97
92 Serbia 0.70
0.66
72 72 75 Kazakhstan 0.65
68 0.61
Mongolia 0.64
0.59
Thailand 0.63
0.59
Kyrgyz R. 0.62
0.58
Georgia 0.61
0.53
30 55 37 44 79 88 83 80 75 88 89 0.59
Azerbaijan
0.57
Lao PDR
Cambodia
Myanmar
Bangladesh
Azerbaijan
Sri Lanka
Thailand
Kyrgyzstan
Georgia
Kazakhstan
Mongolia
Myanmar 0.49
0.46
Bangladesh 0.48
0.45
Lao PDR 0.47
0.45
Year 2000 Year 2020
Female HCI Male HCI
Source: United Nations Committee for Source: World Bank (2020b), Human Capital
Development Policy Secretariat (2020), Time series Project.
estimates of the LDC criteria, 12 April 2020. Note: Data for Cambodia and Sri Lanka were not
Note: Data for the Czech Republic, Romania and available.
Serbia were not available.
5
The HCI reflects the following components of human capital: the probability of survival to age five, a child’s
expected years of schooling, harmonized test scores as a measure of the quality of learning (combined with years of
schooling to obtain learning-adjusted years of school), the adult survival rate (share of the 15-year-old population
that will survive to age 60), and the proportion of children who are not stunted.
17You can also read