Projection Period: 14 November 2020 - 15 January 2021 - University ...
←
→
Page content transcription
If your browser does not render page correctly, please read the page content below
Projecting COVID-19 Hospitalizations and Deaths
for Region 3 of the Kentucky Regional Hospital Preparedness
                  Program (HPP) Coalition
       (Jefferson County and 14 Surrounding Counties)
during the Implementation of the State’s “Targeted Measures”

                    Projection Period:
          14 November 2020 – 15 January 2021

                             1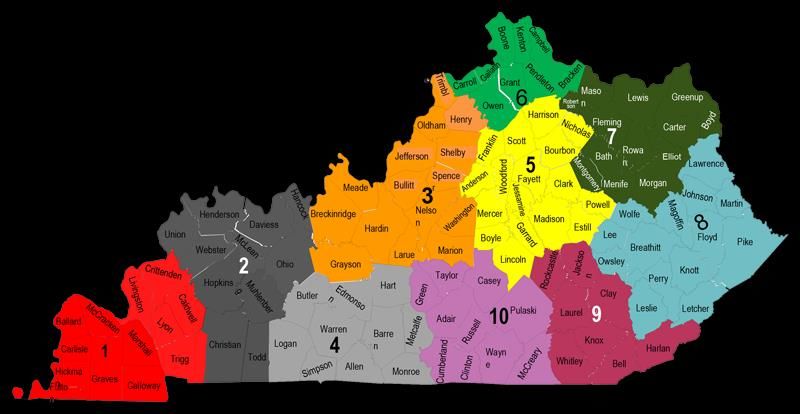
Authors:

                  Seyed M. Karimi, PhD                                         Hamid Zarei, MS
  Department of Health Management & System Sciences             Department of Health Management & System Sciences
      School of Public Health & Information Sciences              School of Public Health & Information Sciences
                   University of Louisville                                   University of Louisville
Phone: +1(502)852-0417. Email: Seyed.Karimi@louisville.edu              Email: Hamid.Zarei@louisville.edu
                  Center for Health Equity
 Louisville Metro Department of Public Health & Wellness
            Email: Seyed.Karimi@louisvilleky.gov

                   Ryan LaZur, MS                                              Natalie DuPre, ScD
                 Division of Analytics                           Department of Epidemiology and Population Health
          Office of Health Data and Analytics                      School of Public Health & Information Sciences
        KY Cabinet for Health and Family Services                              University of Louisville
              Email: Ryan.Lazur@ky.gov                       Phone: +1(502)852-4627. Email: Natalie.Dupre@louisville.edu

                W. Paul McKinney, MD                                           Naiya Patel, MPH
 Department of Health Promotion and Behavioral Sciences         Department of Health Management & System Sciences
     School of Public Health & Information Sciences               School of Public Health & Information Sciences
                 University of Louisville                                     University of Louisville
 Phone: +1(502)852-3008. Email: McKinney@louisville.edu                  Email: Naiya.Patel@louisville.edu

                YuTing Chen, MPH, MS                                            Riten Mitra, PhD
                 Center for Health Equity                          Department of Bioinformatics and Biostatistics
Louisville Metro Department of Public Health and Wellness         School of Public Health & Information Sciences
             Phone: +1(502)574-8279. Email:                                   University of Louisville
              YuTing.Chen@louisvilleky.gov                    Phone: +1(502)852-3294. Email: Riten.Mitra@louisville.edu

                    Bert Little, PhD
  Department of Health Management & System Sciences
     School of Public Health & Information Sciences
                 University of Louisville
 Phone: +1(502)852-5933. Email: Bert.Little@louisville.edu

                                  Draft Date: November 20, 2020

                                                        2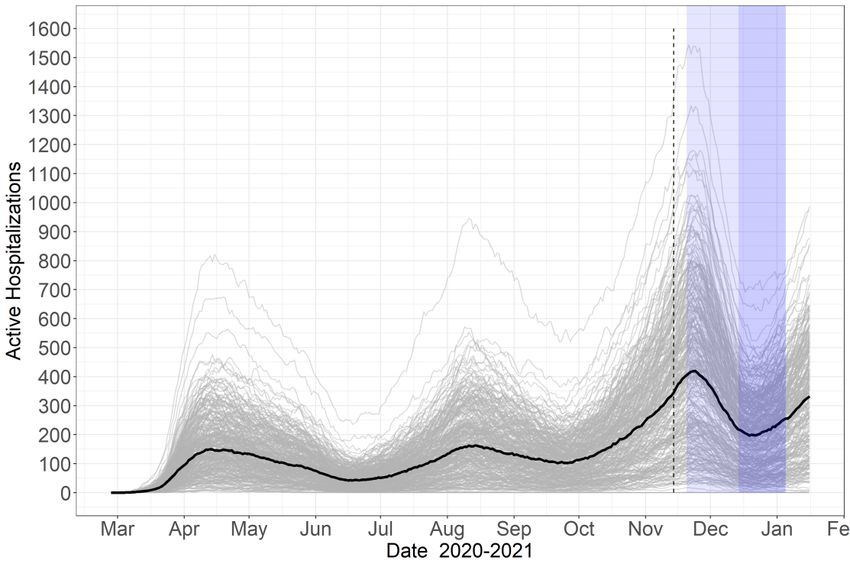
The State of Kentucky’s Targeted Measures (link)

20 November 2020 to 13 December 2020:
   • Gyms, fitness centers, pools, other indoor recreation facilities: “33%
     capacity limit; group classes, team practices and competitions prohibited; masks
     must be worn while exercising”
   • Venues, event spaces and theaters: “Each room will be limited to 25 people.
     This applies to indoor weddings and funerals”
   • Private Social Gatherings: “Up to eight people from a maximum of two
     households”
   • Professional services: “Office-based businesses limited to 33% of employees;
     all employees who are able to work from home must do so; all businesses that
     can close to the public must do so”
   • Restaurant and bars: “No indoor food or beverage consumption; carryout
     and delivery encouraged; socially distance outdoor seating”

20 November 2020 to 4 January 2021:
   • “All public and private schools (K -12) to cease in-person instruction”:
     o Elementary schools: “Elementary schools may reopen for in-person
        instruction Dec. 7”
     o Middle and high schools: “will remain in remote or virtual instruction
        until at least Jan. 4, 2021.”

                                          3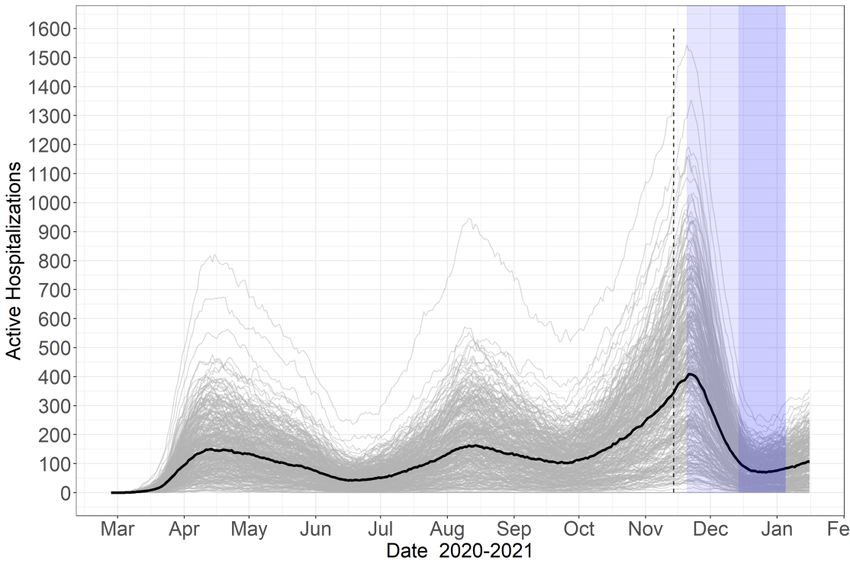
Takeaways:
• In the absence of the targeted measures (or if there is no compliance with
  the restrictions), the number of active hospitalizations and total deaths is
  expected to be 789 and 1092 by mid-December 2020 and 1689 and 1932 by
  mid-January 2021.

• High compliance with the targeted measures (if it reduces transmission rate
  by 75%) prevents ~690 excess hospitalizations and ~194 deaths by mid-
  December 2020 and ~1,582 excess hospitalizations and ~970 deaths by mid-
  January.

• Mid-range compliance with the targeted measures (if it reduces
  transmission rate by 50%) prevents ~574 excess hospitalizations and ~155
  deaths by mid-December 2020 and ~1,363 excess hospitalizations and ~828
  deaths by mid-January.

• Even low compliance with the targeted measures (if it reduces transmission
  rate by 25%) prevents ~355 excess hospitalizations and ~98 deaths by mid-
  December 2020 and ~933 excess hospitalizations and ~513 deaths by mid-
  January.

• In summary, compliance with the new restrictions is projected to prevent
  excess hospitalizations and deaths. Notably, the estimated benefits of high
  compliance are remarkably greater than low compliance and will allow
  Region 3 hospitals to operate elective surgeries at normal capacity.

                                       4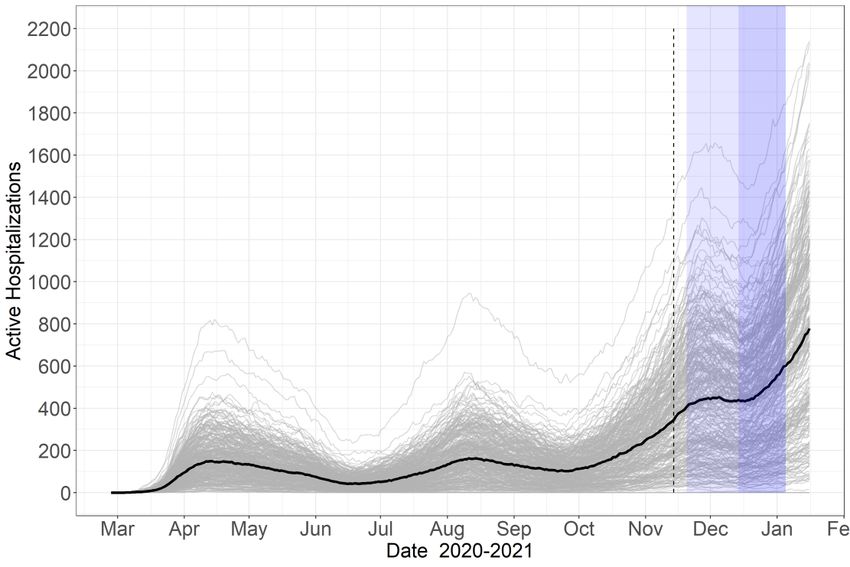
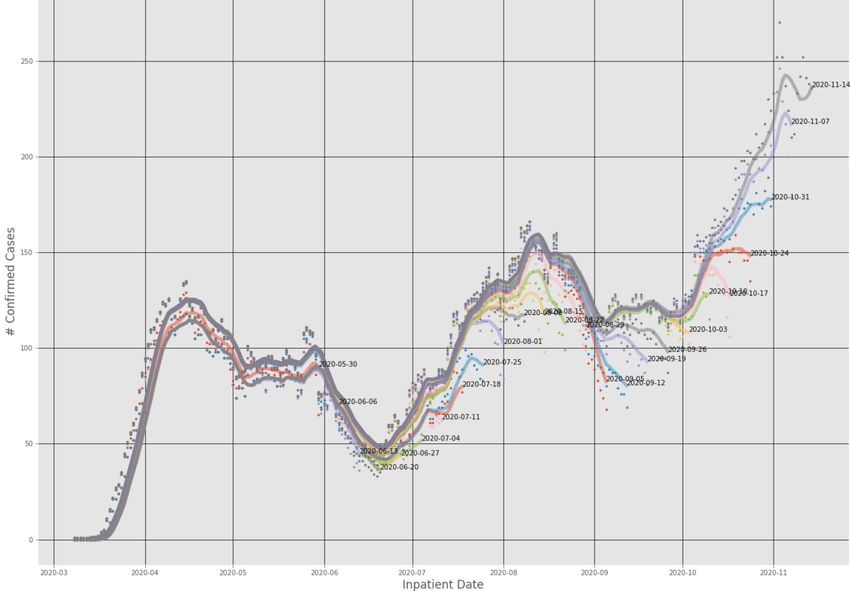
Kentucky Regional Hospital Preparedness Program (HPP) Coalition

               HPP Region 3 Counties:
                 Bullitt, Breckinridge, Grayson, Hardin,
                 Henry, Jefferson, Larue, Marion,
                 Meade, Nelson, Oldham, Shelby,
                 Spencer, Trimble, Washington

Source: https://kyepltc.org/hospital-preparedness/coalitions/

                                                                5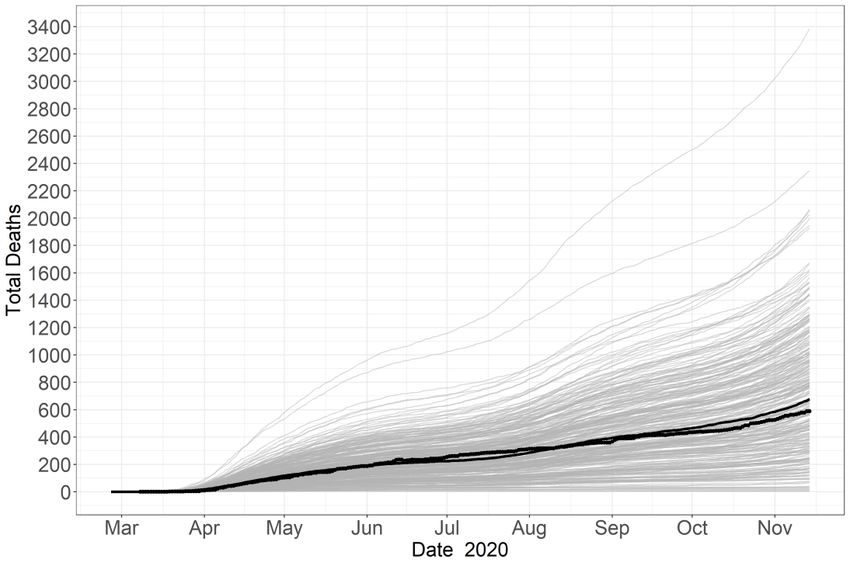
Total Covid-19 Cases and Deaths in Kentucky HPP Region 3
      (Jefferson County and 14 Surrounding Counties)

 Note: The graph is based on the authors’ calculations using the New York Times Data (link)

                                          6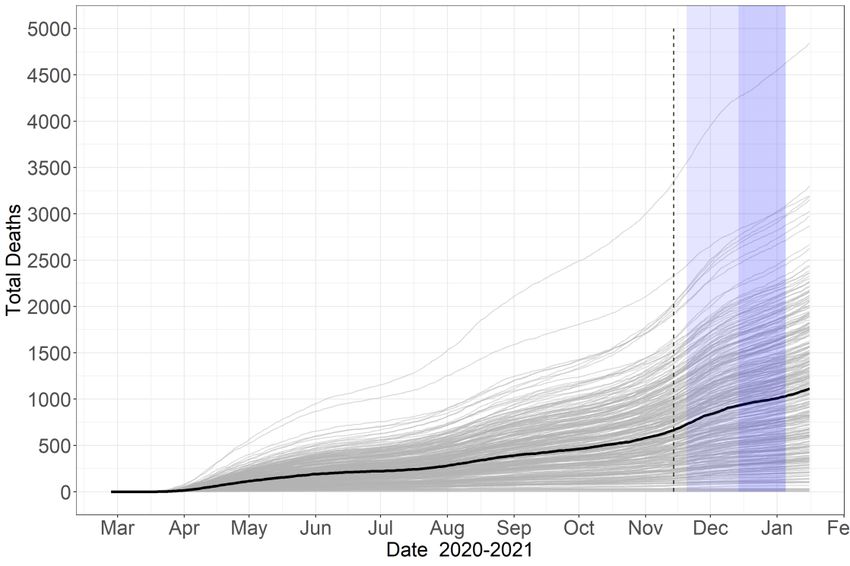
Confirmed Covid-19 Hospitalizations for Kentucky HPP Region 3 (Jefferson County and 14
Surrounding Counties) by Report Date       The effect of an approximately 3-week delay in reporting can be observed

     Notes: The graph is based on the authors’ calculations using the data from the Kentucky Health Information Exchange (KHIE).
                                                                  7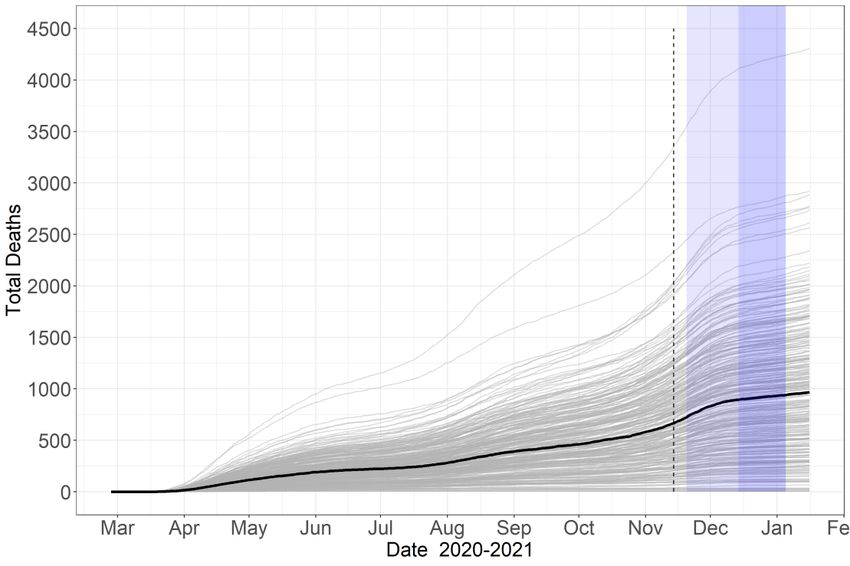
Confirmed Covid-19 Hospitalizations for Kentucky HPP Region 3 Based on the Latest
Hospitalization Report: Incomplete Numbers vs. the Numbers Corrected for Reporting Delay

     Notes: (1) Kentucky HPP Region 3 includes Jefferson County and 14 Surrounding Counties; (2) The graph is based on the authors’
     calculations using the data from the Kentucky Health Information Exchange (KHIE).
                                                               8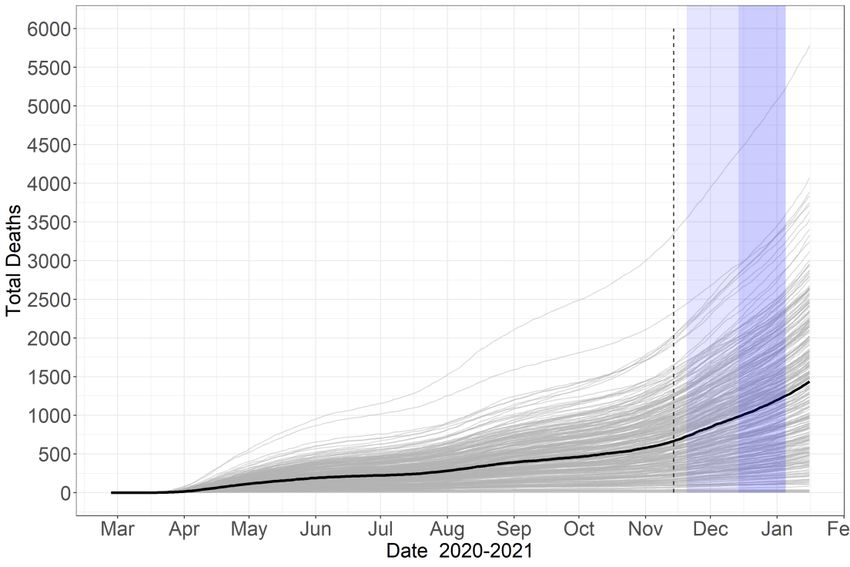
A Conceptual Framework for Modeling Covid-19 Pandemic in HPP Region 3:
                  A Susceptible-Exposed-Infectious-Recovered (SEIR) Model

                                     Infectious with No
    Susceptible       Exposed            Symptoms                                Recovered

                                      Pre-Symptomatic     Infectious with Mild
                                                               Symptoms          Recovered
                                           Period

                                      Infectious with
                                     Severe Symptoms

                                       Hospitalized                              Recovered

                                           Dead

                                                  9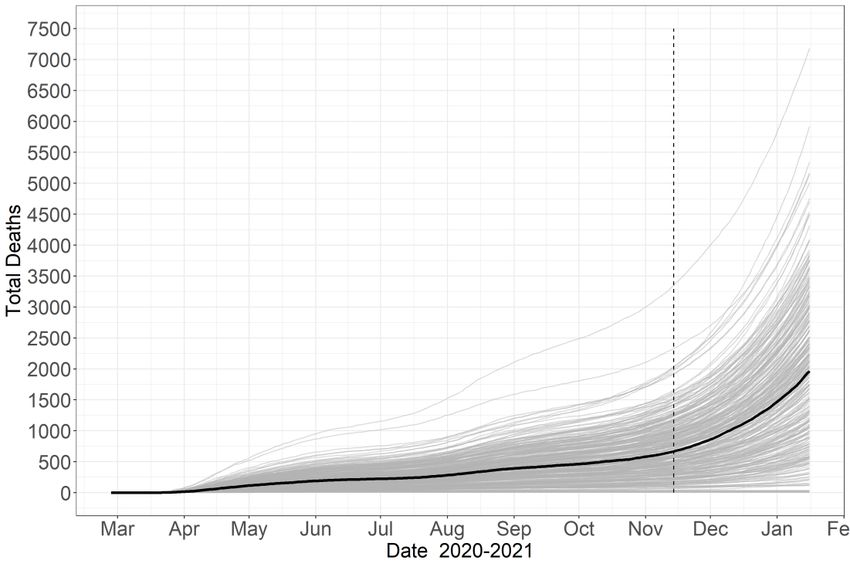
Transmission and Clinical Parameters Used in the SEIR Model
                                                                                                      Lower               Upper
                                                                                               Median Bound               Bound
Parameters Extracted from the Literature:
Proportion of Infections That Are Asymptomatic 1-4                                               43%           30%          50%
Incubation Period (Days)5-8                                                                       3.5           2.0         14.0
Pre-Symptomatic Period (Days)9-11                                                                 1.5           1.1          2.5
Infectious Period for Asymptomatic Infections (Days) 12,13                                        7.0           4.0         10.0
Parameters Extracted from the Jefferson County Person-Level Data:
Infectious Period for Mildly Symptomatic Infections (Days)14-16                                  15.0          8.0         22.0
Infectious Period for Severely Symptomatic Infections (Days)                                     5.0           2.0          8.0
Proportion of Symptomatic Infections That Require Hospitalization17,18                          12.6%         7.6%        17.6%
Duration of Hospital Stay of Those Who Recover from Infection (Days)                             5.0           3.0          9.0
Duration of Hospital Stay of Those That Die of the Infection (Days)                              9.0           5.0         15.0
Fatality Rate Among Hospitalizations                                                            16.5%         11.5%       21.5%
Notes: For each parameter of the SEIR model, a range of values from the lower bound to the upper bound were used. The
references from which the parameters in the first section of the table were extracted are listed in the Reference Section on the
last page of this report. Parameters in the second section of the table are extracted from the Jefferson County COVID-19 Case
and Fatality Data, collected and compiled at the Louisville Metro Department of Public Health and Wellness (LMPHW). For
the latter set of parameters, a lower bound is the 25th quantile of the distribution of the parameter value in the data, and an upper
bound is the 75th quantile. The exceptions are percentages (“proportion of symptomatic infections that require hospitalization”
and “fatality rate among hospitalizations”) and the upper bound of the number of days of “infectious period for mildly
symptomatic infections.” The 75th quantile of the latter parameter in Jefferson County data is 53 days, significantly different
from what is reported in the literature. Therefore, the upper bound was selected such that it has the same distance from the
median as the lower bound does. For percentages, 5% above and below was selected as upper and lower bounds, respectively.

                                                                10
The Fit of the SEIR Model to the Observed Hospitalization and
Death Data in Kentucky HPP Region 3 (Jefferson County and 14
Surrounding Counties): March 15 to November 13, 2020
The dots indicate the observed data.
The highlighted path shows the median of 300 simulations.
11The Timeline of the Targeted Measures and Modelled Interventions
November December January
15 20 25 30 5 10 15 20 25 31 5 15 20
Date
Start of the Targeted Measures: In-Person Instruction In-Person Instruction
Restrictions on Bars, Restaurants, in Elementary Schools in Middle and High
Private Gatherings, Gyms, Venues, May Begin Schools May Begin
Prof Services, and Schools Non-School
Restrictions Expire
Intervention 1: Intervention 2: Intervention 3:
Modeled
Implementation of All Targeted Measures Only School Restrictions All Targeted Measures Expire
Interventions:
Note: Detailed information on the restrictions is available at Kentucy.gov.
12Projection Scenarios
Given the components of the targeted measures, the following projection scenarios were considered:
The ↓ sign indicates a decrease.
Assumed
Intervention Intervention Percentage
Intervention Start End Change in
# Scenarios Number Interventions Description Date Date Transmission
1 Continuing the Status Quo None Absence of the Targeted Measures - - -
1 Implementation of All Targeted Measures 20-Nov 13-Dec 25% ↓
Low Compliance
2 2 Only School Restrictions 14-Dec 4-Jan 3% ↓
with the Restrictions
3 All Targeted Measures Expire 5-Jan 15-Jan 0
1 Implementation of All Targeted Measures 20-Nov 13-Dec 50% ↓
Mid-Range Compliance
3 2 Only School Restrictions 14-Dec 4-Jan 3% ↓
with the Restrictions
3 All Targeted Measures Expire 5-Jan 15-Jan 0
1 Implementation of All Targeted Measures 20-Nov 13-Dec 75% ↓
High Compliance
4 2 Only School Restrictions 14-Dec 4-Jan 3% ↓
with the Restrictions
3 All Targeted Measures Expire 5-Jan 15-Jan 0
Notes: (1) The SEIR model’s transmission parameter is the multiplication of the probability of transmission per-contact and the per capita contact
rate between the susceptible and the infectious. The latter component carries the effect of a non-pharmaceutical intervention if it influences personal
and social protection measures. (2) The new school restrictions are expected to affect about 20% of Jefferson County’s student population because
the rest attend public schools, which applied distance learning from July 2020. Since 6-18 years old constitute 15.8% of Jefferson County’s population,
if the restriction decreases these students’ contact rate by 95%, then it is expected that the overall contact rate in the County decreases by 3%
(=20%×15.8%×95%) with respect to the pre-November 20 period. (3) The presumed percentage decreases in transmission during full
implementation of the targeted measures may resemble mask-wearing effectiveness and its take-up in reducing the transmission. High mask-wearing
may decrease the reduce the risk of infection by 85%, but low mask-wearing rates will reduce its effectiveness proportionally.
13The Status Quo’s Projections for 14 November 2020 − 15 January 2021
Continuing the current status quo: no change in contact rate
Figure S0_H: Active Hospitalization
Projection
Figure S0_D: Cumulative Deaths
Projection
14Scenario 1’s Projections for 14 November 2020 − 15 January 2021
Low compliance with the new restrictions: 25% decrease in the transmission rate
Figure S1_H: Active Hospitalization
Projection
Only School
Restrictions
Implementation of All
Targeted Measures
All Targeted
Measures
Expire
Figure S1_D: Cumulative Deaths
Projection
Only School
Restrictions
Implementation of All
Targeted Measures
All Targeted
Measures
Expire
15Scenario 2’s Projections for 14 November 2020 − 15 January 2021
Mid-range compliance with the new restrictions: 50% decrease in the transmission rate
Figure S2_H: Active Hospitalization
Projection
Only School
Restrictions
Implementation of All
Targeted Measures
All Targeted
Measures
Expire
Figure S2_D: Cumulative Deaths
Projection
Only School
Restrictions
Implementation of All
Targeted Measures
All Targeted
Measures
Expire
16Scenario 3’s Projections for 14 November 2020 − 15 January 2021
High compliance with the new restrictions: 25% decrease in the transmission rate
Figure S3_H: Active Hospitalization
Projection
Only School
Restrictions
Implementation of All
Targeted Measures
All Targeted
Measures
Expire
Figure S3_D: Cumulative Deaths
Projection
Only School
Restrictions
Implementation of All
Targeted Measures
All Targeted
Measures
Expire
17Summary of Projection Results:
Active Hospitalization // Total Deaths
December 1, December 15, January 1, January 15,
# Scenarios 2020 2020 2021 2021
1 Absence of the Targeted Measures 545 // 861 789 // 1,092 1217 // 1,471 1,689 // 1932
2 Low Compliance 443 // 848 434 // 994 556 // 1,198 756 // 1,419
3 Mid-Range Compliance 366 // 837 215 // 937 234 // 1,009 326 // 1,104
4 High Compliance 296 // 830 99 // 898 76 // 934 107 // 964
● This report investigated the simulated effect of the implementation of a set
of targeted measures by the State of Kentucky to contain the recent sharp
increase in COVID-19 cases and hospitalizations on COVID-19
transmission.
● Three scenarios of compliance with the targeted measures were considered:
low, mid-range, and high. The scenarios were assumed to decrease the
transmission of the coronavirus by 25%, 50%, 75% in Kentucky HPP Region 3
(including Jefferson County and 14 surrounding counties). For these scenarios, the
projections for hospitalizations and deaths were made until mid-January 2021. These projections
were based on medians of 300 simulations.
• The status quo scenario (absence of the targeted measures) estimates that
by mid-January 2021:
- active hospitalizations will increase to approximately 1,689
- total deaths will increase to approximately 1,932
• Scenario 1 (low compliance with targeted measures) estimates that by mid-
January 2021:
- active hospitalizations will increase to approximately 756
- total deaths will increase to approximately 1,419
18• Scenario 2 (mid-range compliance with targeted measures) estimates that
by mid-January 2021:
- active hospitalizations will increase to approximately 326
- total deaths will increase to approximately 1,104
• Scenario 3 (high compliance with targeted measures) estimates that by mid-
January 2021:
- active hospitalizations will increase to approximately 107
- total deaths will increase to approximately 964
The estimated benefits of high compliance are remarkably greater than low
compliance and will allow Region 3 hospitals operate elective surgeries at
normal capacity.
19References for COVID-19 Transmission Parameters
1. Yang R, Gui X, Xiong Y. Comparison of clinical characteristics of patients with asymptomatic vs
symptomatic coronavirus disease 2019 in Wuhan, China. JAMA Network Open. 2020 May
1;3(5):e2010182-.
2. Lavezzo E, Franchin E, Ciavarella C, Cuomo-Dannenburg G, Barzon L, Del Vecchio C, Rossi L,
Manganelli R, Loregian A, Navarin N, Abate D. Suppression of a SARS-CoV-2 outbreak in the
Italian municipality of Vo’. Nature. 2020 Aug;584(7821):425-9.
3. Pollán M, Pérez-Gómez B, Pastor-Barriuso R, Oteo J, Hernán MA, Pérez-Olmeda M, Sanmartín
JL, Fernández-García A, Cruz I, de Larrea NF, Molina M. Prevalence of SARS-CoV-2 in Spain
(ENE-COVID): a nationwide, population-based seroepidemiological study. The Lancet. 2020 Aug
22;396(10250):535-44.
4. Mizumoto K, Kagaya K, Zarebski A, Chowell G. Estimating the asymptomatic proportion of
coronavirus disease 2019 (COVID-19) cases on board the Diamond Princess cruise ship,
Yokohama, Japan, 2020. Eurosurveillance. 2020 Mar 12;25(10):2000180.
5. Lauer SA, Grantz KH, Bi Q, Jones FK, Zheng Q, Meredith HR, Azman AS, Reich NG, Lessler
J. The incubation period of coronavirus disease 2019 (COVID-19) from publicly reported
confirmed cases: estimation and application. Annals of Internal Medicine. 2020 May 5;172(9):577-82.
6. Cucinotta D, Vanelli M. WHO declares COVID-19 a pandemic. Acta Bio Medica: Atenei Parmensis.
2020;91(1):157.
7. McAloon C, Collins Á, Hunt K, Barber A, Byrne AW, Butler F, Casey M, Griffin J, Lane E,
McEvoy D, Wall P. Incubation period of COVID-19: a rapid systematic review and meta-analysis
of observational research. BMJ Open. 2020 Aug 1;10(8):e039652.
8. Linton NM, Kobayashi T, Yang Y, Hayashi K, Akhmetzhanov AR, Jung SM, Yuan B, Kinoshita
R, Nishiura H. Incubation period and other epidemiological characteristics of 2019 novel
coronavirus infections with right truncation: a statistical analysis of publicly available case data.
Journal of Clinical Medicine. 2020 Feb;9(2):538.
9. Ren X, Li Y, Yang X, Li Z, Cui J, Zhu A, Zhao H, Yu J, Nie T, Ren M, Dong S. Evidence for
pre‐symptomatic transmission of coronavirus disease 2019 (COVID‐19) in China. Influenza and
Other Respiratory Viruses. 2020 Aug 7.
10. Huang L, Zhang X, Zhang X, Wei Z, Zhang L, Xu J, Liang P, Xu Y, Zhang C, Xu A. Rapid
asymptomatic transmission of COVID-19 during the incubation period demonstrating strong
infectivity in a cluster of youngsters aged 16-23 years outside Wuhan and characteristics of young
patients with COVID-19: a prospective contact-tracing study. Journal of Infection. 2020 Apr 10.
11. Kimball A, Hatfield KM, Arons M, James A, Taylor J, Spicer K, Bardossy AC, Oakley LP, Tanwar
S, Chisty Z, Bell JM. Asymptomatic and presymptomatic SARS-CoV-2 infections in residents of
a long-term care skilled nursing facility—King County, Washington, March 2020. Morbidity and
Mortality Weekly Report. 2020 Apr 3;69(13):377.
12. Zhou R, Li F, Chen F, Liu H, Zheng J, Lei C, Wu X. Viral dynamics in asymptomatic patients
with COVID-19. International Journal of Infectious Diseases. 2020 May 11.
13. Hu Z, Song C, Xu C, Jin G, Chen Y, Xu X, Ma H, Chen W, Lin Y, Zheng Y, Wang J. Clinical
characteristics of 24 asymptomatic infections with COVID-19 screened among close contacts in
Nanjing, China. Science China Life Sciences. 2020 May;63(5):706-11.
2014. Pavone C, Giammanco GM, Baiamonte D, Pinelli M, Bonura C, Montalbano M, Profeta G,
Curcurù L, Bonura F. Italian males recovering from mild COVID-19 show no evidence of
SARS-CoV-2 in semen despite prolonged nasopharyngeal swab positivity. International Journal
of Impotence Research. 2020 Sep;32(5):560-2.
15. Report of the WHO-China joint mission on coronavirus disease 2019 (COVID-19). Geneva:
World Health Organization; 2020 Feb. 16–24. Available: www.who.int/docs/default-
source/coronaviruse/who-china-joint-mission-on-covid-19-final-report.pdf
16. Lechien JR, Chiesa‐Estomba CM, Place S, Van Laethem Y, Cabaraux P, Mat Q, Huet K, Plzak
J, Horoi M, Hans S, Barillari MR. Clinical and epidemiological characteristics of 1,420
European patients with mild‐to‐moderate coronavirus disease 2019. Journal of Internal Medicine.
2020 Apr 30.
17. Guan WJ, Ni ZY, Hu Y, Liang WH, Ou CQ, He JX, Liu L, Shan H, Lei CL, Hui DS, Du B.
Clinical characteristics of coronavirus disease 2019 in China. New England Journal of Medicine.
2020 Apr 30;382(18):1708-20.
18. Fu L, Wang B, Yuan T, Chen X, Ao Y, Fitzpatrick T, Li P, Zhou Y, Lin Y, Duan Q, Luo G.
Clinical characteristics of coronavirus disease 2019 (COVID-19) in China: a systematic review
and meta-analysis. Journal of Infection. 2020 Apr 10.
21You can also read