Psychology of Sport & Exercise - Laboratory for Stress ...
←
→
Page content transcription
If your browser does not render page correctly, please read the page content below
Psychology of Sport & Exercise 58 (2022) 102078
Contents lists available at ScienceDirect
Psychology of Sport & Exercise
journal homepage: www.elsevier.com/locate/psychsport
Assessing lifetime stressor exposure in sport performers: Associations with
trait stress appraisals, health, well-being, and performance
Ella McLoughlin a, *, Rachel Arnold a, David Fletcher b, Chandler M. Spahr c, George M. Slavich d,
Lee J. Moore a
a
Department for Health, University of Bath, UK
b
School of Sport, Exercise and Health Sciences, Loughborough University, UK
c
Department of Psychology, University of California, Riverside, USA
d
Cousins Center for Psychoneuroimmunology and Department of Psychiatry and Biobehavioral Sciences, University of California, Los Angeles, USA
A R T I C L E I N F O A B S T R A C T
Keywords: Research has found that greater lifetime stressor exposure increases the risk for mental and physical health
Adversity problems. Despite this, few studies have examined how stressors occurring over the entire lifespan affect sport
Allostatic load performers’ health, well-being, and performance, partly due to the difficulty of assessing lifetime stressor
Assessment
exposure. To address this issue, we developed a sport-specific stress assessment module (Sport SAM) for the
Challenge and threat
Stressors
Stress and Adversity Inventory (STRAIN) and then analyzed the instrument’s usability, acceptability, validity,
and test-retest reliability. Furthermore, we examined whether trait-like tendencies to appraise stressful situations
as a challenge or threat mediated the association between lifetime stressor exposure and health, well-being, and
performance. Participants were 395 sport performers (Mage = 22.50 years, SD = 5.33) who completed an online
survey. Results revealed that the Sport SAM demonstrated good usability and acceptability, good concurrent
validity in relation to the Adult STRAIN (rs = 0.23 to 0.29), and very good test-retest reliability (ricc = 0.87 to
0.89). Furthermore, the Sport SAM was significantly associated with symptoms of depression (β = 0.21 to 0.24,
ps ≤ .001) and anxiety (β = 0.13 to 0.19, ps ≤ .012), and general physical (β = 0.24 to 0.27, ps = ≤ 0.001) and
mental (β = 0.23 to 0.32, p ≤ .001) health complaints. Finally, we found that associations between total lifetime
non-sport and sport-specific stressor severity and health were mediated by trait stress appraisals. Consequently,
these findings may help practitioners better identify sport performers who are at risk of developing stress-related
health problems.
It is well-established that exposure to life stressors can affect health, responses (e.g., cognitive appraisals, cardiovascular reactivity); and (c)
well-being, and performance through psychological (e.g., cognitive ap biological aging and disease. As a result, this model identifies individual
praisals) and biological (e.g., sympathetic nervous system, immuno and environmental factors that shape an individual’s vulnerability to
logical response) pathways (Arnold & Fletcher, 2021; Slavich, 2020). stressor-related health problems (Epel et al., 2018). This is particularly
Moreover, greater exposure to stressors over the lifespan has been noteworthy given that an important factor missing from many stress and
related to a variety of mental and physical health conditions, including health models (e.g., transactional model of stress and coping; Lazarus &
anxiety disorders, depression, and heart disease (Slavich & Shields, Folkman, 1984) is cumulative stressor exposure, which refers to the total
2018). One theoretical framework that explains how stressor exposure count or severity of all the stressors an individual has experienced across
affects health is the integrative model of lifespan stress and health (Epel their lifespan (Lam et al., 2019). Overall, this model suggests that
et al., 2018). This model comprises three main elements: (a) contextual contextual factors (e.g., greater lifetime stressor exposure) alter how
factors, including individual and environmental factors (e.g., genetics individuals typically respond to stressors (e.g., repeated threat ap
and developmental contexts), cumulative life stressor exposure (e.g., praisals), which affects health (Epel et al., 2018). The present study
past and current stressors), and protective factors (e.g., social, psycho represented a novel test of this model and sought to advance our un
logical, and behavioural processes); (b) psychophysiological stress derstanding of how lifetime stressor exposure is associated with sport
* Corresponding author.
E-mail address: em2050@bath.ac.uk (E. McLoughlin).
https://doi.org/10.1016/j.psychsport.2021.102078
Received 21 April 2021; Received in revised form 19 August 2021; Accepted 4 October 2021
Available online 6 October 2021
1469-0292/© 2021 Elsevier Ltd. All rights reserved.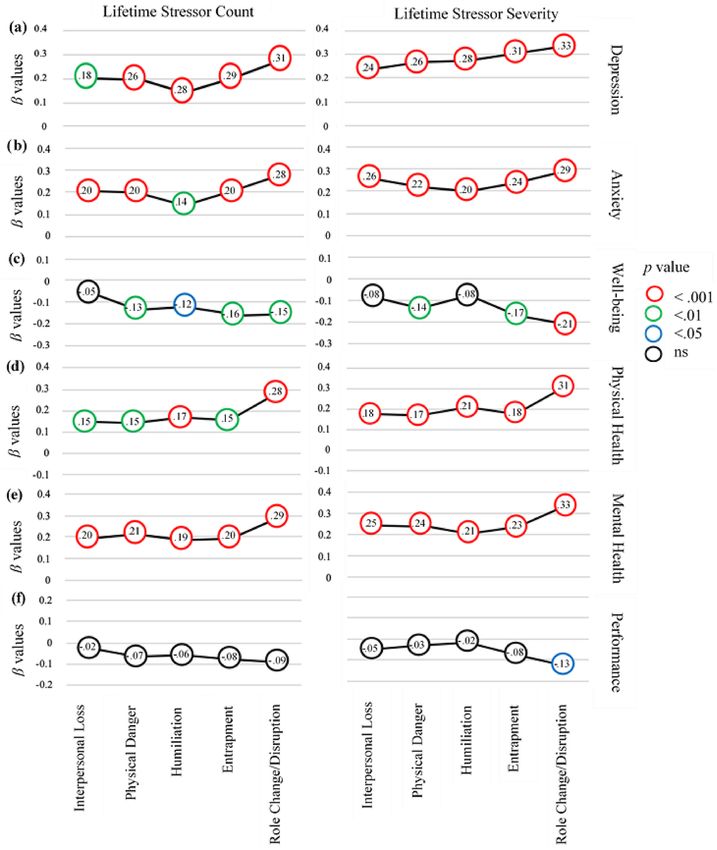
E. McLoughlin et al. Psychology of Sport & Exercise 58 (2022) 102078
performers’ health, well-being, and performance. experiences in the future, and limiting interpersonal relationships
Although the theoretical literature describing how lifetime stressor (McLoughlin et al., 2021). Notwithstanding these findings, this study did
exposure may affect health is large, the empirical literature is surpris not assess sport-specific stressors (e.g., underperformance) and was
ingly limited (Slavich & Shields, 2018). This is partly because no mea restricted to a sample of elite athletes (McLoughlin et al., 2021).
surement tool has existed for systematically assessing lifetime stressor Moreover, the mechanisms linking lifetime stressor exposure with
exposure (Slavich, 2019). To elaborate, prior research has largely health in athletes remains largely unknown despite the substantial dis
defined life stress as a single unitary construct even though different ease burden experienced by this population (McLoughlin et al., 2021).
types of life stressors exist (e.g., acute life events vs. chronic difficulties) Consistent with the predictions of the integrative model of lifespan
and occur across different time periods (e.g., early life vs. adulthood), stress and health (Epel et al., 2018), the relation between lifetime
life domains (e.g., housing, health, work), and social-psychological stressor exposure and health may be partly explained by cognitive ap
characteristics (e.g., interpersonal loss, physical danger, humiliation; praisals (Lazarus & Folkman, 1984). Cognitive appraisal has been
Epel et al., 2018). As a result, the current understanding of lifetime defined as "an evaluative process that determines why and to what
stressor exposure is overly simplistic and has largely ignored the fact extent a particular transaction or series of transactions between the
that different types of stressors can have varying effects on health (Epel person and the environment is stressful" (Lazarus & Folkman, 1984, p.
et al., 2018). 21). The biopsychosocial model (BPSM; Blascovich & Tomaka, 1996) of
To address these issues, G. M. Slavich developed the Stress and challenge and threat extends Lazarus and Folkman’s (1984) trans
Adversity Inventory (STRAIN), which has been used to examine asso actional model of stress by incorporating psychophysiological responses
ciations between lifetime stressor exposure and a variety of psycholog to stress, in order to understand why individuals react differently to
ical, biological, and health outcomes (see Slavich & Shields, 2018). Most stressful situations (Blascovich, 2008a). According to the BPSM, a
notably, greater lifetime stressor exposure has been related to more challenge appraisal occurs when an individual perceives that they have
symptoms of depression (e.g., Pegg et al., 2019) and anxiety disorders (e. sufficient coping resources to meet the demands of a stressful situation,
g., Slavich et al., 2019), and more physical health complaints (e.g., whereas a threat appraisal occurs when an individual perceives that the
respiratory infections; Cazassa et al., 2020). Despite these findings, the demands of a stressful situation exceed their coping resources (Blasco
STRAIN has only been used once in a sporting context (McLoughlin vich, 2008a). This conceptualisation differs from that of Lazarus and
et al., 2021). This is particularly important given recent interest in sport colleagues, who consider challenge and threat as primary appraisals
performers’ mental health and well-being (for a review, see Rice et al., relating to the potential for gain or harm, respectively. Although pre
2021), with some scholars suggesting that sport performers are at dominately situation-specific, research has illustrated that individuals
increased risk of developing mental health problems (Gulliver et al., also have a trait-like tendency to generally appraise stressful situations
2015). as more of a challenge or a threat (Moore et al., 2019; Power & Hill,
The limited use of the STRAIN in the sport psychology literature is 2010; Rumbold et al., 2020). This is particularly important given that
particularly noteworthy given that the sporting environment imposes threat appraisals have been related to poorer health and performance
numerous stressors on sport performers, which are associated with their (Blascovich, 2008b). Therefore, an individual’s tendency to appraise
competitive performance (e.g., opponent rivalry), the sporting organi stressful situations as more of a challenge or a threat may be an
zation within which they operate (e.g., coach-athlete relationship), and important mechanism linking the effects of lifetime stressor exposure to
personal non-sporting life events (e.g., death of a relative; Arnold & health and performance (Epel et al., 2018).
Fletcher, 2021). The consensus from this body of work is that exposure Building on existing research, the present study aimed to: (a) create a
to such stressors can have detrimental consequences for sport per sport-specific stress assessment module (Sport SAM) for the Adult
formers’ health, well-being, and performance (Arnold & Fletcher, 2021). STRAIN to provide an additional life course assessment of sport-related
Indeed, some stressors have been found to negatively impact perfor stressors; (b) examine the Sport SAM’s usability, acceptability, validity
mance (e.g., Arnold et al., 2017), well-being (e.g., Roberts et al., 2019), (viz. concurrent, predictive, and comparative predictive), and test-retest
and health (e.g., Simms et al., 2020). However, some stressors such as reliability; (c) assess how the different types of lifetime (non-sport)
injury have been associated with more positive outcomes (e.g., stress- stressor exposure assessed by the Adult STRAIN are associated with
related growth; Roy-Davis et al., 2017). One potential explanation for depression, anxiety, well-being, general mental and physical health
these disparate findings could be the ways in which sport performers complaints, and subjective sports performance; and (d) investigate if the
appraise stressful situations (Lazarus & Folkman, 1984). Although association between lifetime stressor exposure (non-sport and sport-
insightful, most stress-related research in the sporting domain has specific) and the aforementioned outcomes is mediated by the general
examined certain types of life stressors in isolation (e.g., competitive, tendency to appraise stressful situations as more of a challenge or a
organizational, or personal), as opposed to assessing the combined and threat. Based on prior research, we hypothesized that greater lifetime
cumulative effect of stressors on health (Fletcher et al., 2006). stressor exposure (non-sport and sport-specific) would be associated
Furthermore, prior studies have relied on trauma or life event checklists with poorer health, well-being, and subjective sports performance.
to assess sport performers’ exposure to negative life events (e.g., Moore Furthermore, we hypothesized that trait stress appraisals would mediate
et al., 2017). Despite some strengths, such as brevity, self-report the relation between lifetime stressor exposure (non-sport and sport-
checklists have been criticised for only assessing the frequency of a specific) and outcomes, such that sport performers who reported expe
relatively limited number of events (e.g., death of a loved one) and riencing greater lifetime stressor exposure would be more likely to
overlooking other key dimensions of lifetime stressors (e.g., severity; report typically appraising stressors as more of a threat, in turn leading
Slavich, 2019). to poorer health, well-being, and performance.
To our knowledge, only one study has addressed these concerns by
using the STRAIN to assess how lifetime stressor exposure is associated 1. Method
with mental health and well-being among elite athletes (McLoughlin
et al., 2021). The results of this study revealed that elite athletes who 1.1. Participants
experienced more chronic difficulties and adulthood stressors exhibited
greater symptoms of depression and anxiety, and poorer psychological Participants were 395 sport performers (251 female, 144 male) be
well-being. Additionally, the findings from follow-up interviews with tween the ages of 18 and 63 years old (Mage = 22.50 years, SD = 5.33).
elite athletes suggested that cumulative lifetime stressor exposure Participants were from a variety of sports (e.g., swimming, soccer, net
fostered poorer mental health and well-being by promoting maladaptive ball) and had an average of 9.91 years (SD = 6.43) of experience in their
long-term coping strategies, increasing susceptibility to stressful sport. Participants represented a range of competitive levels, with 8.1%
2
E. McLoughlin et al. Psychology of Sport & Exercise 58 (2022) 102078
performing at senior international level, 12.1% at international level, sport-specific stressors were reviewed to catalogue stressors that have
18.0% at national level, 15.4% at regional level, 28.6% at university been frequently assessed in the sport psychology literature (e.g., Orga
level, 5.1% at county level, and 12.7% at club level. Furthermore, par nizational Stressor Indicator for Sport Performers, Arnold et al., 2013;
ticipants represented an international sample and were from 22 different Life Events Survey for Collegiate Athletes, Petrie, 1992). Third, review
countries, including the United Kingdom, America, France, and Russia. articles describing stressors faced by sport performers were identified
An a priori power calculation using G*Power software (Faul et al., 2007) and reviewed (e.g., Howells et al., 2017; Sarkar & Fletcher, 2014).
revealed that a minimum sample of 395 participants was required to Fourth, an exhaustive review of studies that have examined the impact
perform multiple regression analyses with six predictors (i.e., lifetime of sport-specific stressors on sport performers’ mental and physical
stressor exposure, age, sex, sport type, performance level, and length of health was conducted to identify stressors that consistently predict poor
time competing in sport). The effect size entered into this calculation health (Rice et al., 2016). Fifth, the stressors most frequently reported by
was based on the small effect (β = 0.16) between stress appraisals and sport performers and consistently associated with poor health were then
depression reported in prior research (e.g., Tomaka et al., 2018), and identified from this rigorous literature search and selected to remain in
was entered with an alpha of 0.05 and power of 0.80. This sample size is the item set for the Sport SAM. As a result, some items were removed (e.
also consistent with the recommendations of Schönbrodt and Perugini g., funding/scholarship, balancing dual career, media obligations) given
(2013), who suggested that a minimum sample size of 238 participants that they were not frequently reported by all sport performers and/or
is required for correlations to stabilize. consistently associated with poor health. Furthermore, stressors already
assessed by the Adult STRAIN were removed to avoid redundancy (e.g.,
1.2. Study design and procedure illness, relocation, and finance). This process resulted in an initial list of
stressors that were evidence-based (see Supplementary Materials
This study used a cross-sectional design. Following institutional Table S1). It is important to note that this instrument did not aim to
ethical approval (University of Bath, Research Ethics Approval Com assess all stressors that sport performers experience, but rather the most
mittee for Health, EP 18/19 107), sport performers were recruited using prevalent and impactful stressors.
the research team’s existing contacts, and by emailing clubs, sport or In accordance with scale development recommendations (DeVellis,
ganizations, and universities to advertise and distribute study informa 2017), an expert and usability panel reviewed the initial list of items.
tion. In addition, the study was advertised on social media (e.g., Five leading sport psychologists formed the expert panel and provided
Twitter). Data were collected between April and June 2020 during the feedback on each stressor item in terms of its relevance (e.g., does this
Coronavirus pandemic. Once recruited, participants were sent a link to stressor relate to the sport environment?), clarity (e.g., is this stressor
the online survey, which was created by JISC Online Surveys (htt easily understood?), and specificity (e.g., is this stressor specific
ps://www.onlinesurveys.ac.uk) and took approximately 30 minutes to enough?). The expert panel was also asked five open-ended questions to
complete. Immediately before completing the online survey, partici assess: (1) whether the Sport SAM was pitched at an appropriate level for
pants were advised of their ethical rights (e.g., confidentiality, ano all sport-performers, (2) if they would add anything to the Sport SAM to
nymity, right to withdraw) via an information sheet and subsequently improve it (e.g., other key stressors), (3) if they would delete any of the
provided informed consent. items from the Sport SAM, (4) if they would make any modifications to
the Sport SAM, and (5) if they had any further comments on the Sport
1.3. Measures SAM. Additionally, we recruited a usability panel consisting of 20 sport
performers from a range of individual and team sports and competitive
1.3.1. Lifetime (non-sport) stressor exposure levels to gather feedback on the item set, order, and wording. Finally,
Lifetime stressor exposure was assessed using the Adult STRAIN the item set was finalized based on the expert and usability panel
(Slavich & Shields, 2018), which assesses 55 major life stressors feedback, and with the developer of the STRAIN (G.M. Slavich), in order
including 26 acute life events (e.g., death of a loved one) and 29 chronic to maximize the clarity, readability, and item order.
difficulties (e.g., ongoing health problems). Once a stressor is endorsed, The final version of the Sport SAM was deemed multidimensional as
and to ensure a multidimensional assessment of lifetime stressor expo it assessed the frequency (1 to 5 or more times), severity (1 = not at all to
sure, follow-up questions are asked that determine the stressor’s fre 5 = extremely), timing (1 = ongoing to 7 = over 5 years ago), and duration
quency (1 to 5 or more times), severity (1 = not at all to 5 = extremely), (years and/or months) of eight different sport-specific stressors,
timing (1 = ongoing to 7 = over 5 years ago), and duration (years and/or including four that were more competitive (i.e., overtraining; under
months). Stressors can be categorized by stressor type (acute life events performance; training while injured; and injury) and four that were
vs. chronic difficulties), timing (early life vs. adulthood), primary life more organizational (i.e., excessive external pressure to perform; non-
domain (housing, education, work, health, marital/partner, reproduc selection; coach-athlete relationship difficulties; and bullying) in na
tion, financial, legal, other relationships, death, life-threatening situa ture.1 The main variables used for analyses were: (a) total count of sport-
tions, and possessions), and core social-psychological characteristic specific stressors, which was calculated by summing the number of
(interpersonal loss, physical danger, humiliation, entrapment, and role stressors experienced (possible range = 0–24),2 and (b) total severity of
change/disruption). The primary analyses were based on the STRAIN’s sport-specific stressors, which was calculated by summing the perceived
two main variables: (a) total count of lifetime stressors, calculated by severity of the stressors experienced (possible range = 0–40).
summing the number of stressors experienced (range = 0–166); and (b)
total severity of lifetime stressors, calculated by summing the perceived
severity of the stressors experienced (range = 0–265). The Adult STRAIN
has demonstrated excellent test-retest reliability (rs = 0.90 to 0.95), and
very good concurrent (rs = 0.15 to 0.62) and predictive validity across a 1
variety of health-related outcomes (e.g., Cazassa et al., 2020). The Sport SAM items are available on request from the corresponding
author.
2
For the Sport SAM, the total number of stressors that can be endorsed is
1.3.2. Sport-specific stress assessment module (Sport SAM)
eight. However, four of these stressors are acute life events and can thus occur
A five-step procedure was used to develop and add a sport-specific more than once (i.e., 1 to 5 or more times) in the STRAIN system. In contrast, the
stress assessment module (Sport SAM) to the Adult STRAIN. First, a other four stressors are chronic difficulties and, according to the STRAIN, are
detailed literature review was conducted to identify stressors that have assessed only once for the most-severe occurrence to ensure an efficient lifetime
been commonly reported by sport performers (e.g., Arnold & Fletcher, assessment. Consequently, the maximum number of sport-specific stressors an
2012, 2021; Rice et al., 2016). Second, existing measures of individual could have experienced was 24.
3
E. McLoughlin et al. Psychology of Sport & Exercise 58 (2022) 102078
1.3.3. Depression produce a total score (range = 6–30), with higher total scores indicating
The Patient Health Questionnaire (PHQ-9; Kroenke et al., 2001) was greater mental health complaints. Previously, the K-6 has demonstrated
used to assess symptoms of depression over the past two weeks. The very good internal consistency (α = 0.86), and excellent predictive
PHQ-9 includes nine items (e.g., little interest or pleasure in doing validity (e.g., Kessler et al., 2002). In this study, the K-6 demonstrated
things), with each item scored on a 4-point Likert scale ranging from very good internal consistency (α = 0.88).
0 (not at all) to 3 (nearly every day). Total scores were calculated by
summing participants’ responses for the individual items (range = 1.3.8. Subjective sports performance
0–27). Higher total scores indicated greater symptoms of depression, Three items from the Athlete Satisfaction Questionnaire (ASQ;
with scores of 5, 10, 15, and 20 representing mild, moderate, moderately Riemer & Chelladurai, 1998) were used to assess subjective sports per
severe, and severe depression, respectively (Kroenke et al., 2001). Pre formance over the past four months. This timeframe was used due to
viously, the PHQ-9 has demonstrated very good internal consistency (α data collection occurring during the Coronavirus pandemic when
= 0.86 to 0.89) and good test-retest reliability (r = 0.84), as well as good sporting involvement was largely paused. The ASQ includes three items
construct and criterion validity (Kroenke et al., 2001). In this study, the (e.g., the degree to which I have reached my performance goals), with
PHQ-9 demonstrated good internal consistency (α = 0.82). each item scored on a 7-point Likert scale ranging from 1 (not at all
satisfied) to 7 (extremely satisfied). The scores for all items were summed
1.3.4. Anxiety to produce a total score (range = 3–21), with higher total scores indi
The Generalized Anxiety Disorder scale (GAD-7; Spitzer et al., 2006) cating greater performance satisfaction. Previously, the ASQ has
was used to assess symptoms of anxiety over the past two weeks. The demonstrated good criterion and construct-related validity, as well as
GAD-7 includes seven items (e.g., feeling nervous, anxious, or on-edge), acceptable-to-excellent internal consistency (α = 0.78 to 0.95; Riemer &
with each item scored on a 4-point Likert scale ranging from 0 (not at all) Chelladurai, 1998). In this study, the ASQ demonstrated very good in
to 3 (nearly every day). Total scores were calculated by summing par ternal consistency (α = 0.89).
ticipants’ responses for the individual items (range = 0–21). Higher total
scores indicated greater symptoms of anxiety, with scores of 5, 10, and 1.3.9. Stress appraisals
15 representing mild, moderate, and severe anxiety, respectively (Spit The Appraisal of Challenge and Threat Scale (ACTS; Tomaka et al.,
zer et al., 2006). Previously, the GAD-7 has demonstrated excellent in 2018) was used to assess individual differences in trait stress appraisals.
ternal consistency (α = 0.89 to 0.92) and good test-retest reliability (rs In this study, the ‘transportation’ principal component from the ACTS (e.
= 0.83), as well as good convergent, construct, criterion, and factorial g., car breaks down in rush hour) was removed to ensure all items were
validity (e.g., Spitzer et al., 2006). In this study, the GAD-7 demon relevant to the entire sample (i.e., not all participants will have driven a
strated very good internal consistency (α = 0.88). car). Next, we included only the highest three factor loading items for
the remaining five principal components (i.e., conflict situations, un
1.3.5. Well-being expected events, public speaking, social anxiety, and financial issues) in
The World Health Organization’s Well-being Index (WHO-5) was the online survey to aid brevity. As a result, participants were presented
used to assess psychological well-being over the past two weeks (World with 15 potentially stressful events (e.g., you find out that you have a
Health Organization, 1998). The WHO-5 consists of five items (e.g., I chronic disease), with each event followed by one item assessing pri
have felt cheerful and in good spirits), with each item scored on a 6-point mary appraisals (i.e., how demanding is this event to you?), and one
Likert scale ranging from 0 (at no time) to 5 (all of the time). The total assessing secondary appraisals (i.e., how able are you to take action to
score across all five items, ranging from 0 to 25, was multiplied by 4 to deal with it?). Both items were scored on a 5-point Likert scale ranging
produce a final score (range = 0–100). Higher final scores represented from 1 (not at all) to 5 (very much). Scores were calculated by subtracting
greater well-being (World Health Organization, 1998). Previously, the the secondary appraisal score from the primary appraisal score for each
WHO-5 has demonstrated excellent construct and convergent validity, event, and then calculating the mean across all potentially stressful
and excellent internal consistency (α = 0.90; Topp et al., 2015). In this events to derive an overall appraisal tendency score (range = − 4 to +4).
study, the WHO-5 demonstrated good internal consistency (α = 0.80). Positive scores indicated a tendency to appraise events as threatening,
whereas negative scores indicated a tendency to appraise events as
1.3.6. Physical health complaints challenging. Previously, the ACTS has demonstrated good factorial
The Physical Health Questionnaire (PHQ; Schat et al., 2005) was validity, reliability, and acceptable-to-good construct validity (α = 0.77
used to assess general physical health complaints over the past month. to 0.88; Tomaka et al., 2018). In this study, the ACTS demonstrated good
The PHQ includes 14 items (e.g., how often have you had difficulty internal consistency (α = 0.86).
getting to sleep at night?) assessing sleep disturbances, headaches, and
respiratory infections. Responses to 11 of the items were scored on a 1.4. Data analysis
7-point Likert scale ranging from 1 (not at all) to 7 (all the time), whereas
responses to two items were scored on a 7-point Likert scale ranging Data were analyzed using SPSS version 25.0. First, checks revealed
from 0 times to 7 + times, and one item was scored on a 7-point Likert no missing data and that all data were non-normally distributed. Second,
scale ranging from 1 day to 7 + days. The scores for all items were outlier analyses were performed prior to the main statistical analyses.
summed to produce a total score (range = 12–98), with higher total Specifically, thirteen univariate outliers were detected by identifying z-
scores indicating greater physical health complaints. Previously, the scores which were greater or less than 3.29. Moreover, multivariate
PHQ has demonstrated acceptable factorial validity, excellent conver outliers were detected by considering Cook’s distance (values < 1.000)
gent and divergent validity, and good internal consistency (α = 0.83; and Mahalanobis distance (cut-off value of 10.828). Third, square root
Schat et al., 2005). In this study, the PHQ demonstrated good internal transformations were performed to ensure that all data were normally
consistency (α = 0.80). distributed (i.e., skewness and kurtosis z-scoresE. McLoughlin et al. Psychology of Sport & Exercise 58 (2022) 102078
verify the concurrent validity of the Sport SAM in relation to the Adult
15
STRAIN, Pearson correlations and hierarchical linear regression ana
–
lyses were conducted. Specifically, total count or severity of lifetime
(non-sport) stressors were entered into separate models as dependent
.14**
14
variables. In each model, total count or severity of sport-specific
–
stressors were entered as independent variables at Step 1 and a priori
covariates were entered at Step 2 (i.e., age; sex; sport type; highest
.22***
-.12*
performance level; and length of time competing in sport). Third, to
13
–
assess predictive validity, Pearson correlations and hierarchical linear
regression models were used to evaluate the Sport SAM in relation to the
.14**
-.02
.08
outcomes assessed. Specifically, depression, anxiety, well-being, phys
12
–
ical and mental health complaints, and subjective sports performance
were entered into separate models as dependent variables. In each
.60***
-.11*
-.04
model, the independent variables were entered at Step 1 (e.g., total
.04
11
–
count or severity of stressors) and the a priori covariates were entered at
Step 2. These hierarchical linear regression analyses were repeated with
-.24***
the same independent variables, but in reverse order, to verify whether
.15**
-.13
.05
.10
10
the predictive validity held true regardless of the order in which the
–
variables were entered into the regression models. Fourth, to examine
-.21***
the comparative predictive validity of the Sport SAM in relation to the
.84***
.13**
-.03
-.09
Adult STRAIN, each scale was included in the regression models
.08
9
–
simultaneously. Specifically, hierarchical linear regression analyses
were conducted to examine the percentage of variance explained by the
.24***
.29***
.19***
Sport SAM over and above the total variance previously explained by a
.11*
-.07
.05
.04
8
–
priori covariates and the Adult STRAIN. Specifically, a priori covariates
were entered at Step 1, and independent variables were entered at Step 2
.92***
.22***
.24***
.16**
(e.g., Adult STRAIN) and Step 3 (e.g., Sport SAM). Fifth, test-rest reli
-.01*
.002
.09
.02
ability of the Sport SAM was examined using intraclass correlation co
7
–
efficients, which were based on absolute agreement in a two-way mixed
.017**
effects model. Values of 0.90 indi
.11*
.10*
-.06
-.08
.09
.06
.09
.01
cated poor, moderate, good, and excellent reliability, respectively (Koo 6
–
& Li, 2016).
Next, a series of hierarchical linear regression analyses were con
.26***
.30***
.20***
.28***
.32***
.17**
-.11*
-.01
ducted to examine if the different lifetime (non-sport) stressor types
.01
.07
5
–
(acute life events vs. chronic difficulties), time periods (early life vs.
adulthood), life domains (e.g., work, health, death), and core social-
-.18***
.57***
.22***
.27***
.33***
.22***
.32***
.17**
-.004
psychological characteristics (e.g., physical danger, humiliation,
-.04
-.01
entrapment) from the Adult STRAIN were significantly associated with
4
–
the outcomes assessed, above and beyond the a priori covariates. Spe
.43***
.34***
.31***
cifically, study outcomes were entered into separate models as depen
.13**
.16**
-.13*
-.05
-.03
-.07
-.01
.07
.06
dent variables. In each model, the independent variables were entered at
3
–
Step 1 (e.g., total count or severity of stressors) and the a priori cova
riates were entered at Step 2. However, due to space constraints, we only
.40***
.72***
.54***
.28***
.33***
.20***
.14**
.15**
Medians, standard deviations, and intercorrelations for main study variables.
.13*
-.07
-.05
-.04
report Step 2 of these hierarchical linear regression models. Four life
.03
2
–
domains (i.e., education; work; reproduction; and legal/crime) were
excluded from these analyses as very few participants reported experi
.70***
.50***
.67***
.51***
.20***
.34***
.37***
.21***
.24***
-.12*
encing these stressors.
-.03
-.02
-.02
.07
1
–
Finally, to examine if trait stress appraisals (i.e., challenge and
threat) mediated the relations between stressor exposure [i.e., total
15.94
10.84
18.24
4.44
4.40
5.23
1.36
7.70
4.21
7.39
5.33
6.43
count or severity of lifetime (non-sport) stressors, total count or severity
SD
–
–
–
of sport-specific stressors] and the outcomes assessed, mediation ana
lyses were conducted using the Process SPSS custom dialog (Hayes,
Median
2018). This custom dialog tests the total, direct, and indirect effect of an
64.00
13.00
32.00
19.00
21.00
10.00
5.00
4.00
4.00
9.00
5.00
9.00
independent variable on a dependent variable through a proposed
–
–
–
Note. *p < .05; **p < .01; ***p < .001.
mediator and allows inferences regarding indirect effects using 10,000
bootstrap confidence intervals. The total, direct, and indirect effects
15. Length of time competing in sport
8. Total severity of lifetime stressors
10. Total severity of sport stressors
6. Subjective sporting performance
were deemed significant if the 95% confidence intervals did not contain
7. Total count of lifetime stressors
9. Total count of sport stressors
zero.
14. Highest performance level
5. Physical health complaints
4. Mental health complaints
2. Results
2.1. Descriptive statistics
13. Sport type
1. Depression
3. Well-being
2. Anxiety
All descriptive statistics including the medians and standard de
11. Age
12. Sex
Table 1
viations for, and correlations between, the main study variables are
shown in Table 1.
5E. McLoughlin et al. Psychology of Sport & Exercise 58 (2022) 102078
Table 2
Comparative predictive validity of the Sport SAM and Adult STRAIN.
Sport SAM Adult STRAIN
β
Stressor Count: Depression (PHQ-9) .21*** .37***
Anxiety (GAD-7) .13* .30***
Well-being (WHO-5) -.05 -.15**
Physical Health (PHQ) .24*** .29***
Mental Health (K-6) .23*** .31***
Subjective Sports Performance (ASQ) -.05 -.09
Stressor Severity: Depression (PHQ-9) .24*** .41***
Anxiety (GAD-7) .19*** .36***
Well-being (WHO-5) -.05 -.19***
Physical Health (PHQ) .27*** .32***
Mental Health (K-6) .32*** .37***
Subjective Sports Performance (ASQ) -.02 -.09
Note. *p < .05, **p < .01, ***p < .001, two-tailed. All associations are adjusted for relevant covariates including age, sex, sport type, highest performance level, and
length of time competing in sport.
2.2. Usability and acceptability of the Sport SAM .001) health complaints, but not well-being (β = − 0.05, p = .309) or
subjective sports performance (β = − 0.05, p = .379).3
The Adult STRAIN and Sport SAM were completed together, taking Likewise, in Step 1 of the regression analyses, total severity of sport-
an average of 18 min and 58 s to complete (SD = 8 min 47 s; interquartile specific stressors was significantly associated with greater symptoms of
range = 13 min 52 s to 21 min 23 s). The acceptability of the Sport SAM depression (β = 0.24, p < .001) and anxiety (β = 0.20, p < .001), and
was excellent, with only 21 (5%) participants failing to complete the more physical (β = 0.28, p < .001) and mental (β = 0.32, p < .001)
instrument, producing a very high completion rate (95%). Following health complaints, but not well-being (β = − 0.06, p = .259) or subjective
completion of the Sport SAM and Adult STRAIN, participants were asked sports performance (β = − 0.06, p = .263). Again, these effects were
to provide feedback on whether any of the items were upsetting or robust while controlling for covariates in Step 2 of the regression ana
distressing. No participants reported any distress as a result of answering lyses, with total severity of sport-specific stressors still significantly
the Sport SAM or Adult STRAIN questions. associated with greater symptoms of depression (β = 0.24, p < .001) and
anxiety (β = 0.19, p < .001), and more physical (β = 0.27, p < .001) and
2.3. Concurrent validity mental (β = 0.32, p < .001) health complaints, but not well-being (β =
− 0.05, p = .350) or subjective sports performance (β = − 0.02, p = .752).
Next, we examined how the Sport SAM performed in relation to the Therefore, overall, the Sport SAM exhibited very good predictive val
Adult STRAIN. In Step 1 of the regression analyses, total count of sport- idity for mental and physical health but not well-being or subjective
specific stressors was significantly associated with total count of lifetime sports performance.
(non-sport) stressors (β = 0.23, p < .001). Similarly, total severity of
sport-specific stressors was significantly associated with the total 2.5. Comparative predictive validity
severity of lifetime (non-sport) stressors (β = 0.29, p < .001). In Step 2
of the regression analyses, these effects were robust while controlling for As shown in Table 2, total count and severity of sport-specific
covariates, with total count of sport-specific stressors still significantly stressors from the Sport SAM were significantly associated with all the
associated with total count of lifetime (non-sport) stressors (β = 0.23, p outcomes assessed except well-being and subjective sports performance.
< .001), and total severity of sport-specific stressors still significantly Moreover, these results were nearly identical to those observed for the
associated with total severity of lifetime (non-sport) stressors (β = 0.30, Adult STRAIN, with total count and severity of lifetime (non-sport)
p < .001). Therefore, these results provide initial evidence for the con stressors significantly associated with all outcomes except for subjective
current validity of the Sport SAM. sports performance.
Next, to directly compare the Sport SAM and Adult STRAIN, we
2.4. Predictive validity examined the percentage of variance that was explained by the Sport
SAM out of the total variance explained by the complete model (i.e., age;
The predictive validity of the Sport SAM was evaluated in relation to sex; sport type; highest performance level; length of time competing in
mental and physical health, well-being, and sports performance. In Step sport; Adult STRAIN; and Sport SAM). To calculate the increase in
1 of the regression analyses, total count of sport-specific stressors was variance explained by the Sport SAM over and above the total variance
significantly associated with greater symptoms of depression (β = 0.21, previously explained, we divided the ΔR2 of the third model (i.e.,
p < .001) and anxiety (β = 0.13, p = .012), and more physical (β = 0.20, Covariates + Adult STRAIN + Sport SAM) by the Total R2 from the
p < .001) and mental (β = 0.22, p < .001) health complaints, but not second model (i.e., Covariates + Adult STRAIN). Total count of sport-
well-being (β = − 0.07, p = .182) or subjective sports performance (β = specific stressors explained a significant amount of variance in symp
− 0.09, p = .078). Importantly, these effects were robust while control toms of depression (10.26% increase in variance explained), physical
ling for covariates in Step 2 of the regression analyses, with total count health complaints (13.86% increase in variance explained), and mental
of sport-specific stressors still significantly associated with greater health complaints (13.87% increase in variance explained), but not
symptoms of depression (β = 0.21, p < .001) and anxiety (β = 0.13, p = symptoms of anxiety, well-being, or subjective sports performance.
.012), and more physical (β = 0.24, p < .001) and mental (β = 0.23, p < Furthermore, total severity of sport-specific stressors explained a
3
When these regression analyses were repeated with the same independent
variables but in reverse order, the results were nearly identical to those
observed here, thus providing further support for the predictive validity of the
Sport SAM.
6E. McLoughlin et al.
Table 3
Comparative predictive validity of the Adult STRAIN and Sport SAM by highlighting the variance explained in each outcome in each multiple linear regression model.
Model Depression Anxiety Well-being Physical Health Mental Health Performance
2 2 2 2 2 2 2 2 2 2 2 2 2 2 2
R Adj.R ΔR R Adj.R ΔR R Adj.R ΔR R Adj.R ΔR R Adj.R ΔR R2 Adj.R2 ΔR2
Count:
Covariates .03 .01 – .04 .03 – .02 .01 – .12 .11 – .08 .07 – .04 .03 –
Covariates + Adult STRAIN .16 .14 .13*** .13 .11 .09*** .04 .03 .02** .20 .19 .08*** .16 .16 .09*** .05 .03 .01
Covariates + Adult STRAIN + Sport SAM .17 .16 .02*** .13 .11 .00*** .04 .03 .00* .23 .22 .03*** .18 .18 .02*** .05 .03 .00
% of variance explained by the Sport SAM over 10.26% 3.17% 0% 13.86% 13.87% 2.08%
and above the total variance previously explained
Depression Anxiety Well-being Physical Health Mental Health Performance
Model R2 Adj.R2 ΔR2 R2 Adj.R2 ΔR2 R2 Adj.R2 ΔR2 R2 Adj.R2 ΔR2 R2 Adj.R2 ΔR2 R2 Adj.R2 ΔR2
7
Severity:
Covariates .03 … .01 … – .04 .03 – .02 .01 – .12 .11 – .08 .07 – .04 .03 –
Covariates + Adult STRAIN .19 .17 .16*** .16 .15 .12*** .06 .04 .04*** .22 .21 .01*** .21 .20 .13*** .05 .03 .01
Covariates + Adult STRAIN + Sport SAM .20 .19 .01*** .17 .15 .01*** .06 .04 .00*** .25 .24 .03*** .25 .24 .04*** .05 .03 .00
% of variance explained by the Sport SAM over and 7.53% 3.70% 0% 13.70% 19.81% 0%
above the total variance previously explained
Note. *p < .05, **p < .01, ***p < .001, two-tailed. To calculate the increase in variance explained by the Sport SAM over and above the total variance previously explained, we divided the ΔR2 of the third model (i.e.,
Covariates + Adult STRAIN + Sport SAM) by the Total R2 from the second model (i.e., Covariates + Adult STRAIN).
Psychology of Sport & Exercise 58 (2022) 102078E. McLoughlin et al. Psychology of Sport & Exercise 58 (2022) 102078
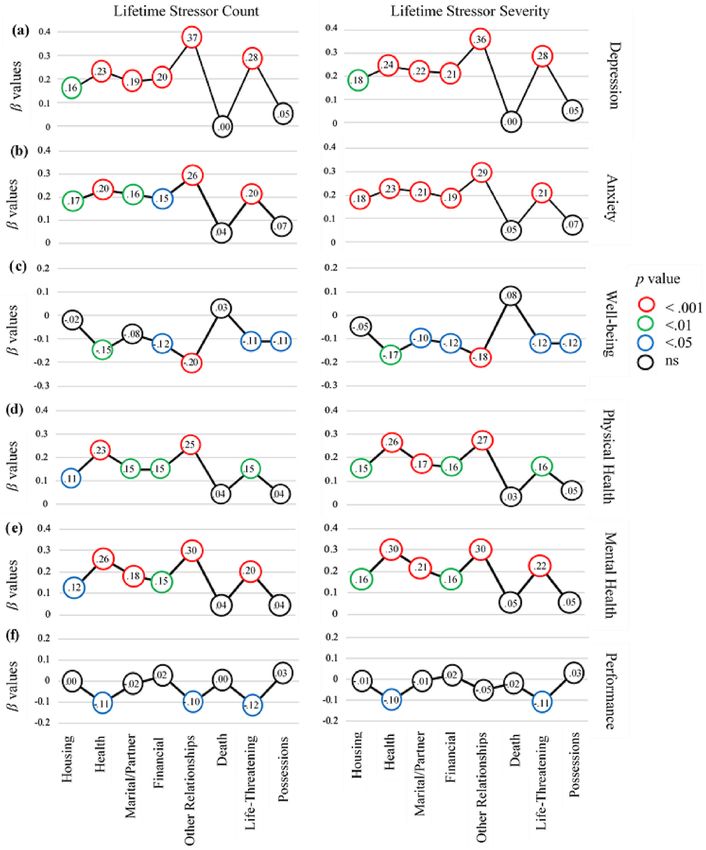
Figure 1. Multiple linear regression models examining associations between the primary life domains assessed by the Adult STRAIN and the six outcomes assessed
significant amount of variance in symptoms of depression (7.53% in 2.6. Test-retest reliability
crease in variance explained), physical health complaints (13.70% in
crease in variance explained), and mental health complaints (19.81% To assess the test-retest reliability of both the Sport SAM and Adult
increase in variance explained), but not symptoms of anxiety, well- STRAIN, 135 participants recompleted these instruments on a second
being, or subjective sports performance (see Table 3). Therefore, occasion approximately two months after the first administration (M =
assessing sport-related stressors added significant value over and above 52.80 days; SD = 11.78; Range = 20–76 days). For the Sport SAM, very
assessing non-sport-related stressors over the life course for several good test-retest reliability was observed for both total count (ricc = 0.87,
outcomes. p < .001) and total severity (ricc = 0.89, p < .001) of sport-specific
stressors. In turn, excellent test-retest reliability was observed for the
Adult STRAIN for both total count (ricc = 0.95, p < .001) and total
8E. McLoughlin et al. Psychology of Sport & Exercise 58 (2022) 102078
Figure 2. Multiple linear regression models examining associations between the core social-psychological characteristics assessed by the Adult STRAIN and the six
outcomes assessed
severity (ricc = 0.93, p < .001) of lifetime (non-sport) stressors. p < .001), as well as physical (β = 0.19, p < .001) and mental (β = 0.20,
p < .001) health complaints, above and beyond covariates, but not well-
being (β = − 0.04, p = .410) or subjective sports performance (β =
2.7. Lifetime (non-sport) stressor count characteristics
− 0.04, p = .439). In contrast, total count of chronic difficulties was
significantly associated with symptoms of depression (β = 0.41, p <
Next, a series of hierarchical linear regression analyses were con
.001) and anxiety (β = 0.35, p < .001), as well as well-being (β = − 0.23,
ducted to examine associations between the different types of lifetime
p < .001), physical (β = .32, p < .001) and mental (β = 0.36, p < .001)
(non-sport) stressor count and sport performers’ health, well-being, and
health complaints, and subjective sports performance (β = − 0.12, p =
subjective sports performance. With respect to stressor type (acute vs.
.014), above and beyond covariates.
chronic), total count of acute life events was significantly associated
With respect to the timing of stressor exposure (early life vs.
with symptoms of depression (β = 0.24, p < .001) and anxiety (β = 0.20,
9E. McLoughlin et al. Psychology of Sport & Exercise 58 (2022) 102078
Table 4
Mediation analyses with stressor exposure (i.e., total count of lifetime stressors, total severity of lifetime stressors, total count of sport-specific stressors, and total
severity of sport-specific stressors) entered as the independent variable; study outcomes (i.e., depression, anxiety, well-being, general physical and mental health
complaints, or subjective sports performance) entered as the dependent variable; and trait stress appraisals (i.e., challenge and threat) entered as the potential
mediator.
IV DV Effect SE LL 95% CI UL 95% CI
Total Count of Lifetime Stressors Depression .010 .015 -.021 .040*
Anxiety .013 .020 -.027 .052*
Well-being -.009 .014 -.036 .019*
Physical Health Complaints .011 .018 -.024 .047*
Mental Health Complaints .010 .015 -.020 .039*
Subjective Sports Performance -.001 .001 -.002 .003*
Total Severity of Lifetime Stressors Depression .021 .008 .005 .037*
Anxiety .029 .011 .007 .052*
Well-being -.020 .009 -.038 -.005*
Physical Health Complaints .025 .010 .006 .045*
Mental Health Complaints .022 .008 .006 .039*
Subjective Sports Performance .000 .002 -.003 .003*
Total Count of Sport-Specific Stressors Depression .004 .018 -.030 .042*
Anxiety .005 .024 -.041 .053*
Well-being -.003 .017 -.040 .039*
Physical Health Complaints .004 .020 -.034 .046*
Mental Health Complaints .004 .018 -.032 .038*
Subjective Sports Performance .000 .001 -.003 .002*
Total Severity of Sport-Specific Stressors Depression .027 .013 .003 .055*
Anxiety .036 .018 .003 .073*
Well-being .025 .013 -.054 -.002*
Physical Health Complaints .030 .015 .002 .061*
Mental Health Complaints .027 .013 .002 .052*
Subjective Sports Performance .000 .002 -.004 .003*
Note. LL = lower limit; CI = confidence interval; UL = upper limit. * = significant indirect effect.
adulthood), total count of early life stressors was significantly associated p < .001) health complaints, and subjective sports performance (β =
with symptoms of depression (β = 0.26, p < .001) and anxiety (β = 0.22, − 0.10, p = .041), above and beyond covariates.
p < .001), as well as physical (β = 0.16, p = .001) and mental (β = 0.20, With respect to the timing of stressor exposure (early life vs adult
p < .001) health complaints, above and beyond covariates, but not well- hood), total severity of early life stressors was significantly associated
being (β = − 0.05, p = .337) or subjective sports performance (β = with symptoms of depression (β = 0.30, p < .001) and anxiety (β = 0.25,
− 0.07, p = .171). In contrast, total count of adulthood stressors was p < .001), as well as physical (β = 0.20, p < .001) and mental (β = 0.24,
significantly associated with symptoms of depression (β = 0.33, p < p < .001) health complaints, above and beyond covariates, but not well-
.001) and anxiety (β = 0.28, p < .001), as well as well-being (β = − 0.18, being (β = − 0.09, p = .081) or subjective sports performance (β =
p = .001), and physical (β = 0.29, p < .001) and mental (β = 0.30, p < − 0.07, p = .161). In contrast, total severity of adulthood stressors was
.001) health complaints, above and beyond covariates, but not subjec significantly associated with symptoms of depression (β = 0.34, p <
tive sports performance (β = − 0.07, p = .194). .001) and anxiety (β = 0.31, p < .001), as well as well-being (β = − 0.20,
As shown in Figure 1, most primary life domains assessed by the p < .001), and physical (β = 0.30, p < .001) and mental (β = 0.34, p <
Adult STRAIN were significantly associated with outcomes for lifetime .001) health complaints, above and beyond covariates, but not subjec
(non-sport) stressor count (ps ≤ .040). Stressors involving other re tive sports performance (β = − 0.07, p = .154).
lationships were most strongly associated with outcomes, whereas As shown in Figure 1, most primary life domains were significantly
stressors involving death and possessions were not related to outcomes. associated with outcomes for lifetime (non-sport) stressor severity (ps ≤
As shown in Figure 2, most social-psychological characteristics were .049). Stressors involving other relationships were most strongly asso
significantly associated with outcomes for lifetime (non-sport) stressor ciated with outcomes, whereas those involving death and possessions
count (ps ≤ .017), except for subjective sports performance. Stressors were not associated with outcomes. As shown in Figure 2, most social-
involving role change/disruption were most strongly associated with psychological characteristics were significantly associated with out
outcomes. comes for lifetime (non-sport) stressor severity (ps ≤ .013), except for
subjective sports performance. Stressors involving role change/disrup
tion were most strongly associated with outcomes.
2.8. Lifetime (non-sport) stressor severity characteristics
Next, a series of hierarchical linear regression analyses were con 2.9. Mediation analyses
ducted to examine associations between the different types of lifetime
(non-sport) stressor severity and sport performers’ health, well-being, Finally, we examined whether the relations between stressor expo
and subjective sports performance. With respect to stressor type (acute sure (non-sport and sport-specific) and outcomes were mediated by
vs chronic), the total severity of acute life events was significantly participants’ trait stress appraisals. The results revealed no significant
associated with symptoms of depression (β = 0.29, p < .001) and anxiety indirect effects between total count of lifetime (non-sport) or sport-
(β = 0.24, p < .001), as well as physical (β = 0.23, p < .001) and mental specific stressors and outcomes (see Table 4). Therefore, trait stress
(β = 0.25, p < .001) health complaints, above and beyond covariates, appraisals did not mediate the relation between stressor count and the
but not well-being (β = − 0.08, p = .118) or subjective sports perfor sport performers’ mental and physical health, well-being, or sports
mance (β = − 0.04, p = .468). In contrast, total severity of chronic dif performance. In contrast, mediation analyses revealed significant indi
ficulties was significantly associated with symptoms of depression (β = rect effects between total severity of lifetime (non-sport) stressors and
0.42, p < .001) and anxiety (β = 0.38, p < .001), as well as well-being (β symptoms of depression (95% CI = 0.005 to 0.037) and anxiety (95% CI
= − 0.23, p < .001), physical (β = 0.33, p < .001) and mental (β = 0.39, = 0.007 to 0.052), well-being (95% CI = − 0.038 to − 0.005), and
10E. McLoughlin et al. Psychology of Sport & Exercise 58 (2022) 102078
physical (95% CI = 0.006 to 0.045) and mental (95% CI = 0.006 to sports participation, such as having a sense of belonging with team
0.039) health complaints, but not subjective sports performance (95% mates, coaches, or competitors (Beauchamp & Eys, 2014). Additionally,
CI = − 0.003 to 0.003). Similarly, there were significant indirect effects when directly comparing the Sport SAM and Adult STRAIN, the Sport
between total severity of sport-specific stressors and symptoms of SAM explained substantial variance in physical and mental health over
depression (95% CI = 0.003 to 0.055) and anxiety (95% CI = 0.003 to and above the Adult STRAIN and covariates assessed. This finding em
0.073), well-being (95% CI = − 0.054 to − 0.002), and physical (95% CI phasizes the importance of assessing sport-specific stressors in addition
= 0.002 to 0.061), and mental (95% CI = 0.002 to 0.052) health com to lifetime (non-sport) stressors to provide further insight into sport
plaints, but not subjective sports performance (95% CI = − 0.004 to performers’ health. Moreover, the results revealed that the perceived
0.003). Therefore, trait stress appraisals appeared to mediate the effects severity of lifetime stressors (i.e., non-sport and sport-specific) was more
of total stressor severity (both non-sport and sport-specific) on sport strongly associated with outcomes than the count of such stressors.
performers’ health and well-being. These findings reinforce the importance of assessing other dimensions
beyond count (e.g., severity; Arnold & Fletcher, 2021). An interesting
3. Discussion lack of association was observed between stressor exposure (non-sport
and sport-specific) and subjective sports performance. One potential
Prior research has documented the health-damaging consequences of explanation for this could be due to the equivocal research findings in
lifetime stressor exposure for a variety of mental and physical health the sport psychology literature which have found support for both
outcomes (e.g., Slavich & Shields, 2018). Despite this, few studies have positive and negative associations between stressor exposure and
examined the combined and cumulative effect of stressors occurring performance-related outcomes. Indeed, although some research in
across the lifespan on sport performers’ health, well-being, and perfor dicates that experiencing stressors can have a positive impact on
mance, partly due to the absence of an appropriate instrument for performance-related outcomes (e.g., McLoughlin et al., 2021; Moore
assessing these stressors. Furthermore, researchers in sport have pre et al., 2017), some studies have suggested that exposure to stressors can
dominantly assessed the frequency of a limited number of adverse life negatively impact performance (e.g., Arnold et al., 2017). In explaining
(non-sport) stressors and have overlooked other key dimensions such as these equivocal findings, scholars have suggested that future research
stressor severity (Moore et al., 2017). This is surprising given that needs to consider the role of key mediators, such as coping strategies,
stressor severity is a key dimension that contributes to the development and develop and validate more robust measures of subjective sports
of stress-related illness (Arnold & Fletcher, 2021). To address these is performance (Arnold et al., 2018).
sues, we (a) created a Sport SAM for the Adult STRAIN to provide an To address the third aim, we examined how lifetime (non-sport)
additional life course assessment of sport-related stressors; (b) examined stressors assessed using the Adult STRAIN were associated with sport
the Sport SAM’s usability, acceptability, validity, and test-retest reli performers’ health, well-being, and performance. The results revealed
ability; (c) assessed how the different types of lifetime (non-sport) that the total count and severity of chronic difficulties were more
stressor exposure assessed by the Adult STRAIN were associated with strongly associated with the outcomes assessed than the total lifetime
study outcomes; and (d) investigated the extent to which the association count and severity of acute life events. These findings are consistent with
between lifetime stressor exposure (non-sport and sport-specific) and extant theory and literature indicating that chronic stressors play a key
outcomes are mediated by trait stress appraisals. role in shaping negative health outcomes (e.g., Epel et al., 2018; Slavich
The Sport SAM that we created and validated to accompany the et al., 2019). Furthermore, the results revealed that stressors occurring
Adult STRAIN assesses eight sport-specific stressors that have frequently in adulthood were more strongly associated with outcomes than early
been reported by sport performers and are consistently associated with life stressors. These findings are congruent with prior research showing
poor health—namely, overtraining; excessive external pressure to that exposure to greater and more severe recent lifetime stressors is
perform; underperformance; non-selection; training while injured; more predictive of ill-health (e.g., Lam et al., 2019; McLoughlin et al.,
injury; coach-athlete relationship difficulties; and bullying (Rice et al., 2021). Finally, the stressor indices that were consistently and signifi
2016). The development of the Sport SAM advances extant literature by cantly associated with the outcomes assessed were other relationships
providing the first multidimensional instrument that can assess both the (e.g., parental or non-intimate relationship problems) and role
frequency and severity of sport-specific stressors over the entire lifespan. change/disruption (e.g., starting a new job). These results are contrary
The results revealed that participants completed the Adult STRAIN and to classic stress theories (e.g., Selye, 1976) and support the idea that
Sport SAM together in approximately 19 minutes, with minimal missing different types of stressors (e.g., acute vs. chronic) might have varying
data and no reported complaints; therefore, it is deemed a useable and effects on health (Epel et al., 2018).
acceptable measure. Moreover, this usability and acceptability data was To address the fourth aim, we examined whether trait stress ap
collected from a diverse sample of performers from a variety of sports praisals mediated the effects of lifetime stressor exposure (non-sport and
and competitive levels. Further, the Sport SAM demonstrated very good sport-specific) on sport performers’ health, well-being, and perfor
concurrent validity and test-retest reliability. Finally, in terms of pre mance. The results provided some support for the predictions of the
dictive validity, the Sport SAM was associated with four out of the six integrative model of lifespan stress and health (Epel et al., 2018),
outcomes assessed, including symptoms of depression and anxiety, and demonstrating that sport performers who had experienced greater life
physical and mental health complaints, but not well-being or subjective time stressor severity (non-sport and sport-specific) were more likely to
sports performance. Therefore, sport performers who were exposed to appraise stressors as threatening (i.e., situational demands exceed per
greater and more severe sport-specific stressors over the lifespan were sonal coping resources), leading to poorer health-related outcomes such
more likely to exhibit poorer health outcomes. as greater symptoms of depression. Although these results were signif
Turning to the comparative predictive validity data, the results icant, it is important to note that the mediation effects were
observed for the Sport SAM were almost identical to those obtained for cross-sectional and relatively small in size. Despite this, however, the
the Adult STRAIN, with the exception that the Adult STRAIN (i.e., non- data suggest that a severe history of lifetime stressor exposure increases
sport stressor count and severity) was also significantly associated with the likelihood of developing maladaptive stress responses that are pre
lower levels of well-being. One potential explanation for these con dictive of ill-health (Epel et al., 2018). An interesting lack of association
trasting findings could be the antithetical nature of sporting participa was observed between trait stress appraisals and subjective sports per
tion, whereby sport can contribute to, or detract from, sport performers’ formance. This is surprising given that research has revealed a relation
well-being (Giles et al., 2020). Therefore, although experiencing between cognitive appraisals and performance, with challenge ap
sport-specific stressors might have a detrimental impact on a sport praisals predicting superior performance (e.g., Hase et al., 2019). One
performers’ well-being, this effect could be attenuated by the benefits of potential explanation for this finding could be due to the challenges
11You can also read


