Public Funding Observatory - Report 2018 - EMBARGOED VERSION 11 Dec. 2017 - European ...
←
→
Page content transcription
If your browser does not render page correctly, please read the page content below
Public Funding Observatory
Report 2018

Enora Bennetot Pruvot, Thomas Estermann, Valentina Lisi

                     EMBARGOED VERSION 11 Dec. 2017
Table of contents
Introduction                                                                4
Structure of the report                                                     5
Part 1: Evolution of public funding to universities (2008-2017)             6
1.1 Evolution of public funding to universities                             7
1.2 Long-term funding trends                                                8
1.2.1 Sustained growing patterns                                            9
1.2.2 Sustained declining patterns                                          10
1.2.3 Improving patterns                                                    11
1.3 Evolution of public funding to universities against student enrolment   12
1.3.1 Systems with increasing funding                                       13
1.3.2 Systems with declining funding                                        14
1.3.3 Long-term financial and demographic pressures                         15
1.4 Public funding to universities and GDP growth                           16
1.4.1 Systems investing in universities                                     17
1.4.2 Systems disinvesting in universities                                  18
1.5 A sustained divide in Europe                                            19
1.6 Long-term developments in university staff                              20
1.7 Staff numbers against public funding                                    21
1.8 Focus on the United Kingdom                                             22

                                                EMBARGOED VERSION 11 Dec. 2017   2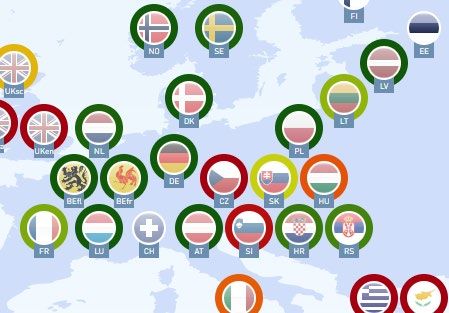
Table of contents
Part 2: Short-term trends in funding to universities                        24
2.1 Public investment in universities in 2018 (in nominal terms)             25
2.2 Evolution of public funding to universities in 2015-2017 (in real terms) 26
2.3 Short-term funding trends                                                27
2.3.1 Continued commitment to investment                                     28
2.3.2 Recovery under consolidation                                           30
2.3.3 Stagnating public funding                                              31
2.3.4 Standing still... Losing ground?                                       33
2.3.5 Signs of recovery in Central Europe                                    34
2.3.6 Changing course?                                                       36
2.3.7 Falling behind                                                         38
2.3.8 Short-term analysis for the UK systems: England                        40
2.3.9 Short-term analysis for the UK systems: Wales                          41
2.3.10 Short-term analysis for the UK systems: Northern Ireland and Scotland      42
2.4 Impacted areas                                                           43
2.5 Fostering funders’ alignment to enhance efficiency                       44
Key messages                                                                45
Higher education systems – codes                                            47
Resources                                                                   48

                                           EMBARGOED VERSION 11 Dec. 2017              3
Introduction
The EUA Public Funding Observatory was launched in
2008 with the aim to monitor the impact of the financial
crisis on higher education in different countries across
Europe. Since then, EUA has been collecting quantitative
and qualitative data on public funding received by
European higher education institutions, and analysing
both long-term trends and recent changes.
The funding data and other relevant figures are made
available to EUA by its collective members, the national
rectors’ conferences, whose support has been invaluable.
Processed and analysed in view of evolving student
numbers, as well as the overall economic context adjusted
to inflation and GDP growth, this data provides some
empirical evidence on public funding trajectories in the
field of higher education in Europe.

                                  EMBARGOED VERSION 11 Dec. 2017   4
Structure of the report
The EUA Public Funding Observatory (PFO) consists of the present
report and an online tool, providing access to the full dataset on public
funding to universities in Europe. The data can be consulted by country
and by year of funding. The period of study spans from 2008 to 2017.
The PFO also includes analysis of latest developments in 2018.

Country data sheets accompany this report to provide key figures for
each higher education system covered. The country data sheets can be
consulted individually or as part of the 2018 compendium.

The PFO report consists of two parts. The first chapter offers analysis
of the long-term trends captured over the period between 2008 and
2017. The second chapter presents the overview of the latest public
funding developments in 2017 and 2018.

A separate note describes the methodological approach and offers
further data and clarifications.

The 2018 PFO report features 33 higher education systems. Data from
various higher education systems within the UK (England, Northern
Ireland, Scotland and Wales) are reported separately.

                                               EMBARGOED VERSION 11 Dec. 2017   5
Part 1 Evolution of public funding to universities (2008-2017)

This chapter outlines the long-term
developments in public funding to universities
across Europe. EUA’s monitoring tracks the
evolution of funding allocated by public
authorities to universities since 2008.
Long-term      developments     are    best
contextualized against a set of key factors,
such as student enrolment, inflation and
economic growth.

                                 EMBARGOED VERSION 11 Dec. 2017   6
1.1 Evolution of public funding to universities
The map shows the level of public funding to universities in 2017
compared to 2008.

Different colour codes indicate whether the country invested or cut
funding to universities in the period analysed. Top investors appear in
dark green. Countries represented in red and orange registered lower
funding levels in 2017 compared to the pre-crisis years.

Compared to last year’s long-term trend, the overall situation has only
slightly improved in Europe. Flanders, Poland, Iceland, Slovakia and
Hungary moved upwards due to their recent investment efforts. In the
UK, Northern Ireland moved downwards.

Croatia and Iceland now caught up with their 2008 funding levels.

The map is based on data adjusted for inflation. This allows to better
assess the performance of countries across the years, especially for
those with high or volatile inflation rates over the period (e.g. Iceland).

      +20% and above                  from -20% to -5%

      from +5% to +20%                -20% and below

      from -5% to +5%

                                                    EMBARGOED VERSION 11 Dec. 2017   7
1.2 Long-term funding trends
                                                                                             The higher education systems under review follow various long-term
                                                                                             funding trajectories over the period 2008-2017. However, several
                                                                                             groups of systems that follow similar patterns can be identified:
                                                                                             “sustained growth”, “sustained decline”, and “improving patterns”.
                          DE                                                                 This categorisation is relative since the scale of variation may differ
40%
                                                                                             significantly across various countries and throughout the period.
30%
                                                                                             Three graphs below describe the evolution in three cases (Germany,
                                                                                      IS     Iceland and Lithuania) and illustrate the identified trends.
20%                                                       20%

10%                                                       10%
                                                                                                                                                         LT
0%                                                         0%                                                         0%
      2008 2009 2010 2011 2012 2013 2014 2015 2016 2017          2008 2009 2010 2011 2012 2013 2014 2015 2016 2017          2008   2009   2010   2011   2012   2013   2014   2015   2016   2017
                                                                                                                      -5%
                                                          -10%
                                                                                                                     -10%
                                                          -20%
                                                                                                                     -15%

                                                          -30%                                                       -20%

                                                                                                                     -25%

                                                                                                                     -30%

                                                                                                                     -35%

                                                                                                                     -40%

                                                                 EMBARGOED VERSION 11 Dec. 2017                                                                                              8
1.2.1 Long-term funding trends: Sustained growing patterns
Systems such as Austria, Germany or Sweden are subject to sustainable investment patterns, characterised by both
significant and comparatively sustained funding growth. France and the Netherlands feature more limited investment,
although on a relatively stable trajectory. Luxembourg and Turkey are outliers and show overall increases of about 95%
(LU, 2009-2017) and 73% (TR, 2008-2017)
                                                    “Sustained growth”
     35%

     30%

     25%

     20%

     15%

     10%

      5%

      0%
            2008       2009      2010        2011        2012         2013          2014           2015   2016   2017

     -5%

                                 AT     DE    NO    SE      DK   CH          FR   BE-fr    BE-fl     NL

                                        EMBARGOED VERSION 11 Dec. 2017                                                   9
1.2.2 Long-term funding trends: Sustained decline
Other systems continue to apply regular cuts to their higher education budgets. The Czech Republic and Spain
nevertheless recorded slightly positive trends in 2017 (respectively +3.65% and +2.11%), while Italy has been
stabilising at low funding levels in the last four years. The situation of the UK nations is explained in detail in
section 1.8 (direct public funding trends are not representative of the funding model).

                                                        “Sustained decline”
     10%

      0%
            2008       2009      2010       2011      2012        2013        2014    2015      2016       2017
                                                                                                                      CZ
     -10%
                                                                                                                      EE

    -20%                                                                                                              ES
                                                                                                                      GR
    -30%                                                                                                              IT
                                                                                                                      LT
    -40%                                                                                                              RS
                                                                                                                      UK-EN
    -50%                                                                                                              UK-SC
                                                                                                                      UK-WA
    -60%
                                                                                                                      UK-NI

     -70%

    -80%

                                         EMBARGOED VERSION 11 Dec. 2017                                                       10
1.2.3 Long-term funding trends: Improving patterns
“Improving patterns”
Several systems embarked on a recovery 30%
pattern, whereby signs of improvement
can be detected after a period of either 20%
cuts or limited investment. In most cases,
the improvements took place after 2013. 10%
Croatia, Portugal and Iceland offset earlier
cuts. Poland experienced three 0%
2008 2009 2010 2011 2012 2013 2014 2015 2016 2017
consecutive years of cuts before
significant renewed investment. -10%
Ireland is included in the “improving -20%
patterns” category due to the 2017 re-
investment by nearly 5% compared to -30%
2016. Yet this trend remains fragile and
insufficient to redress the sector’s -40%
financial situation in view of the large-
scale cuts implemented since 2008. -50%
PT IS PL HR LV HU SK IE
EMBARGOED VERSION 11 Dec. 2017 111.3 Evolution of public funding to universities
against student enrolment
Considering funding trends in isolation only shows part of the
picture for the countries analysed. Trends in student
enrolment are crucial to better apprehend the developments
in various systems.
While the scope of the data collected for the period 2008-2017
does not allow for the establishment of a direct relation
between public funding and student numbers at the system
level, it helps to understand the pressure universities face in a
given system.
EUA performed the analysis for 33 systems, for which it
obtained complete funding and student number datasets.
The sample is divided into two groups, capturing positive and
negative trends in all systems.
EMBARGOED VERSION 11 Dec. 2017 121.3.1 Systems with increasing funding
Changes in public funding to universities and student numbers
between 2008 and 2017
206.99%
The graph shows changes in both funding and
student numbers for 16 systems where public
100% funding in 2017 was higher than in 2008*.
When compared to student population trends,
contrasted situations emerge across Europe. A
80%
major distinction can be made between:
• 6 systems where funding growth can be
qualified as “sustainable”, i.e. superior to
student enrolment growth;
60%
• 10 systems where the demographic
pressure is not met by sufficient
investment.
40% Pressures nevertheless vary significantly, with
two extreme cases being Turkey (highest
demographic pressure) and Poland (declining
student body).
20% *Shorter timeframes are used for the following
systems:
LU (2009-2017)
CH (2008-2015)
0% BE-fr (2008-2016)
Student numbers for TR were capped at 100% to
enhance the readability of the graph. The actual
figure is +206.99%.
-20%
LU* TR DE CH* NO AT DK SE BE-fl PL BE-fr* PT NL IS FR HR
Funding 2008-17 Student numbers 2008-09 to 2016-17
EMBARGOED VERSION 11 Dec. 2017 131.3.2 Systems with declining funding The gravity of cuts in 17 systems varies
upon student enrolment numbers:
Changes in public funding to universities and student numbers
• 5 systems, where funding to
between 2008 and 2017 universities decreased in 2017
40%
compared to 2008, whilst student
20%
numbers increased, are considered to
0.56%
0.56% be “in danger”.
0%
• 12 systems, where both funding to
-20%
universities and student numbers
-40% decreased in 2017 compared to 2008,
-60%
are considered to be “shrinking” or
“declining systems under pressure”,
-80%
SK FI* SI* HU IT CZ UK-SC* ES RS EE* UK-NI LV* LT IE GR* UK-EN UK-WA*
depending on the relative pace of
Funding 2008-17 Student numbers 2008-09 to 2016-17 funding cuts and demographic
Shorter timeframes are used for the following systems:
decline.
EE (2008-2016), FI (2010-2016), GR (2008-2015), LV (2008-2016),
SI (2008-2016), UK-sc (2010-2017), UK-wa (2010-2017)
UK data: see description of the UK situation in section 1.8. Calculations do not include publicly subsidised student loans.
Finland: the change in student numbers over 2010/2016 is -0.28%.
EMBARGOED VERSION 11 Dec. 2017 141.3.3 Long-term financial and demographic pressures
This matrix captures different trends in public funding and student enrolment
for the systems with data in place for the period 2008-2017.
“Frontrunners” and “growing systems under pressure” are placed on the
FUNDING
positive ends of the axes. Norway and Sweden follow sustainable funding FRONTRUNNERS
trajectories, allowing them to preserve student/staff ratios. Portugal is NO, PT, SE
showcased among the frontrunners because of the country’s investment
IN TRANSITION
efforts since 2013. Nonetheless, the divide has grown between the countries PL
that sustained investment over the period.
GROWING SYSTEMS
Austria is temporarily included in the category “growing systems under UNDER PRESSURE
pressure” despite the marked increases registered in the years under review. AT, BE-fl, DE, DK, FR, HR,
IS, NL, TR
Funding levels are fixed for three years, which means in 2017 (second year of the
cycle), funding growth was flat, while student numbers registered a minor STUDENTS
increase, leading to an overall funding increase inferior to student growth. Other SHRINKING SYSTEMS
countries in Northwestern Europe (e.g. Germany and Denmark) tend to be under HU, LT, SK
higher pressure due to rising student enrolment. Turkey is a special case subject
to massification of higher education, which is difficult to match in terms of SYSTEMS IN DANGER
funding. IE, RS
Central and Eastern European countries, placed in the left-hand bottom corner
of the matrix, experience negative patterns both in terms of student enrolment DECLINING SYSTEMS
and public funding. Poland is one exception to this trend, as the country UNDER PRESSURE
continues to invest in public universities to respond to continuing brain drain CZ, ES, IT
and reducing student cohorts.
Finally, “systems in danger” include those systems that have cut funds over the The situation in the UK is detailed in section 1.8. Other systems were not featured
monitored period, while facing growing student populations – namely, Ireland on the graph because of incomplete datasets: BE-fr, CH, EE, FI, GR, LU, LV, SI.
and Serbia.
EMBARGOED VERSION 11 Dec. 2017 151.4 Public funding to universities and GDP growth
In addition to evolving student numbers, it is also important to take account
Category Description Systems of the country’s investment capacity while assessing the progression of
public funding to universities over time. Comparing the average real GDP
Investment above AT, DE, DK, LU*, NL, growth rate and the average real funding growth rate over the period 2008-
Funding ↑ > GDP ↑
economic growth NO, SE, TR, CH* 2017 makes it possible to identify some general patterns.
The first group in the table refers to the most ‘committed’ systems, which
Investment below
Funding ↑ < GDP ↑ FR, HU, IS, PL increased their investment in public universities at a larger scale than their
economic growth
current economic growth.
Investment despite In the second group, there seems to be some unused margin for maneuver,
Funding ↑ - GDP ↓ HR, PT
economic decline as the investment level remains lower than GDP growth over the period.
Systems in the third group proved their commitment to investing in higher
Disinvestment despite CZ, EE*, ES, FI*, IE, LT,
Funding ↓ - GDP ↑ education despite the overall economic decline during the period.
economic growth LV*, RS, SK
Crucially, the fourth group of countries reduced funding for universities
Disinvestment greater despite the overall positive GDP growth. Although the picture is highly
Funding ↓ > GDP ↓ GR*, IT, SI*
than economic decline complex at the national level, this is a warning signal for the countries that
may miss an opportunity to strengthen their knowledge economy.
The fifth group is characterised by funding cuts against the economic
Systems not included: BE-fr, BE-fl, UK (all 4 systems).
decline.
*Shorter timeframes: CH (2008-09/2014-15); EE, GR, LV, SI (2008-09/2015-16); FI
(2010-11/2015-16); LU (2009-10/2016-17).
EMBARGOED VERSION 11 Dec. 2017 161.4.1 Public funding to universities and GDP growth:
systems investing in universities
10%
The systems where funding increased on
average over the period 2008-2017 include
8%
Luxembourg, Switzerland, Germany, Norway,
Austria and Denmark. These top investors
supported their universites at a considerably
6%
faster pace than their GDP levels.
Among the countries with GDP growth rates
4%
higher than funding increases, both Poland
and Hungary have a large margin for
2%
manoeuver to increase the sector’s funding.
Portugal proves its commitment to invest in
higher education despite a GDP growth level
close to zero.
0%
LU* TR CH* DE NO AT DK SE PL PT IS NL FR HR HU
*Systems not included: BE-fr, BE-fl, UK (4 systems).
-2% Shorter timeframes:
Average funding growth Average GDP growth CH (2008-09/2014-15), LU (2009-10/2016-17).
EMBARGOED VERSION 11 Dec. 2017 17 171.4.2 Public funding to universities and GDP growth:
systems disinvesting in universities
6% The Irish case stands out among the
countries disinvesting in higher
4%
education despite economic growth since
2% Ireland has one of the highest average
GDP growth rates in Europe.
0%
SK FI* SI* IT CZ ES RS LV* EE* LT IE GR*
Aside from Slovenia, Italy and Greece,
-2%
other systems record negative trends in
-4% university funding in a context of positive
average GDP growth, suggesting
-6%
possibilities for corrective measures in
-8% the coming years.
-10%
-12% *Systems not included: BE-fr, BE-fl, UK (4 systems).
Shorter timeframes:
Average funding growth Average GDP growth
EE, GR, LV, SI (2009-08/2016-15);
FI (2011-10/2016-15).
EMBARGOED VERSION 11 Dec. 2017 18 181.5 A sustained divide in Europe
Number of systems investing
This graph shows the yearly changes in the number of systems cutting or Number of systems cutting funding
increasing funding for universities in the period from 2008 to 2017
(reference year: 2008).
2012 appears to be the most difficult year for universities in Europe. 2008-2017 -11 14
After that year, some recovery can be detected, as more countries started
to re-invest in the HE sector. The effects of some countries’ renewed 2008-2016 -13 12
investment in the sector are visible in 2017 (with Croatia and Iceland
overcoming the funding gap that emerged in the previous years). 2008-2015 -13 12
Recovery nevertheless remains slow, and many university systems
throughout Europe still operate with lower funding volumes than in 2008-2014 -14 11
2008.
2008-2013 -14 11
Trends remain in line with the previous edition of this Observatory
pointing to the negative impact of austerity measures and budget cuts 2008-2012 -15 10
over the long run. Despite positive economic growth forecasts, and
therefore in theory capacity for public authorities to re-invest in 2008-2011 -13 12
universities, restoring funding levels proves difficult. This investment
divide undermines the sector’s attempts for greater collaboration at 2008-2010 -11 14
European level.
The graph above includes the 25 systems for which the
funding dataset is complete between 2008 and 2017. 2008-2009 -9 16
Excluded: CH, EE, FI, GR, LU, LV, SI, UK-sc, UK-wa.
EMBARGOED VERSION 11 Dec. 2017 191.6 Long-term developments in university staff
This figure presents different groups of systems according to the
changes in the number of students and staff (academic and non-
Growing
students and academic) over the period 2008-2017.
Diminishing staff:
students and The financial and demographic pressures are reflected in the
growing/stable BE-fl*, DE*, DK*,
FR*, HR, IS, NL*, student/staff ratio. Given the varying scope of the data collected,
staff: HU, PL
NO*, SE, UK-en, no direct estimates of student/staff ratios can be made.
UK-wa, CH* Nevertheless, comparing the dynamics for student numbers and
staff can help detect certain trends across Europe.
Diminishing Growing The situation is particularly challenging for Irish and Northern-Irish
students and students and universities that experienced growing student numbers, but had to
staff: CZ, ES, IT, diminishing reduce staff.
LT, LV, SK staff: IE, UK-ni
Conversely, Hungarian universities register an increase in the
number of employees despite the diminishing student population,
while Poland maintains a stable university workforce in a similarly
negative demographic context.
The figure above includes the 22 systems for which the total staff
and student number datasets are complete for the period 2008- *Systems where the growth in staff numbers is slower than that of students.
09 to 2016-17.
EMBARGOED VERSION 11 Dec. 2017 201.7 Staff numbers against public funding
For those systems where complete datasets are available for the period 2008-2017, some indications are provided for academic and administrative
staff numbers against the backdrop of public funding.
While France, Italy and Sweden show trends in staff that are more in line with the related trends in public funding, the situation appears to be more
complex for other countries.
Among those systems that invest in staff at a higher rate than public funding growth are Flanders, Germany (for academic staff), Croatia, Denmark
and the Netherlands (academic staff). Hungary (non-academic staff) and England register increased staff numbers in a context of lower funding.
In some cases, the effort is entirely focused on (or significantly higher for) academic staff (Belgium, Germany, Denmark, Netherlands, Sweden and
England). Hungary is an exception with an investment focusing on administrative staff. Croatia and Norway display more coherent growth of both
staff categories.
An outlier, Poland, shows stability in staff numbers while public funding has been increasing, although in a context of dwindling student numbers. By
contrast, in England staff numbers increased despite the overall decline of public funding (the case of the UK nations is detailed in section 1.8).
40%
20%
0%
-20%
-40%
-60%
BE-fr BE-fl CZ DE DK ES FR HR HU IE IT LT NL NO PL SE SK UK-EN UK-NI
Funding Academic staff Non-academic staff
EMBARGOED VERSION 11 Dec. 2017 211.8 Focus on the United Kingdom
This edition of the Public Funding Observatory, as for the previous year, collected data for the four higher education systems of the United Kingdom, allowing to distinguish
between different patterns over the period 2008-2017. Following reforms to student funding, a large and increasing proportion of public funding for teaching at HEIs in England,
Wales and Northern Ireland has been replaced by financial support for students in the form of loans for tuition and living costs. Loans are subsidised by government. Recent
estimates of the long term cost to government of these subsidies for full-time undergraduates is around 45% of loan outlay each year. When considering the publicly subsidised
fee loans together with direct public funding, the analysis reveals a slightly positive situation for English universities, but inferior to the pace of growth of the student population.
In Northern Ireland, the 5 HEIs are left in a difficult financial situation, while being placed under similar demographic pressure (+7% over 2008/09-2016/17).
England, % change, 2008 basis (in real terms) Northern Ireland, % change, 2008 basis (in real terms)
2008 2009 2010 2011 2012 2013 2014 2015 2016 2017
2008 2009 2010 2011 2012 2013 2014 2015 2016 2017
10%
10%
0%
0%
-10%
-10%
Direct public funding
-20%
-20%
-30% Total funding (direct public
funding + publicly subsidised fee -30%
-40% loans)
-40%
-50%
-50%
-60%
-60%
-70%
-70%
EMBARGOED VERSION 11 Dec. 2017 221.8 Focus on the United Kingdom
Data for Wales covers the 9 Welsh HEIs since 2010. Wales implemented a reform of the university funding model in line with the reforms in England and Northern Ireland. The
Welsh sector is transitioning to a new student funding model (mix of grants and loans). Corrective funding increases are expected to redress previous cuts, notably to capital and
infrastructure. While the reference year is different than for England and Northern Ireland (2008), the donward trend for Welsh universities is even steeper than in the other parts
of the UK.
The funding model in Scotland does not feature a heavy loan component. Figures represent all funding from the Scottish Funding Council and the Student Awards Agency (SAAS)
for the Fee element of funding. Scottish universities have increased levels of borrowing significantly as they look to pursue their strategies. At least half of the institutions in the
sector have recorded a budget deficit over recent years. The system is facing significant challenges to its sustainability and competitiveness.
Wales, % change, 2010 basis (in real terms) Scotland, % change, 2010 basis (in real terms)
0% 0%
2010 2011 2012 2013 2014 2015 2016 2017 2010 2011 2012 2013 2014 2015 2016 2017
-10% -10%
-20% -20%
-30% -30%
Direct public funding
-40% -40%
Total funding (direct public
funding + publicly subsidised fee
-50% loans) -50%
-60% -60%
-70% -70%
-80% -80%
EMBARGOED VERSION 11 Dec. 2017 23Part 2 Short-term trends in funding to universities
This chapter provides the overview of the most
recent university funding trends in Europe. It
explores the short-term trajectories of total
direct public funding to universities, allocated
over the last two years, and investigates their
impact on various university activity areas.
Funding and inflation data for 2018 is not yet
available for all 33 systems covered in the PFO.
Therefore, the analysis centers on the changes
in nominal public funding for 2018 and in real
public funding adjusted to inflation for 2017.
EMBARGOED VERSION 11 Dec. 2017 242.1 Public investment in universities in 2018 (in nominal terms)
Funding figures for 2018 are only available for 17 of 33 higher
education systems in the sample.
Iceland remains in the top investors for the second year, while
England* continues to feature among the systems with most
significant cuts. Wales* stands out: from a large cut, in real
terms, in 2017, to the largest announced increase in 2018.
> 10% increase CZ, IS, UK-wa*
5% – 10% increase HR, HU, NL, TR
1 – 5% increase BE-fr, ES, IE, NO, PL, SE,
SK
-1% – +1% change AT, UK-sc*
1 – 5% decrease
5% – 10% decrease UK-en*
* UK data: see description of the UK situation in section 1.8
>10% decrease
No data BE-nl, DE, DK, EE, FI, FR,
GR, IT, LT, LU, LV, PT, RS, SI,
UK-ni*, CH
EMBARGOED VERSION 11 Dec. 2017 252.2 Evolution of public funding to universities
in 2016-2017 (in real terms)
The adjustment of 2017 public funding data to the inflation rate for
that year complements the analysis of the short-term funding trends.
11 systems still showed negative short-term funding trends in 2016-
2017. UK systems featured cuts exceeding 5% (England, Wales,
Northern Ireland – see section 1.8), while the rest remained for the
most part below -1%.
The largest investments in real terms took place in Hungary (26.5%),
followed by Iceland (13%). Ireland registers the third-biggest increase
for the first time since the beginning of the monitoring period.
More than 5% increase Between 1 and 5% decrease
Between 1 and 5% increase More than 5% decrease
Between 1% increase and
1% decrease
EMBARGOED VERSION 11 Dec. 2017 262.3 Short-term funding trends
Considering the long-term trajectory of the individual systems together with the latest developments witnessed over
2017 and economic growth forecasts*, several patterns emerge:
Continuing commitment to investment can be observed in Luxembourg, Norway and Switzerland. In these systems,
the latest funding increases either match or surpass the average annual growth of public funding for universities.
Austria will renew with this positive trajectory in 2018.
Recovery under consolidation may described the trend in Iceland and Portugal, which have both reached their pre-2008
funding levels, and where proper consolidation will depend on the political commitment to higher education.
Relative stagnation characterises the situation in Belgium, Denmark, Germany, Poland and Sweden, countries where
comparatively large increases in investment since 2008 are no longer sustained. In the Netherlands and France, recent
stagnation is combined with more modest long-term trends and stronger financial pressure on universities.
Signs of recovery of public investment in universities can be detected in Central Europe – as last year, Croatia, Hungary
and Slovakia show some positive developments, and are joined this year by Slovenia. However, aside from Croatia, none
of the countries in this group are reaching their pre-crisis funding levels.
Other countries seem to be changing course – renewing with investment, as in the Czech Republic, Ireland or Spain,
while Turkey shows signs of shifting towards a negative trend, in a particular context of high inflation and continued
expansion of the student body.
Finally, failure to re-invest in higher education is leading some countries to fall behind, although to different extents.
Finland and Italy seem unable to renew with a positive pattern and Latvia does not mobilise enough resources to close
the funding gap; elsewhere in the Baltics, Greece and Serbia, most indicators are still in the red.
More detailed analysis of these patterns is presented below.
* Source: European Commission’s Autumn 2018 Economic Forecast.
EMBARGOED VERSION 11 Dec. 2017 272.3.1 Continued commitment to investment
Luxembourg almost doubled public funding for its university in eight years. The pace of investment
has been slowing down in the last few years, with nevertheless still a +4.32% increase in real terms in
2017. The current performance contract between the Ministry and the University (2018-2021) includes
for the first time a competitive "bonus" element rewarding success in EU research funding
programmes. After two years of slightly negative growth in student numbers, Luxembourg registered
a sizeable increase of +3.5% in 2017/18. In the same academic year staff grew by nearly 10%.
Data for Switzerland is available until 2015. Although the previous year had seen a sizeable increase
in funding (+7.5%), in 2015 investment levels were basically stable (+0.5%). A “staircase” pattern of
investment alternating with flat growth seems to be emerging. Since 2015, the student population
continues to expand at an average annual rate of 2%, revealing continued pressure on universities
and requiring further investment.
Public funding for universities in Norway grows in line with student numbers, allowing universities to
continue recruiting staff. The return to moderately growing GDP levels in 2017 should further support
this positive trajectory. Public funding to universities grew by 3.5% in 2017 compared to the 2016
increase of 1.6%.
The increase on 2018 should be somewhat lower (+3.9% in nominal terms). Student numbers grew by
1.9% in 2017/18 compared to the previous academic year, accompanied by a comparable increase in
staff (+2.5%).
EMBARGOED VERSION 11 Dec. 2017 282.3.1 Continued commitment to investment
The ‘staircase’ progression in funding in Austria reflects the three-year contractual framework
between the state and universities, eroded by inflation in the second and third year of each cycle. In
2016/17, the combination of inflation and a minor increase in student numbers temporarily put the
system among those under pressure despite a public investment effort in line with GDP growth.
Indeed, data adjusted for inflation shows a decrease of -2.15% in 2017 compared to 2016, and the
funding level in 2018 is identical in nominal terms to that of 2017.
Nevertheless, the latest data available show student numbers going down (-1%), while the 2019-
2021 budget negotiations concluded positively for Austrian universities with higher investment
secured for the next period. Austria therefore is set to return to its position of "frontrunner“ and is
included in the category of “continued commitment to investment”. The increased budget is set to
support objectives related to the number of active students.
EMBARGOED VERSION 11 Dec. 2017 292.3.2 Recovery under consolidation
Iceland is on a positive track since 2013, with an average annual increase over 7%
since that year (exceeding the average GDP growth in that period) in a context of
stabilising student numbers. The large real-terms increase of 13% in 2017 (compared
to 2016) and the projected increase of 11.6% in 2018 (compared to 2017), in a context
of low or even negative inflation, confirm that the system is recovering from the
austerity of the first part of the period (2009-2012). Iceland has now reached its pre-
2008 level of funding. The current government has made it an objective to “attain
the OECD average as regards funding of university education in 2020 and the Nordic
average by 2025”. Additional funding has been earmarked for the sector in the
budget plan for 2019-2023. The increased funding is particularly concerning
teaching, and to a more moderate extent research and infrastructure.
Portugal confirms recovery observations made last year, with a real-term increase slightly over 3%
for 2016-2017 in a context of slowly growing student numbers. Projections for 2018 suggest a 3%
increase in nominal terms. Funding levels therefore seem to stabilise towards moderate increases.
The significant increase reported in 2014, which followed the lowest point of the funding curve,
served to (partially) compensate for salary corrections decided by the government. Universities
continue to face a difficult situation, as the increases fail to cover higher staff expenditure.
Portugal is nevertheless re-investing at a faster pace than its real GDP growth would suggest. In the
context of a slower economic growth forecast for 2019-2020, investment in higher education needs
to remain a national priority.
EMBARGOED VERSION 11 Dec. 2017 302.3.3 Stagnating public funding
Sweden is in a comparatively better position than many when considering the full period. However, since
2016 universities receive slightly less funding every year in real terms (-0.48% in 2017 compared to the
previous year), a phenomenon likely to happen again in 2018 (projected nominal increase +1.9%, with an
inflation rate expected to be superior to this figure). A new funding mechanism is currently being
discussed, with a proposal expected in early 2019, and possible implementation as of 2021. University
infrastructure is considered under pressure, while teaching activities have benefited from moderate
funding increases.
Denmark shows an overall funding trajectory remarkably similar to that of Sweden. Following years of
small but sustained increases, university investment came to a halt in 2017 (-0.17%). Both research and
teaching at Danish universities have been affected by an annual 2% cut, leading to layoffs and reduced
activity levels. Latest data show continued rise in student numbers while staff is cut down.
Germany’s pace of investment appears sustainable, despite a lower funding effort in 2017 (+0.64% in real
terms). The investment level remains above GDP growth, but has to be considered in the context of a
student population that has been expanding until 2015. This results in broadly stagnating basic funding to
universities. The sustained economic growth forecast can support greater investment in the sector.
EMBARGOED VERSION 11 Dec. 2017 312.3.3 Stagnating public funding
After a few years of remarkable growth (between 5 and 9% annually), public investment to universities in
Poland slowed down since 2016 (+0.73% in 2017) and is expected to remain stable in 2018 (just under 2% in
nominal terms). Investments focus on research activities. Poland has been consistently increasing its GDP
share of public funding for universities since 2008. In view of the declining enrolment, the funding formula
was modified in 2017 to focus on student-to-staff ratio, leading some universities to put a curb on
admissions. The new Law on Higher Education and Science, which came into force in October 2018 with
gradual implementation planned until 2020, should lead to “streamlined financing principles” and enhance
the universities’ capacity for financial management.
In Flanders, Belgium, revised funding data shows relative stability after the large investment of 2014, accompanying the
incorporation by universities of academic programmes previously provided by university colleges. Funding nevertheless fell
by 2% in 2016, corrected the following year by a 2.35% increase in real terms. While student numbers are stabilising
(+0.14% in 16/17 compared to 15/16, -0.1% the following year), universities struggle to adapt to the overall growth of the
student population following the 2013 “shock” (+26% over one year).
In the French-speaking Community of Belgium 2017 investment was limited to 1.53%, lower than the two previous years
(5.70% and 4.14%). 2018 should follow this downward trend, with estimates slightly over 1% in nominal terms. Pressure is
high considering a faster-expanding student population (+4% in 2015/16 compared to 14/15) and a weaker economic growth
forecast. Investment in staff remains too low to adequately cater for the larger student cohorts.
EMBARGOED VERSION 11 Dec. 2017 322.3.4 Standing still... losing ground?
The quasi-sustained investment effort in universities in the Netherlands (excepted 2012) remains limited,
and never exceeded 2.5% annually. In 2017, investment grew by a little over 1.5%, with better projections
for 2018 (+5.5% in nominal terms). The increase is meant to compensate for a combination of inflation,
growing student numbers and previous budget cuts. However, the system is confronted with student
numbers increasing at a faster pace and still projected to grow in the coming years (+4.55% for 2017/18
compared to 2016/17). Since 2018 a redistribution of € 70 million from student support to grants for
teaching for universities is implemented. In 2023 this will increase to € 190 million to improve the quality
of education by means of performance agreements. The new government announced its intention to
strengthen the link of funding of academic research to quality and impact and to pay special attention to
technical sciences and cost intensive research.
Real investment in universities in France was close to zero in 2017, after a 1% increase the
previous year. Expectations for 2018 included marginally enhanced funding for teaching
activities. Student enrolment is slowly growing (annual increase inferior to 2%).
EMBARGOED VERSION 11 Dec. 2017 332.3.5 Signs of recovery in Central Europe
Croatia’s investment in universities moved into the green in 2016, with 7% in growth. However the real-
terms increase in 2017 fell short of 2%. This allowed Croatia's funding effort to reach for the first time the
pre-crisis level after years of expansion of the student body and a difficult economic situation. Sustained
economic growth forecast for the next year can support greater investment in the sector to adjust to the
larger student population. The outlook for 2018 is positive (+5.7% in nominal terms).
Hungary continues on the recovery path started in 2014, with large investments every second year. The
funding increase between 2016 and 2017 reached slightly over 26%, to be followed by a more moderate
increase in 2018 (nominal terms projection: 7.9%). As previously, all areas were concerned (teaching,
research, staff and infrastructure). Staff numbers have been going up over the last year (in particular non-
academic staff, the category that has most increased since 2008). The country nevertheless still fails to
reach per-crisis investment levels (currently 10% below the 2008 figures). The student population continues
to fall, although at a slower pace (-1.3% compared to 2016/17). Renewed investment in the sector comes
with increased state control on funding allocation. Similarly, negative trends can be observed since 2017 with
regard to university autonomy and academic freedom in Hungary.
EMBARGOED VERSION 11 Dec. 2017 342.3.5 Signs of recovery in Central Europe
Since 2015 Slovakia's funding trajectory is moving upwards. The increase of funding in real terms registered
in 2017 was the largest of the last years (+4%) and the forecast for 2018 is positive (4% in nominal terms).
The country is near to reaching its pre-crisis funding level, and the economic growth forecast for the next
two years is positive, with an expectation that Slovakia’s economic expansion continues to strengthen.
Investments notably target accommodation and facilities for students. The halt in the decline of student
numbers (+5.5% in 17/18 compared to 16/17) is not consolidated for 18/19 with a projected -7%.
For the first time in 2016, Slovenia registered a modest increase in university funding levels (1.95% in real
terms), after four consecutive years of cuts. The student population continues to decline (-5.2% in 2017/18
compared to 2016/17). Over the period student numbers fell faster than funding levels. A reform of the
funding model for universities passed at the end of 2016 aims at refinancing and providing stable, long-term
funding to HEIs, particularly with regard to research activities. The system is therefore in transition.
EMBARGOED VERSION 11 Dec. 2017 352.3.6 Changing course?
For the first time after almost a decade of regular cuts, recurrent funding in Ireland increased in 2017.
Universities received 4.75% more (in real terms) than in 2016. Projections for 2018 hint at a marginal increase
(+2.11% in nominal terms). The increased funding targeted teaching activities. The growth of the student
population is slowing down (+1% in 17/18 compared to 16/17) but funding per student has declined dramatically
during the period. Restrictions remain in place in respect of core staffing numbers and capital infrastructure
remains underfunded.
Along with the 2018 increase in State funding, an Employer contribution to the funding of HE was introduced
(as recommended by the Expert Group established by the Ministry for Education to examine the future funding
of Higher Education) by way of an increase in the Employer national training fund levy. The overall impact of
these measures however falls short of where the sector needs to be if the 2021 interim target funding
requirements identified by the Expert Group are to be met.
The long-term sustainability of the HE sector remains an issue, despite the fact that high GDP growth suggests
possibilities for renewed investment in universities.
Spain is showing signs that it seeks to renew with investment in higher education. After a
first and limited increase in 2015, it registered a funding increase of +2.11% in 2017 and has
announced a nominal increase of +4.52% for 2018. Revised student data shows a slow
decline in the enrolment (on average -1.75% annual decrease since 2016/17). Despite the
latest investments, Spain’s university funding is still in the red as compared to 2008. The
Spanish economy is in expansion and robust economic growth forecast can support
renewed investment efforts to close the gap.
EMBARGOED VERSION 11 Dec. 2017 362.3.6 Changing course?
In line with observations made in the previous report, the Czech Republic seems to have
renewed with investment. After three consecutive years of cuts, 2017 showed a real-term
increase of 3.65%, and prospects for 2018 were positive with an announced 13.8% increase
(nominal terms). Since the beginning of the monitoring, the country has not known an
investment period sustained over one year, and will need to upscale the effort to reach
pre-crisis levels (currently -20% compared to 2008), in the context of positive GDP growth.
The recent increases have a moderate positive impact on education and research activities
as well as staff, but the lack of investment in infrastructures remains problematic.
In Turkey, the additional financial effort in 2017 in nominal terms was annihilated by
high inflation, which turned a +8.6% increase into a -2.25% cut. A worse scenario is
expected for 2018, with an announced increase of +7.97% and projections for even higher
inflation. The previous pattern which saw high investment phases alternate with flatter
growth seems to evolve towards a negative trend. In the meantime, student numbers
continue to grow, albeit at a slower pace (+5% in 2017/18 compared to the previous
academic year). The large growth of academic staff (+86% between 2008/09 and
2016/17) may have also come to a halt (-12% in 2017/18 compared to the previous year).
EMBARGOED VERSION 11 Dec. 2017 372.3.7 Falling behind
The first increase in funding levels in Finland (2015) was not consolidated in 2016, when the country renewed
with moderate cuts (-2.07%), in line with the pre-2015 period. Cuts on core funding of universities as well as
on public research funding introduced by the government in the last years have forced institutions to reduce
expenses and cut down costs by adjusting all operations. The capacity of universities to recover from
austerity measures is hindered by the new cuts, while recent data shows that the student population is
slowly growing again. The funding model is under reform, with possible implementation as of 2021.
The Finnish Government introduced tuition fees for non-EU/EEA students, starting from August 2017. The
tuition fees concern Bachelor's or Master's degree programmes offered in English. The tuition fees have so far
had no or only little effect on total funding of universities. After the introduction of tuition fees, the number
of applicants/students from non-EU/EEA dropped down a little, but have now levelled or even exceeded the
figures before tuition fees.
Unlike other countries to the West of Europe, Italy has been confronted with a drop in student numbers during
the period (-8.8% since 2008), although there are signs that this is changing (the country even registered a
0.79% increase of the student population in 2016/17 compared to the previous academic year). In the
meantime, cuts implemented at the beginning of the period have not been compensated by renewed
investment. In spite of economic growth, funding has been stabilising in the recent years at a worrying low level
(-17% compared to 2008, and -0.41% in 2017 compared to the previous year). Staff numbers continue to fall and
went down by -2.65% in 2016/17. Discussions on the reform of public funding allocation is ongoing after its
implementation came to a halt.
EMBARGOED VERSION 11 Dec. 2017 382.3.7 Falling behind
Public funding to universities in Lithuania dropped by more than one third in 2008-
2017, whereas student numbers declined by more than 40%. In 2017, consolidated
figures still show a real cut of nearly -4% compared to the previous year. Lithuanian
universities lose over 5% of their student population every year for the last 3 years.
Data communicated by the Ministry for 2018 nevertheless shows for the first time a
sizeable increase in public funding (+12.5% in nominal terms). Combined with
significantly higher levels of EU structural funds this year (representing one-third of the
total public funding), Lithuanian universities may start addressing some of the
pressing issues in a system that continues to suffer from negative demographics and
substantial emigration.
Serbia continues to show a negative trend, for the third consecutive year, although the
decrease is more moderate (-0.43% in real terms in 2017, -2.06% in 2016), while student
numbers started to grow again (+1.16% in 2016/17 compared to the previous year, after
three years of marginal decline). Staff numbers were broadly stable.
Greece and Estonia reported data until 2016, which in both cases reveal continued negative trajectories, after temporary
stabilisation in 2015 in Estonia (+0.87% followed by -7.26% in real terms in 2016). The Estonian student population has
been declining by close to 6% on average each year, while Greece reported limited increases until 2015 (under +2%).
Latvia, which also reported date until 2016, continues to feature a sustained and modest positive trajectory, insufficient to
offset the impact of early cuts. Minor increases are projected in 2018 and 2019 due to rise of pedagogical staff salaries and
the reinforcement of a scientific funding programme. Consolidated data for 2017 nevertheless shows a significantly smaller
investment compared to the previous year (4.87% against 8.41% in 2016). Student numbers seem to have stabilised.
EMBARGOED VERSION 11 Dec. 2017 392.3.8 Short-term analysis for the UK systems: England
Latest data shows that direct public funding to English universities continues to fall; taking into account the overall value
of publicly-subsidised fee loans, the aggregated level of public funding records a small hit (-6.51% considering direct
public funding only; -0.89% including value of loans, in real terms in 2017 compared to 2016)
In May 2017, the Higher Education and Research Act 2017 was passed by Parliament, representing a significant change to
higher education legislation in England. The Act introduces several changes that are likely to impact on the trends in
funding, students and staff at higher education institutions. These changes include:
• introduction and roll-out of the Teaching Excellence Framework, which allocates ‘awards’ to institutions based on
qualitative and qualitative assessments of teaching quality
• a greater focus on encouraging the entry of new providers of higher education, including the power to award degrees on
a probationary basis, and removing some restrictions on gaining university title
• reorganisation of the architecture overseeing research funding and strategy
The government has announced that the fee cap in England will be frozen at £9,250 for 2018-19 and 2019-20. From 2016-
17 academic year, non-means tested loans of up to £10,000 are also available to English domiciled postgraduate students
taking masters courses, to contribute to tuition and living costs.
The government is currently conducting a review of post-18 education and funding in England which will conclude in early
2019.
EMBARGOED VERSION 11 Dec. 2017 402.3.9 Short-term analysis for the UK systems: Wales
Following publication of the Diamond Review of higher education funding and student finance (Welsh
Government, 2016), the Welsh government will be implementing a number significant changes to higher
education funding in Wales from 2018-19 onwards.
The current tuition fee grant for full-time undergraduate students from Wales will be replaced with an additional
subsidised student loan, up to the current maximum fee level applicable (currently £9,000 in Wales, and £9,250
in the rest of the UK for 2018/19).
UK nationals who are resident in Wales will have increased support for living costs, including a £1,000 non-
means-tested grant and an additional means tested grant. Maintenance loans will be available to cover the
remainder to provide a package of support equivalent to the Living Wage. Part-time students will receive similar
grant and loan support on a pro-rata basis. Overall, there will be enhanced student support for postgraduate full-
time and part-time students.
There will also be an increase in funding for HEIs to be phased in over a period of years from 2018/19, seeking to
redress issues caused by the reductions in public funding (announced increase for 2018 in nominal terms +14.47%
compared to 2017). The reductions up to 2018/19 mean that support is currently limited to critical areas only
including expensive subject provision, part-time provision and core research funding (in 2017, direct public funding
fell by -7.92% in real terms compared to 2016, and by -2.92% when including the value of publicly subsidised loan).
Capital and infrastructure funding to support business engagement, commercialisation and leverage of other
innovation funding sources in particular are currently not supported. The accepted Diamond recommendations
seek to redress these issues. Notably, capital funding will be available from 2018 (including £6m for 2017/18 and
£10m for 2018/19).
Transition to the new student funding system, and wider funding environment, means that the sector in Wales is
faced with considerable forecasting uncertainty. There are significant financial uncertainties related to Brexit,
including student and staff mobility, and the future of the EU replacement funding schemes, which have been a
significant source of income for HEIs in Wales.
EMBARGOED VERSION 11 Dec. 2017 412.3.10 Short-term analysis for the UK systems: Northern Ireland and Scotland
Universities in Northern Ireland continue to face significant funding challenges and an uncertain political environment. A
funding gap of between £900 and £2,500 per student (depending on the course of study) has emerged between
universities in Northern Ireland and England. Under-resourced compared with their UK competitors, universities in
Northern Ireland have had to take corrective action, primarily through reducing their undergraduate student intakes and
staff numbers, to maintain the quality of their provision.
Scotland is confronted with a real terms decrease for the third consecutive year (-2.14% in 2017 compared to 2016), while
student numbers start to grow again since 2016/17 (just under 1.50% on average annually since that year).
Universities Scotland reported an expected 1.79% cut in real terms to the total funding available to universities for the
academic year 2019/20, following announcements of the Scottish Government. Individual allocation plans drawn up by
the Scottish Funding Council show that every university faces a real terms cut and half of institutions are facing real term
cuts of 2% or more, against a background of rising pension costs for universities.
EMBARGOED VERSION 11 Dec. 2017 422.4 Impacted areas
Sixteen systems provided some assessment of the impact of funding
changes per area of activities. Compared to the previous edition of Funding Research Teaching Staff Infrastructure
this report, more countries reported increased funding and positive
impact on research and teaching activities in 2018 (8 systems
compared to 5 systems, in both categories). Investments linked to
staffing policies and management of infrastructures are more scarce.
The latter is the category that is most often left aside, with five
systems mentioning specifically that this is a negatively affected positive CZ, HU, IT, LV, CZ, FR, HU, IE, CZ, LV, UK- HU, SK
area. In a context of slow recovery, it seems that investment focuses impact PL, SI, NL, UK- SI, SE, NL, UK- sc
on core activities of universities (teaching and research), while often sc sc
failing to address underlying issues such as ageing and inadequate
facilities. no impact BE-fl, FR, SE BE-fl, IT, LV, BE-fl, FR, BE-fl, FR, IT,
PL, ES HU, LV, PL, PL, SI
Among the systems that register fuding increases/ positive impacts, ES, SE
these can be transversal and address both research and teaching, or
focus on one of the two missions (focus on teaching in France, negative DK, IE DK DK, IE, IT CZ, IE, ES, SE,
Ireland and Sweden; focus on research in Latvia and Poland).
impact UK-sc
EMBARGOED VERSION 11 Dec. 2017 432.5 Fostering funders’ alignment to enhance efficiency
The economic recovery remains slow in the higher education sector in Europe
and it cannot afford wasting limited resources.
At a stage where new EU funding programmes for higher education and
research are being negotiated, simplification bears the potential to release
funds from administrative processes into the core activities supported.
This requires achieving a coherent set of rules that is mindful of the diversity
of actions and beneficiaries accommodated in a programme, and that ensures
both high-quality processes and an effective use of resources. *EUA calculation based on European Commission’s
Horizon 2020 Monitoring flash (September 2018) data.
Accepting beneficiaries’ accounting practices under Horizon Europe – the future EU programme for research & innovation – has the
potential to not only enhance efficiency, but also reduce error rates and improve cross-reliance between national and EU audits. EUA
collected relevant good practices at national level in a compendium, where they are also compared to current Horizon
2020 rules in an exploration of new possibilities for a better alignment of rules between the EU and the national
level in Horizon Europe.
In essence, improving the alignment of funders’ practices for both accounting and auditing purposes between
the national and the EU level would be a major, further step towards achieving impactful simplification, release
resources and support the financial sustainability of universities throughout Europe.
EMBARGOED VERSION 11 Dec. 2017 443 Key messages
• Across the full period of analysis, three types of trends can be distinguished: sustained growing funding;
sustained declining patterns; and improving patterns. Nevertheless, these trends should be considered in
connection to student growth, a key element to assess the type of pressure universities are operating
under.
• Those countries that invest at a rate that allows to preserve student/staff ratios are the exception. Out of
16 systems that have higher funding in 2017 than in 2008, only 6 have a funding growth that exceeds
student enrolment growth.
• The investment effort can be also approached in connection to GDP growth. 9 countries fail to re-invest in
universities even though positive GDP growth suggests this would be possible.
• At least 8 countries started re-investing (improving patterns), but for half of them the scale of the effort
remains too limited to adequately address the cumulated funding gap over the period.
• 17 systems still had lower levels of direct public funding in 2017 than in 2008, with 5 of them experiencing
larger student cohorts.
EMBARGOED VERSION 11 Dec. 2017 45You can also read