Putin 2000 - 2014, Midterm Interim Results: Diversification, Modernization and the Role of the State in Russia's economy - A Wittgensteinian look ...
←
→
Page content transcription
If your browser does not render page correctly, please read the page content below
Putin 2000 – 2014, Midterm Interim Results:
    Diversification, Modernization and
  the Role of the State in Russia’s economy
  A Wittgensteinian look at the Russian economy
                                      by Jon Hellevig
                                      December, 2014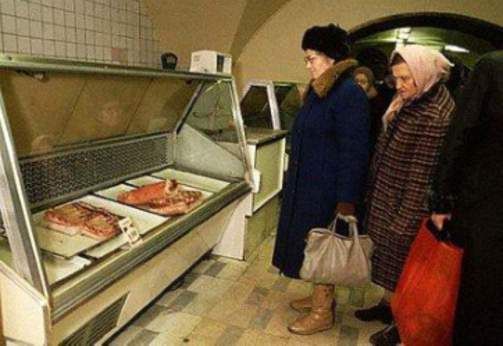
AWARA GROUP'S STUDY

Pu n 2000 – 2014, Midterm Interim Results: Diversifica on,
   Moderniza on and the Role of the State in Russia's
                       Economy

                 A Wi gensteinian look at the Russian economy

  "The results of philosophy are the uncovering of one or another piece of plain nonsense and
   bumps that the understanding has got by running its head against the limits of language.”

                                                                                Wi genstein

                                        by Jon Hellevig

                                       December 2014

                                     www.awaragroup.com
                                       +7 495 225 3038
PUTIN 2000 – 2014, MIDTERM INTERIM RESULTS:
DIVERSIFICATION, MODERNIZATION AND
THE ROLE OF THE STATE IN RUSSIA’S ECONOMY

CONTENTS

3        | INTRODUCTION
     3    | Why is the coverage of the Russian economy so skewed and misguided?
     3    | We are constantly being told that Russia supposedly “relies” on oil & gas rents
     4    | Regaining lost Time

5        | MAIN FINDINGS IN SUMMARY

9        | COMMENTARY

11        | MAIN FINDINGS WITH COMMENTARY AND CHARTS

     11       | EXPORTS
         11    |   Exports not only oil & gas
         12    |   Refined oil products on the rise
         12    |   Russia excels in global comparison
         14    |   The structure of exports
         15    |   Russian imports

     18       | INDUSTRIAL PRODUCTION
         18    |   Growth of 50% and total moderniza on of industrial produc on
         21    |   Produc on of cars
         22    |   Global car produc on and exports
         23    |   Agriculture and food produc on

     25       | PUBLIC SECTOR
         25    |   Oil & gas and other natural resources rents, share in GDP
         25    |   Russia's total tax rate as % of GDP is among developed economies
         26    |   Russia's total tax rate net of oil & gas rents
         26    |   World Bank gets it wrong
         27    |   Government spending as a share of GDP in Russia among lowest among developed na ons
         28    |   Public sector employment
         29    |   Turns out “bureaucrats” are not bureaucrats
         30    |   By number of actual bureaucrats Russia is far behind the Eurosocialist countries and on par
                   with the USA and Japan

    32        | TAXATION AND GDP
         32    | Spectacular growth of Russia's GDP following Pu n's Tax Reforms

                                                                                                  DECEMBER, 2014
PUTIN 2000 – 2014, MIDTERM INTERIM RESULTS:
DIVERSIFICATION, MODERNIZATION AND
THE ROLE OF THE STATE IN RUSSIA’S ECONOMY

CONTENTS

      33    |   Pu n's Millennium Challenge
      34    |   Low flat tax leads to surge in tax revenue
      34    |   Russia has the lowest taxes on labor among major countries
      36    |   The Russian economic miracle ‐ Tenfold increase of GDP
      37    |   Tax on oil & gas in Russia
      38    |   The oil & gas industry subsidizes the development of the general economy

     42    | LABOR PRODUCTIVITY
      42    |   Labor produc vity – What is actually being measured?
      42    |   Are they actually measuring waste?
      43    |   Global cross‐corporate labor produc vity measurements are not any be er
      45    |   The flawed measures of labor produc vity give credit to natural resources extrac on
                companies
      45    |   How labor produc vity actually can be measured
      46    |   What in reality affects labor produc vity
      46    |   Real progress on further improvement of the business climate should spell enhanced labor
                produc vity
      47    |   Corpora ons must do more to modernize corporate cultures and management styles
      47    |   Transport infrastructure bo leneck on labor produc vity
      48    |   Time is what is needed

     49    | THE STATE SECTOR AND GOVERNMENT'S INDUSTRIAL STRATEGY
      49    |   State ownership is actually beneficial for the economy
      49    |   Only state investments can challenge the exis ng global dominopoly
      50    |   How big is the Russian state sector actually?
      53    |   How the Russian government influences the economy
      53    |   Strategic programs on developing the economy
      54    |   Informa on technologies
      55    |   Investments in high technology and innova on
      56    |   Examples of sectors of that have benefited from state programs
      56    |   Avia on industry
      57    |   Shipbuilding
      59    |   Rostec – investment in development of Russian hi‐tech manufacturing industries
      60    |   Pharmaceu cal industry
      60    |   Domes c Tourism
      61    |   Social programs

62        | CONCLUSIONS

                                                                                             DECEMBER, 2014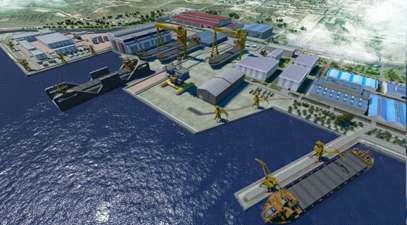
PUTIN 2000 – 2014, MIDTERM INTERIM RESULTS:
DIVERSIFICATION, MODERNIZATION AND
THE ROLE OF THE STATE IN RUSSIA’S ECONOMY
SUMMARY OF FACTS ON RUSSIA'S ECONOMIC DEVELOPMENT 2000 ‐ 2013
"The results of philosophy are the uncovering of one or another piece of plain nonsense and bumps
that the understanding has got by running its head against the limits of language.”
Wi genstein
1. The share of natural resources rents in GDP (oil, gas, coal, mineral, and 2. Russian industrial produc on has grown more than 50% while being totally
forest rents) more than halved between 2000 to 2012 from 44.5% to 18.7%. modernized at the same me.
The actual share of oil and gas was 16%.
Share of natural resources rents in GDP % Index of manufacturing, 2000‐2013
130
120
110
81,3% 18,7%
55,5%
100
Oil & gas in GDP
90
Rest of GDP
80
44,5%
70
2000 2001 2002 2003 2004 2005 2006 2007 2008 2009 2010 2011 2012 2013
Source: World Bank Source: UNECE Sta s cal Database
READ MORE READ MORE
3. Produc on of food has grown by 100%. 4. Produc on of cars has more than doubled at the same me when all the
produc on has been totally remodeled.
Index of food produc on in Russia, 1999‐2013 Motor vehicle produc on by country, 2003 and 2013
million cars
0 2 4 6 8 10 12 23
120
China 22,1
US
Japan
100 Germany
South Korea
India
80 Brazil
Mexico
Thailand 2013
Canada
60 Spain
2003
Russia
UK
40 Czech Republic
Turkey
1999 2000 2005 2008 2009 2010 2011 2012 2013
Source: Rosstat Source: OICA
READ MORE READ MORE
5. Russian exports have grown fivefold. 6. Growth of exports of non‐oil & gas goods has been 250%.
Fivefold growth of Russia’s export 2000‐2013 Non‐oil & gas exports, growth 2000‐2013,
USD,
bln
600 200
US $ bln.
500
400 100
300
200
0
100 2000 2005 2008 2009 2010 2011 2012 2013
Metals, precious metals and metalware Arms
0 Chemical products, rubber Wood, pulp and paper products
2000 2005 2008 2009 2010 2011 2012 2013 Food and agriculture Others
Machinery, transport Textile goods
Minerals Tanning materials, furs
Source: Rosstat, The Central Bank of Russia Source: Rosstat, The Central Bank of Russia
READ MORE READ MORE
1 DECEMBER, 2014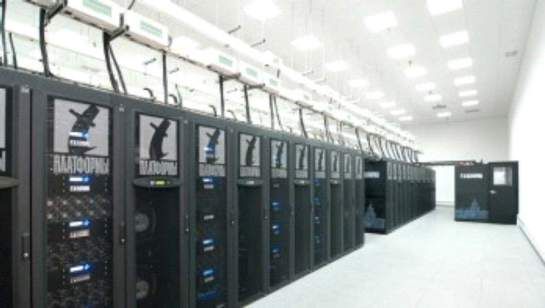
PUTIN 2000 – 2014, MIDTERM INTERIM RESULTS:
DIVERSIFICATION, MODERNIZATION AND
THE ROLE OF THE STATE IN RUSSIA’S ECONOMY
7. Russia's export growth has been more than doubled compared with the 8. Oil & gas does not count for over 50% of state revenues as it has been
compe ng Western powers. claimed, but only 27.4%. Top revenue bringer is instead payroll taxes.
Export growth in %, 2000 to 2012 Structure of Russia state revenue, 2013
398
2,9%
13,9% Pay-roll taxes
296
3,7% 28,8% Rent income
Corporate profit taxes
14,7% VAT
163
Property taxes
27,4%
102 90 Revenue from state property
77 66 8,6%
49 Other income
Russia Austria Germany USA
UK France Canada Japan
Source: WTO Source: Adapted from Vedomos
READ MORE READ MORE
9. Russia's total tax rate at 29.5% is among lowest of developed countries, non‐ 10. Public sector employment in Russia is not high in a global comparison.
oil & gas total tax rate is half that of the Western countries.
Total tax rate, % of GDP Employment in general government as a percentage of the labour force
%
(2001 and 2011)
50 35
45
40 30
35 2011
30 25
2001
25
20 20
15
Total tax rate, 15
10 % of GDP net oil
5 of oil & gas
0
10
Brazil
Sweden
Japan
Finland
Poland
US
France
Canada
Russia
Rep. of Korea
Australia
China
Norway
Italy
Germany
UK
5
0
Norway
Denmark
Sweden
Finland
Hungary
Estonia
UK
Luxembourg
Canada
Belgium
Ireland
Israel
Slovenia
Australia
OECO
US
Italy
Spain
Slovak Republic
Czech Republic
Netherlands
Portugal
Turkey
Austria
Germany
Poland
Switzerland
New Zelend
Chile
Mexico
Greece
Japan
Korea
Russia
Brazil
South Africa
Ukraine
Russia, non oil
Total tax rate, % of GPD
Source: 2014 Index of Economic Freedom, Heritage Fouda on Source: Interna onal Labour Organiza on (ILO), LABOSTA (database), OECD
Labour Force Sta s cs (database), Data for Korea were provided by
government officials
READ MORE READ MORE
11. Russia's GDP has grown more than tenfold from 1999 to 2012. 12. Russia's labor produc vity is not 40% of the Western standards as it is
frequently claimed, but rather on the level of 80%.
Russia, Nominal GDP, 1999 ‐ 2012 READ MORE
bln $
2500
2000
13. Far from “relying” on oil & gas, the Russian government is engaged in
1500
massive investments in all sectors of the economy, biggest investments going
1000
to avia on, shipbuilding, manufacturing of high‐value machinery and
500
technological equipment.
0
1999 2000 2001 2002 2003 2004 2005 2006 2007 2008 2009 2010 2011 2012
Source: Awara Group READ MORE
READ MORE
2 DECEMBER, 2014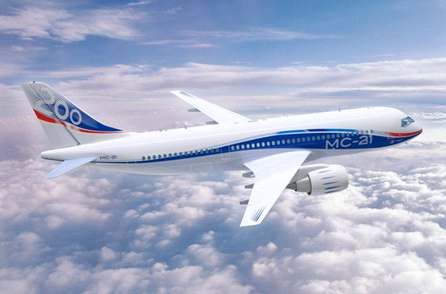
PUTIN 2000 – 2014, MIDTERM INTERIM RESULTS:
DIVERSIFICATION, MODERNIZATION AND
THE ROLE OF THE STATE IN RUSSIA’S ECONOMY

INTRODUCTION

Why is the coverage of the Russian economy so skewed and misguided?

This study takes aim at disapproving the con nuously repeated claims that Russia has supposedly not
diversified and modernized its economy. Our report shows that it is especially false to claim that the Russian
government has not done anything in this vein, that it would be “relying” on oil & gas rents and lacks an
understanding that more must be done. Quite the opposite, the Russian state under Pu n's leadership has
devoted all its spare resources to address this problem; the early results are impressive and a lot of effort and
strategic ini a ves are currently being implemented.

We are not implying that Russia's economy is in anyway in an ideal state ‐ it clearly is not (then again, there is
the ques on, the economy of which country would you characterize as ideal?). What we want to say is that
the Russian economy has reached an ini al maturity, which provides a solid pla orm for taking the next leap
to further industrializa on and development of a strong manufacturing industry u lizing the highest levels
of technology. This is why we are confident that Russia will be able to make the “true industrial
breakthrough” that President Pu n recently announced.

Pu n envisions the crea ng of strong na onal champions in machinery and processing industries that will
become major exporters of manufactured goods that are compe ve on the global markets. Pu n promises
that this will also entail renewed investment in applied science and R&D in the fields of machine building and
machine tool and instrument produc on.

We strongly believe that everyone benefits from knowing the true state of Russia's economy, its real track
record over the past decade, and its true poten al. Having knowledge of the actual state of affairs is equally
useful for the friends and foes of Russia, for investors, for the Russian popula on – and indeed for its
government, which has not been very vocal in telling about the real progress. I think there is a great need for
accurate data on Russia, especially among the leaders of its geopoli cal foes. Correct data will help investors
to make a profit. And correct data will help poli cal leaders to maintain peace. Knowing that Russia is not the
economic basket case that it is portrayed to be would help to stave off the foes from the collision course with
Russia they have embarked on.

In this report, we offer facts that should convince any reader who is interested in the truth that Russia has
during the past decade achieved impressive results in li ing, restructuring, diversifying and modernizing the
economy. In view of this data, it is easy to believe that an industrial breakthrough will happen during the next
10 years.

We are constantly being told that Russia supposedly “relies” on oil & gas rents
Itis con nuously argued that during the Pu n era, from 2000 to the present, Russia has done nothing to
diversify and modernize its economy, which supposedly only relies on oil & gas rents. This conten on is
ceaselessly repeated in economic analyses to the extent that it resembles propaganda more than analysis,
as is the case, for example, with this ar cle in The Telegraph.

             3                                                                                      DECEMBER, 2014
PUTIN 2000 – 2014, MIDTERM INTERIM RESULTS:
DIVERSIFICATION, MODERNIZATION AND
THE ROLE OF THE STATE IN RUSSIA’S ECONOMY

These kinds of ridiculous claims figure high in any Western business or poli cal commentary on Russia. Such
repor ng passes for economic analysis for example in the wri ngs of the reless Pu n cri c Anders Aslund.
Lately the narra ve has been taken up even by leaders of rival countries. For example, Barack Obama, the
president of the United States of America, who in view of the country's vast intelligence and analy cal
resources should be best informed about major trends in the world, permits himself to blurt that "Russia
doesn't make anything. Immigrants aren't rushing to Moscow in search of opportunity. The popula on is
shrinking," Obama is wrong on each count. We will here delve into the first, the ques on of Russia's
industrial produc on and economic diversifica on. Former U.S. Secretary of State Hillary Clinton also thinks
she knows that "Russia has not diversified its economy. It is s ll largely dependent upon natural resources,
principally gas and oil." Lesser leaders around the Western hemisphere are parro ng these same lines. Even
Alexander Stubb, the prime minister of Finland, Russia's ny neighbor, has got it in his head to spread these
allega ons about the supposed dismal and hopeless state of Russia's economy.

We should wonder where they get these ideas.

Regaining lost Time

The most frustra ng thing about the constant unfair cri cism about Russia's economy – indeed of all its
social and poli cal prac ces – is the total ignorance about the me factor. There is no a empt to relate the
state of Russia's economy and its progress to the me it has had to develop. In our opinion, the proper
star ng point from which we should count is the early 2000's and perhaps even as late as 2004. By this we
mean the point of me when Russia first reached the minimum poli cal and social stability which enabled
the successive governments under Pu n's leadership to start thinking about such mundane things as
economic strategy and industrializa on. Prior to that, since Pu n took over the presidency in 2000, it had
been a ques on of basic survival and establishing the elementary structures and reach of government
throughout the en re country. The first few years of Pu n's presidency can be characterized as having
nurtured Russia in emergency care, reeling from the knock‐out effects of the destruc on of the Soviet
economy, which had severely declined in the late 1980's and the ensuing anarchy and robber capitalism of
the 1990's. As soon as the first opportuni es emerged to work on posi ve development, Pu n seized them.
And a er that, Pu n has achieved phenomenal results in developing the economy and society at large.

Ignoring the me factor and the chaos at the star ng point, the self‐styled Russia experts seem to want to
compare Russia with the major Western countries that have developed in a market economy for hundreds of
years. But even that is not enough; they don't only ignore the me factor, they also skew the compara ve
figures for Russia. We will show how.

             4                                                                                 DECEMBER, 2014
PUTIN 2000 – 2014, MIDTERM INTERIM RESULTS:
DIVERSIFICATION, MODERNIZATION AND
THE ROLE OF THE STATE IN RUSSIA’S ECONOMY

MAIN FINDINGS IN SUMMARY

             Wi genstein: "What we are destroying is nothing but houses of cards and we are clearing up
                                                          the ground of language on which they stood."

1.You cannot intelligently limit the story about Russia's economy – as the misguided analysts do – to the
ques on about the share of oil & gas in exports without looking at all the other aspects of it. A er all, the oil
& gas industry does in no way squeeze resources from the rest of the economy. On the contrary, it takes up
only 3% of the workforce and subsidizes the rest of the economy with the export revenues and high taxes.
Contrary to what we are told, there is no risk whatsoever of the “Dutch disease” here.

2.According to World Bank data the share of natural resources rents in GDP (the sum of oil rents, natural gas
rents, coal rents, mineral rents, and forest rents) more than halved between 2000 to 2012 from 44.5% to
18.7%. The actual share of oil and gas (net of other natural resources rents) was 16%.

3.The thesis that Russia's economy is a failure rests almost en rely on one single conten on, the thesis –
repeated ad nauseum ‐ that “70% of Russia's exports are made up of oil & gas”. This export figure is in itself
true, but is by no means the end of the story. In this connec on, the cri cs want to totally ignore the
discussion of the impressive development of the domes c industry, the whole economy and the social
structures. Exports are far from the only measure of how diversified an economy is. In any historic
development of a na onal economy the process of sa sfying domes c needs naturally comes first. This is
what the misguided “Russia experts” fail to understand. They don't want to see that Russia has in 10 years
totally modernizing its economy and industry and filled the vacuum in supply a er the fall of the Soviet
Union. . It is only natural that in the first 10 years of economic restructuring you first supply the home market
and move on to export markets only a er you have sa ated domes c demand. In these 10 years, Russia has
indeed filled the vacuum on the domes c market with an impressive rise of 50% in industrial produc on.

Because companies as economic actors do not strive to sa sfy the whims of economic analysts but to make a
profit, companies on the Russian market have during the reindustrializa on of the country first supplied the
home market. Very few enterprises could possibly afford to employ such a fool as a CEO who would refuse to
sell on the domes c market and instead start with exports only to sa sfy the demand to “diversify Russia's
economy”, as required by the Western and quasi‐liberal analysts. No, corpora ons don't work for these
analysts; they work with a profit mo ve for their shareholders, selling where they can make the best profit.

4. But even that is not the end of the story. If the analyst would examine the figures beneath the surface veil
of “oil & gas making up 70%...”, then he'd realize the that total exports have risen fivefold over 2000 to 2013
from $103 billion to $526 billion, and therefore exports of non‐oil & gas products also grew by a whopping
250%. If this is not enough for 12 years, then what were they possibly expec ng? A doubling every two years!
More details here.

5. Besides this, the cri cs fail to no ce that within exports of oil & gas proper there is an interes ng
diversifica on trend in that Russia has made a remarkable switch from exports of crude oil to exports of
value‐added refined products. More details here.

             5                                                                                     DECEMBER, 2014
PUTIN 2000 – 2014, MIDTERM INTERIM RESULTS:
DIVERSIFICATION, MODERNIZATION AND
THE ROLE OF THE STATE IN RUSSIA’S ECONOMY

Exports of refined oil products increased by 900% from $10.9 billion to $109 billion. The share of value‐
added oil products has risen rela ve to crude oil in total oil exports from 30.6% to 38.6%. .

6.While the accusa on is constantly being made that Russia has failed to develop strong exports of
manufactured goods, it is ignored that very few countries in the world have been able to develop such
exports. I invite the reader to list 10 countries, in addi on to China, that have been able to do it during the
last 20 years. The same countries that dominated such exports con nue to do it, albeit with falling volumes
(except for Germany). Commodi es prevail, as with Russia, in exports of two of the G7 countries, Australia
and Canada. More details here.

7.Russia's food produc on doubled from 2000 to 2013, at the same me that exports of food skyrocketed
from almost nil to $16 billion.

8.We don't discuss in this report the growth of retail, but want to point out what all real experts should know
‐ that the Russian retail sector over these years has undergone a total restructuring and moderniza on.
Serious domes c and foreign retail chains have entered the market. Gone are the once ubiquitous shadow
economy outdoor markets and rag fairs, having been replaced by modern malls, retail space and logis cs
centers. Naturally, retail had to come before produc on, and produc on before exports.

9.We are also puzzled as to the meaning of the claim that “Russia has not diversified its economy”. Perhaps
this is just another nonsensical statement that does not mean anything.

One must understand that Russia is a market economy, and therefore the whole cri cism that Russia has not
diversified is wrong. For in this connec on there is no “Russia”, there are only a mul tude of corpora ons
that make their own business decisions. And for all we know they have made the right decisions in inves ng
in Russia and sa sfying the domes c market.

By “Russia” then they can mean only the government. And here the ques on would be, whether the
government (read, Pu n) has not done enough to create the condi ons for economic development,
diversifica on and moderniza on. Our report provides the resounding answer that indeed he has. It would
not be reasonable to expect any more impressive results for the first 14 years of this work.

In addi on to providing the condi ons for enterprises to thrive, the state may also take a more ac ve role in
the economy. Have the Russian governments under Pu n not done so? Yes, they have. It has been done by
targeted, successfully implemented, strategic programs for developing various sectors of the economy and
industry.

Finally there is the ques on of direct state ownership in enterprises and investments in industry. Have the
governments under Pu n not done enough in this respect? No! – But wait a minute, isn't that what the cri cs
want? “No government investment in industry” is their war cry. These cri cs want to have their cake and eat
it, too. No diversifica on of the economy has happened, they falsely shout. But at the same me they scorn
all of Pu n's ini a ves to invest in industry. Well, fortunately their looney cri cism is increasingly falling on
deaf ears as Russia has established a solid pla orm for the future ‐ moving on to the next stage of
development of the economy with Pu n's program to effect an industrial breakthrough. More details here.

             6                                                                                     DECEMBER, 2014
PUTIN 2000 – 2014, MIDTERM INTERIM RESULTS:
DIVERSIFICATION, MODERNIZATION AND
THE ROLE OF THE STATE IN RUSSIA’S ECONOMY
10.Public sector. It is argued that the public sector of Russia is dispropor onate. We will show that this
argument as well is false and baseless. Russia's public sector is among the lowest among developed
economies when measured on three key indicators.
While Russia's total tax rate was 29.5%, the countries with developed Eurosocialism, like Finland, Sweden
and France, had a total tax rate at the level of 45%. This means that the Russian government imposes
significantly less taxes on its ci zen and corpora ons than the Western countries
The size of the public sector may also be measured in terms of government spending as a percentage of GDP.
On this figure, Russia also ranks significantly lower than most of the Western countries, being about 2/5
lower than the Northern European countries.
Public sector share of employment in Russia is not high in a comparison with developed economies. State
officials make up 17.7% of Russia's total work force, which situates it in the middle of the comparison with
global economies. More details here.
.
11.Oil & gas revenue does not make up 50% of Russia's budget revenue as is commonly claimed, but only
27.4%. It is not even the biggest source of state revenue, which posi on is held by payroll taxes at 28.8%.
More details here.
But, notwithstanding that the share of oil & gas taxes is not as big as is commonly claimed, the oil & gas
industry is heavily taxed. And this is not detrimental to the economy, as cri cs want us to think. Quite the
contrary, the rather severe taxa on of the oil & gas industry in fact means that it subsidizes the rest of the
economy, which enjoys some of the lowest taxes of all developed na ons. Russia's total tax rate net of oil &
gas taxes is only 24.1% (2012).
12.Foreign direct investments. Cri cs constantly argue that Russia has not been successful in a rac ng
foreign direct investments in its economy. This claim is also wrong, just like most of their supposed analysis.
In fact, Russia has during the last three years a racted the third largest foreign direct investment flows of all
countries in the world, right a er the USA and China. When measuring the inflow of FDI as a percentage of a
respec ve country's GDP, then Russia, followed by Poland, turns out to be the absolute leader for the years
2011 to 2013.
Following the tax reforms and other major reforms of Russian society by Pu n, such as strengthening the
judiciary system and rule‐of‐law and public administra on, the Russian gross domes c product (GDP) in
dollar terms has increased tenfold since Vladimir Pu n first took office in 2000. At end of 1999, the Russian
nominal GDP was in US dollar terms 196 billion. By the end of 2012 the nominal GDP had risen to $2,015
billion. This represents a growth of more than 1000% in 12 years. More details here.
13.Russia's labor produc vity is not at the level of 40% compared with developed economies, as cri cs
claim. Rather, the whole method by which the measurement of labor produc vity is supposedly derived
using the GDP figures is wrong at best, and most probably outright nonsensical. The same applies to the
method of comparing cross global labor produc vity of companies by comparing sales revenue to
workforce. More details here.
7 DECEMBER, 2014PUTIN 2000 – 2014, MIDTERM INTERIM RESULTS:
DIVERSIFICATION, MODERNIZATION AND
THE ROLE OF THE STATE IN RUSSIA’S ECONOMY
14.Cri cs habitually deny Pu n any credit in the remarkable growth of the Russian economy since he took
charge of the country. All is supposedly merely due to windfall revenues following sharp rises in the price of
crude oil on world markets coinciding with his tenure. But, these same cri cs also hold against Pu n the act
of jailing the oligarch Mikhail Khodorkovsky. And yet, it was precisely the fact that Pu n reined in the robber
oligarchs and Khodorkovsky in par cular that made all the difference. Only then was Pu n able to pass
legisla on that ensured that Russia's vast oil assets were taxed for the benefit of the na onal economy and
its people. More details here.
"It is not a ma er of discovering new facts, but of finding a way of expressing
what we have known all along."
Wi genstein's method
Russian retail in 1990s…
…and same in 2009
8 DECEMBER, 2014PUTIN 2000 – 2014, MIDTERM INTERIM RESULTS:
DIVERSIFICATION, MODERNIZATION AND
THE ROLE OF THE STATE IN RUSSIA’S ECONOMY
COMMENTARY
Indeed, we are profoundly bewildered as to the unprofessionalism of the economic analysts and poli cal
pundits who pronounce on the Russian economy. How is it possible that they constantly miss the essen als?
Not only do they fail in the analysis of the fundamental trends of the economy, but frequently they even get
the facts totally wrong. In our great perplexity in this regard, we have been trying to let ourselves be guided
by the old adage: Never ascribe to malice that which is adequately explained by incompetence. – But don't
rule out malice, for to that extent is the analysis intellectually feeble.
The economic and poli cal observers who speak disparagingly about the Russian economy o en claim that
Russia (read Pu n) “relies” exclusively on oil & gas revenues. As one analyst writes: “As much of the rest of
the world struggles to cope with the fragmenta on of manufacturing value chains and strives to move up
the value‐added ladder, Russia con nues to rely on a largely commodity‐based growth model”. The gist of
that argument is that President Pu n is a reckless leader who does not understand or care about economic
reali es and future prospects, being dominated by short‐sighted illusions that oil & gas rents would carry
Russia from here to eternity. They portray Pu n as a happy‐go‐lucky kind of a chap who spends oil & gas
revenues without caring for developing the overall economy. Not surprisingly, our analysis shows that that is
a lot of bilge as well. Totally contrary to the idea that Russia was wallowing in an oil & gas binge, it has in fact
been using the oil & gas revenues to subsidize the development of all the other sectors of the economy.
Another example of the “Russia relies on oil & gas” argument is provided by Dmitry Trenin from Carnegie
Moscow Center. Trenin writes that Russia “lacks real economic strength” (we wonder what the defini on is,
in view of the data presented in this report) and rhetorically states: “unless it deals with this massive
deficiency,” Russia will be doomed. The implica on is that Pu n has not realized that the economy must be
strengthened; nothing has been supposedly done and nothing achieved. Trenin says that, “Russia should
work to…” – but he has not no ced any work, even though it is his job to monitor these issues – “…advance in
qualita ve terms: labor produc vity; science and technology power; and the general quality of life of its
people.” And in the absence of that, Russia will “slide even deeper.” We can well understand that Trenin may
miss the points on science and technology when the approach seems to be so superficial (probably relying
on the Economist and other such sources), but the failure by Dmitry Trenin as a Russian living in Russia to
detect any improvement in “the general quality of life” of the Russian people we must unfortunately
a ribute to the malice factor.
The charge that “Russia has not diversified” is also peculiar, not only because it is false, but also because the
people that make the charge are usually either Western adherents of the free market theory or Russian
domes c quasi‐liberals. One may ask, who is this “Russia” that in their view has failed in this ac vity? They
seem to be referring to the state and in par cular Pu n and his governments. But if so, then they are being
very illogical according to their own ideology. We mean that they are the ones that claim that the state
should stay out of the economy and not interfere in it. This being the case, how do they then think that the
state has failed in the diversifica on? What should the state have done? Invest more in businesses? But
wasn't that precisely what they oppose? It becomes evident from this report that the state has done a lot for
diversifica on in all aspects: providing a favorable tax regime, improving the business climate, suppor ng
9 DECEMBER, 2014PUTIN 2000 – 2014, MIDTERM INTERIM RESULTS:
DIVERSIFICATION, MODERNIZATION AND
THE ROLE OF THE STATE IN RUSSIA’S ECONOMY
companies and en re sectors of the economy to diversify, modernizing the economy. And quite recently
Pu n has announced that he will make these wishes of the cri cs come true with renewed heavy state
investments in industry to create new strong na onal champions. But will that sa sfy the cri cs, when their
dream comes true? No, it won't, because nothing will. They are in fact preciously li le concerned about the
economy. Their mo o is: “It's not the economy, stupid! Our business is Pu n‐bashing.”
10 DECEMBER, 2014PUTIN 2000 – 2014, MIDTERM INTERIM RESULTS:
DIVERSIFICATION, MODERNIZATION AND
THE ROLE OF THE STATE IN RUSSIA’S ECONOMY
MAIN FINDINGS WITH COMMENTARY AND CHARTS
Wi genstein: "We must do away with all explana on, and descrip on alone must take place"...
"The problems are solved not by repor ng new experience, but by arranging what we have always known.
Philosophy is a ba le against the bewitchment of our intelligence by means of our language"
EXPORTS
Exports not only oil & gas
We are being reminded constantly that oil & gas make up 70% of Russia's exports. We are then fed the
conclusion that Russia has not done anything to diversify its exports. True, the oil & gas sector counts for
approximately 70% of the exports. But at the same me total exports have risen fivefold from 2000 to 2013,
from $103 billion to $526 billion. Strikingly, these analysts have failed to no ce that beneath the surface of
“70% of oil & gas” there hides a staggering 250% growth of exports of goods other than oil & gas. In 2000,
non‐oil & gas exports were worth $50.4 billion but as of 2013 they had grown to $176 billion. (Chart 1).
Looking at these amazing figures we remain u erly perplexed when we encounter the claim that Russia has
not done anything to diversify its economy. The cri cs are not sa sfied with the pace of doubling the non‐oil
& gas export volumes every five years. Then what did they expect? A doubling every second year!
Chart 1. Non‐oil & gas exports, growth 2000‐2013,
US $ bln.
200
100
0
2000 2005 2008 2009 2010 2011 2012 2013
Metals, precious metals and metalware Arms
Chemical products, rubber Wood, pulp and paper products
Food and agriculture Others
Machinery, transport Textile goods
Minerals Tanning materials, furs
Source: Rosstat, The Central Bank of Russia
11 DECEMBER, 2014PUTIN 2000 – 2014, MIDTERM INTERIM RESULTS:
DIVERSIFICATION, MODERNIZATION AND
THE ROLE OF THE STATE IN RUSSIA’S ECONOMY
Refined oil products on the rise
Furthermore, the cri cs fail to no ce that within oil & gas proper there is an interes ng diversifica on trend
in that Russia has made a remarkable switch from exports of crude oil to exports of value‐added refined
products. Exports of refined oil products increased by 900% from $10.9 billion to $109 billion. The share of
value‐added oil products has risen rela ve to crude oil in total oil exports from 30.6% to 38.6%. If we net the
exports of refined oil products (which in fact is manufacturing) from the figures, then we see that actually
the share of crude oil & gas has remained almost the same in the overall export structure from 2000 to 2013.
(Chart 2). Here we propose to take into considera on also the fact that the sta s cs from the beginning of
the 2000's might not give an en rely truthful picture of the rela ve share of oil exports as the figures might
well be underes mated. This is due to the widespread tax evasion schemes that the oil exporters at that me
engaged in. We will return to this ma er below in connec on with discussing the Russian tax reforms and
the shady dealings of Mr. Khodorkovsky.
%
Chart 2. Export Share of Russian Energy, 2000‐2014
70
Oil products
60 Crude oil
Gas
50
40
30
20
10
0
00 01 02 03 04 05 06 07 08 09 10 11 12 13 14
Source: NordeaMarkets, Macrobond
Russia excels in global comparison
A major deficiency in the discussion about the Russian economy is the absence of a compara ve approach.
For us it seems very odd indeed, that you would pronounce on the results of someone or something without
rela ng those results to what others have achieved. Only such a comparison would tell you what is to be
considered as the norm and thus feasible. In medicine, you would not make a diagnosis without comparing
the results of your pa ent to what the medical norms are.
12 DECEMBER, 2014PUTIN 2000 – 2014, MIDTERM INTERIM RESULTS:
DIVERSIFICATION, MODERNIZATION AND
THE ROLE OF THE STATE IN RUSSIA’S ECONOMY
We have made such a comparison. Chart 3 illustrates how impressive Russia's growth has been in
comparison to the major Western powers. From 2000 to 2012, Russia evidenced export growth of 398%,
leaving Australia behind with 296% growth. The growth of the European powerhouse Germany with 163%
pales in comparison with Russia. And the rest were far behind. We remind that Russia's non‐oil & gas exports
grew by 250%, so even with this figure Russia is comparable Australia. But the “Russia experts” keep saying
that there is no diversifica on and “Pu n only relies on oil & gas rents” (sic!).
Chart 3. Export growth in %, 2000 to 2012
398
296
163
102 90
77 66
49
Russia Australia Germany USA
UK France Canada Japan
Source: WTO
It is interes ng to compare the structure of Russia's exports with that of Australia, Chart 4. We can see that
minerals, oil products and commodi es prevail with Australia similarly as with Russia although Australia is a
mature economy that has had the possibility to develop its industry as a market economy for hundreds of
years compared with Russia's a decade or so.
Chart 4. Structure of Australian exports, 2013
1,4%
0,5% minerals
oil products
0,4%
2,0% metals, precious metals
and metarware
6,1% others
32,1% food and agriculture
9,4% machinery, transport
textile goods and
10,2% footwear
chemical products,
11,9% 25,9% rubber
tanning materials,
furs
Source: WTO
13 DECEMBER, 2014PUTIN 2000 – 2014, MIDTERM INTERIM RESULTS:
DIVERSIFICATION, MODERNIZATION AND
THE ROLE OF THE STATE IN RUSSIA’S ECONOMY
The structure of exports
Within the structure of exports (Chart 5) we may here men on a few sectors separately:
Export of machinery and equipment. Exports of machinery and equipment increased in the years surveyed
from $9 billion to $28 billion, a 210% growth. Exports of machinery and equipment net of arms trade
increased alone by 370%.
Export of arms. Russia now shares with the USA the posi on of number one exporter of arms with an annual
volume valued at approximately $13 billion.
Export of agriculture and food products has skyrocketed during the years under review from almost nil to
$16 billion (Chart 6). In grain exports Russia is now among world's top five expor ng countries with exports
of 22 million tons in 2012 (Chart 7). The volume of Russia's food exports is now bigger than its arms exports.
In export of services (which was not included in the above figures which represent export of goods), Russia's
recent success in exports of so ware and programming work stands out. In just a few years the volumes
have gone from half a billion of USD in 2003 to 5.2 billion in 2013. (Chart 8). Russia now counts as the world's
third largest so ware exporter a er India and China.
Chart 5. Structure of Russian exports, 2000‐2013
US $ bln
600
500
400
300
200
100
0
2000 2005 2008 2009 2010 2011 2012 2013
Crude oil Oil products
Metals, precious metals
Gas
and metalware
Chemical products, Minerals
rubber
Food and agriculture Machinery, transport
Wood, pulp and
Arms
paper products
Others
Source: Rosstat, Central Bank of Russia
14 DECEMBER, 2014PUTIN 2000 – 2014, MIDTERM INTERIM RESULTS:
DIVERSIFICATION, MODERNIZATION AND
THE ROLE OF THE STATE IN RUSSIA’S ECONOMY
Chart 6. Russia’s export of food and agricultural Chart 7. Exports of grains in Russia,
products, 2000‐2013 1990‐2012
bln, $
mln.tons
18 25
16
14 20
12
10 15
8
10
6
4 5
2
0 0
1990
1991
1992
1993
1994
4995
1996
1997
1998
1999
2000
2001
2002
2003
2004
2005
2006
2007
2008
2009
2010
2012
2011
2000 2005 2008 2009 2010 2011 2012 2013
Source: Rosstat Source: Newsruss
Chart 8. Export of so ware in Russia, It is also worth no ng how the export order
USD, 2003‐2013 por olio of Russian state nuclear corpora on
bln
6 Rosatom is expected to double in 2014 and reached
5
$100 billion compared with $50 billion two years
ago. I would think this is a truly hi‐tech industry.
4
3
2
1
0
2003 2004 2005 2006 2007 2008 2009 2010 2011 2012 2013
Source: Russo
Russian imports
The figures on imports together with those on foreign direct investments confirm that there have been
massive investments into moderniza on of the Russian industry.
15 DECEMBER, 2014PUTIN 2000 – 2014, MIDTERM INTERIM RESULTS:
DIVERSIFICATION, MODERNIZATION AND
THE ROLE OF THE STATE IN RUSSIA’S ECONOMY
Chart 9 shows that within imports there has been a clear growth of machinery and equipment needed for
industry.
Chart 9. Structure of Russian imports, 2000‐2013
US $
350
300
250
200
150
100
50
0
2000 2005 2008 2009 2010 2011 2012 2013
Chemical products,
Machinery, transport
rubber
Textile goods
Food and agriculture and footwear
Metals, precious metals Others
and metalware Wood, pulp and
Minerals paper products
Tanning materials, fur
Source: Rosstat, Central Bank of Russia
Cri cs constantly argue that Russia has not been successful in a rac ng foreign direct investments into its
economy. This claim is also wrong, just like most of their supposed analyses. In fact, Russia has during the last
three years a racted the third largest foreign direct investment flows of all countries in the world, right a er
the USA and China (Chart 10). When measuring the inflow of FDI as a percentage of the respec ve country's
GDP, then Russia, followed by Poland, turns out to be the absolute leader for years 2011 to 2013 (Chart 11).
These foreign direct investments have precisely been a racted to diversify and modernize the economy.
16 DECEMBER, 2014PUTIN 2000 – 2014, MIDTERM INTERIM RESULTS:
DIVERSIFICATION, MODERNIZATION AND
THE ROLE OF THE STATE IN RUSSIA’S ECONOMY
Chart 10. FDI flows, 2011‐2013
230000 230000 230000
220000 USA 220000 USA 220000 USA
210000 China 210000 China 210000 China
200000 Brazil 200000 Brazil 200000 Russia
190000 Germany
190000 190000
Russia Brazil
180000 180000 180000
Russia UK Canada
170000 170000 170000
160000 UK 160000 160000 UK
Canada
150000 Canada 150000 France
150000 Germany
140000 France 140000 Germany 140000 France
130000 130000 130000
Poland Poland Finland
120000 120000 120000
110000 Finland 110000 Finland 110000 Poland
100000 100000 100000
90000 90000 90000
80000 80000 80000
70000 70000 70000
60000 60000 60000
50000 50000 50000
40000 40000 40000
30000 30000 30000
20000 20000 20000
10000 10000 10000
0 0 0
2011 2012 2013
-10000 -10000 -10000
Source: UNCTADstat
Chart 11. FDI flows (in % of GDP), 2011‐2013
4 4 Brazil
4
Poland Russia
Russia Russia Canada
4 4 4
Brazil Canada Brazil
Canada UK UK
3 3 3
UK Finland China
China China USA
3 3 3
Germany Poland Germany
USA USA France
2 2 2
France France Finland
2 Finland 2 Germany 2 Poland
1 1 1
1 1 1
0 0 0
2011 2012 2013
-1 -1 -1
-1 -1 -1
-2 -2 -2
Source: UNCTADstat
17 DECEMBER, 2014PUTIN 2000 – 2014, MIDTERM INTERIM RESULTS:
DIVERSIFICATION, MODERNIZATION AND
THE ROLE OF THE STATE IN RUSSIA’S ECONOMY
INDUSTRIAL PRODUCTION
Growth of 50% and total moderniza on of industrial produc on
The “Russia experts” start and stop their analysis with a reference to the 70% share of oil & gas in Russia's
exports. Full stop. It is as if, in their illusionary world, no other facts existed, as if an economy only consisted
of exports. The much bigger domes c market they shrug off with the absurd pretension that “Russia does
not produce anything, has not diversified and has not modernized” and “unless Russia does something
about it, then…”. As if nothing had been done and nothing was underway. We have already seen a lot of facts
that show the baselessness ‐ and baseness of these arguments. Let's now review a bit more in detail what
the situa on actually is in Russian industry.
For those who are accustomed to hearing that Russia presumably does not produce anything and who
believe the legend that nothing has been done about developing and diversifying the economy, it might
come as a surprise to learn that Russia's industrial produc on has grown by at least half from 2000 to 2013.
Chart 12 shows the growth of industrial produc on (volume indices) for different countries. Of the surveyed
countries, Poland showed the most impressive growth, having prac cally doubled its produc on in the years
under survey. Russia, with its more than 50% growth, was second. The other countries experienced at best a
10% growth (Germany), while the indicator was altogether nega ve for the UK and France. Naturally, we do
not, by the sample of countries, pretend to show that Russia is among world leaders in growth of industrial
produc on; rather the aim was to compare Russia with the leading Western countries. The wider database is
available at this link.
Chart 12. Index of Industrial Produc on in % to 2005 year
(2005 = 100%), 2000‐2013
%
160 UK
150 Russia
140 Finland
130 USA
120 Poland
Canada
110
France
100
Gerany
90
80
70
60
2000 2001 2002 2003 2004 2005 2006 2007 2008 2009 2010 2011 2012 2013
Source: UNECE Sta s cal Database, complied from na onal and interna onal (CIS, EUROSTAT, IMF, OECD)*
18 DECEMBER, 2014PUTIN 2000 – 2014, MIDTERM INTERIM RESULTS:
DIVERSIFICATION, MODERNIZATION AND
THE ROLE OF THE STATE IN RUSSIA’S ECONOMY
It is worth no ng that this index is in volume terms, and thus is not dependent on price increases. What's
more, it should be recognized that in parallel with this growth in absolute volumes, there has been a total
moderniza on of Russia's industry, it having undergone a total revamp in terms of quality and desirability.
Russia no longer produces low quality goods that are not a rac ve on the market, as was the case with the
late USSR. Products that Russia produces today are quite compe ve with imports in the given price
segments. We would challenge anybody who disagrees with us to iden fy endemic low quality goods that
have been upgraded in the modern economy. In view of this, the growth as such does not tell the whole story
of renewal and moderniza on of the economy, as it hides the effect on restructuring the old produc on lines
and improving quality of produc on. This tells much about the moderniza on that has happened in leaps
and bounds, but is which is so difficult to measure.
The next stage of development will then be to increase exports of Russian manufactured goods. But this is
not only a ques on of produc on, as there are many obstruc ons in the way. These include trade barriers
that are raised due to geopoli cal reasons and, very importantly, ques ons of brands.
Russia's industrial poten al is also evidenced by a comparison of the number of people employed in
manufacturing industries in various countries. Chart 13 shows the percentages of the labor force of various
countries employed by manufacturing. Of Russia's total working age popula on, 14.8% were employed in
manufacturing, which is significantly higher than the 10.1% for the USA. This global comparison is hardly
indica ve of Russia lacking manufacturing industries. We are inclined to consider that Russia indeed has a
less produc ve manufacturing industry, in general, and therefore may employ more people than global
efficiency standards would call for. But we would es mate that difference at a maximum of 20%.
Chart 13. Employment in Manufacturing
(% of total employment), 2012
%
16
14
12
10
8
6
4
2
0
Germany
Russia
Rep.Korea
Japan
Mexico
Australis
New Zeland
Canada
Italy
Turkey
Sweden
France
UK
US
Netherland
South Africa
Source: Buruea of labour Sta s cs, Rosstat
19 DECEMBER, 2014PUTIN 2000 – 2014, MIDTERM INTERIM RESULTS:
DIVERSIFICATION, MODERNIZATION AND
THE ROLE OF THE STATE IN RUSSIA’S ECONOMY
Chart 14 shows how the share of the working age popula on employed in industry (manufacturing, mining,
and construc on) has fallen across the globe.
Chart 14. Employment shares by sector in %
1980 2012
Agriculture Industry Services Not Employed Agriculture Industry Services Not Employed
US 2,0 17,3 39,8 40,8 0,9 10,1 47,6 41,4
Australia 3,8 16,7 37,8 41,7 1,8 12,1 48,7 37,3
Canada 3,0 16,5 40,9 39,7 1,4 12,0 49,1 37,5
France 5,6 19,1 28,1 47,2 1,5 10,3 38,5 49,7
Germany 2,8 22,8 27,6 46,9 0,9 15,0 40,0 44,0
Italy 6,5 17,0 22,4 54,0 1,6 11,6 30,5 56,3
Japan 6,2 21,5 33,6 38,7 2,1 13,9 40,2 43,8
Republic of Korea 19,0 16,0 20,9 44,1 3,7 14,2 41,5 40,6
Mexico NA NA NA NA 7,5 13,0 34,9 44,5
Netherlands 2,7 15,5 33,9 47,9 1,7 9,9 49,7 38,6
New Zeland NA NA NA NA 4,3 12,1 47,1 36,5
South Africa NA NA NA NA 2,0 9,4 29,6 59,0
Spain 8,3 16,1 20,3 55,3 1,9 8,8 34,1 55,2
Sweden 3,7 20,7 41,3 34,4 1,3 11,2 47,6 39,9
Turkey NA NA NA NA 10,2 11,4 22,7 55,8
UK 1,5 21,1 35,9 41,5 0,7 10,3 47,4 41,6
Source: Buruea of labour Sta s cs, Interna onal labour comparison
20 DECEMBER, 2014PUTIN 2000 – 2014, MIDTERM INTERIM RESULTS:
DIVERSIFICATION, MODERNIZATION AND
THE ROLE OF THE STATE IN RUSSIA’S ECONOMY
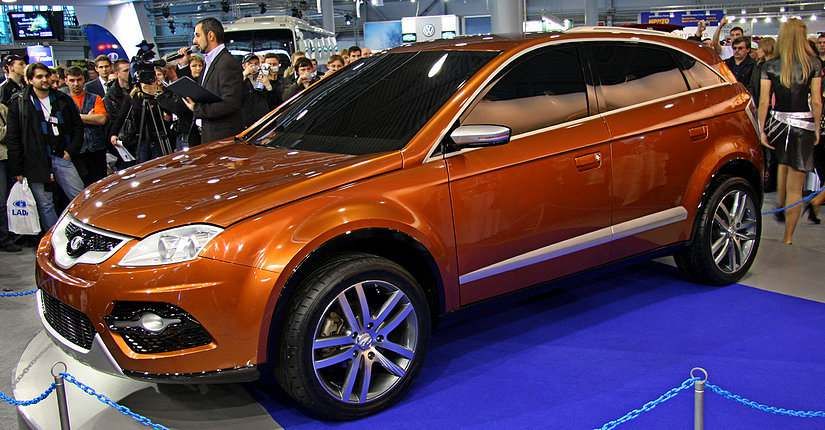
Produc on of cars
Russia has almost doubled automo ve produc on (private cars, trucks and buses) from 2003 when it
produced 1,279,000 cars, to 2013 with produc on of 2,175,000 cars. In addi on, some 900,000 cars were
imported into Russia.
This represents not only a quan ta ve growth of cars produced but a total revamp of the sector. Gone are all
the classic Soviet models as Russian producers have also updated their models and produc on processes to
meet the high interna onal standards. Russia has been successful in renewing its automo ve industry by
a rac ng major interna onal car producers to manufacture in Russia. Over half of the domes cally
produced cars in Russia are foreign brands manufactured by Russian‐ and foreign‐owned plants. The
number of domes cally assembled foreign cars sold in Russia increased from 290,000 (vs. 750,000 imported
cars) in 2007 to 1,220,000 (970,000 imported) in 2012 (source: Associa on of European Businesses).
Naturally, in the ini al stage the produc on of foreign brands in Russia has meant assembling the cars from
foreign‐produced parts. And this is, of course, what the cri cs want to maintain. In reality, the Russian
government has been able to impose condi ons that have served to encourage localizing of the produc on
in Russia along the value chain securing the influx of foreign technology. The contracts with foreign
manufacturers signed between 2005 and 2007 required that up to 30 percent of the produc on had to be
localized. But, in later years the localiza on requirements have grown to 60 percent. Thirty percent of
foreign car brands produced in Russia are also to be equipped with Russian‐produced engines and
gearboxes. )
Following this successful industrializa on policy in the automo ve industry, the domes c car industry is
es mated at over $40 billion (2013).
Isn't this enough for ten years, or did the “Russia experts” expect Russia to become a major cars exporter
within ten years as well?
New model
from Avtovaz
21 DECEMBER, 2014PUTIN 2000 – 2014, MIDTERM INTERIM RESULTS:
DIVERSIFICATION, MODERNIZATION AND
THE ROLE OF THE STATE IN RUSSIA’S ECONOMY
Global car produc on and exports
In researching the Russian automo ve market we came across very interes ng data on the global market of
car produc on and exports and therefore will shortly digress into that. We refer to Chart 15. From this we
see the shocking figures of the change in car produc on in various countries, and the growth of the share of
cars produced in the emerging markets, that is, non‐Western countries. Produc on of cars in China has
exploded in 10 years from 4.4 million in 2003 to 22 million in 2013. Big gains were made also by India, Brazil,
Mexico, Thailand, Russia and Turkey.
Chart 15. Motor vehicle produc on by country, 2003 and 2013
million cars
0 2 4 6 8 10 12 23
China 22,1
US
Japan
Germany
South Korea
India
Brazil
Mexico
Thailand 2013
Canada 2003
Spain
Russia
UK
Czech Republic
Turkey
Source: OICA
China and most of the emerging car‐producing countries have so far not become major exporters of their
cars. But imagine what will happen when they do! Here the ques on is exactly the same as with Russia's
exports; you sa sfy home markets first and then expand to export markets. This should be of great concern
to the Western world as car produc on is the single most important manufacturing industry in several of the
major Western countries and cars is the number one top export of many of them, in par cular: Germany,
United States, Japan, United Kingdom, Canada, Spain, Czech Republic, Hungary, Slovakia, and Romania.
22 DECEMBER, 2014PUTIN 2000 – 2014, MIDTERM INTERIM RESULTS:
DIVERSIFICATION, MODERNIZATION AND
THE ROLE OF THE STATE IN RUSSIA’S ECONOMY
Chart 16 illustrates the export and import of cars of the major players in interna onal trade of cars. (EU
presented as one block, and trade between the EU countries eliminated). There are a few striking
conclusions to draw from this. We can see that Japan is very much dependent on the export of cars, as is
Germany, which is the major exporter by far within EU. The imports are mainly absorbed by USA and China.
What will happen to the EU when the USA and China stop buying German cars? And when China stops
buying them and instead starts expor ng its own? This is a real danger, especially as cars are by technological
standards and quality fast approaching a commodity status and Chinese quality is growing. I would pose the
ques on is the Western economic model centering on selling cars to each other a viable way for the future?
Chart 16. Global export and Import of Car, 2010
Eur bn
100 export
75 import
trade balance
50
25
0
-25
-50
EU-27 USA JAPAN CANADA SOUTH KOREA CHINA MEXICO
-75
Source: Eurostat
Agriculture and food produc on
As examples of some of Russia's successful strategic programs on sectorial development of the economy
we may men on the programs concerning the agriculture and food sectors. This was evident from the
impressive figures, reported above, on food produc on and exports. The growth in total food produc on
has been even more impressive. We see from Chart 17 that food produc on has doubled from 2000 to
2013.
% Chart 17a. Index of food produc on in Russia, 1991‐2013
120
100
80
60
40
1999 2000 2005 2008 2009 2010 2011 2012 2013
Source: Rosstat
23 DECEMBER, 2014PUTIN 2000 – 2014, MIDTERM INTERIM RESULTS:
DIVERSIFICATION, MODERNIZATION AND
THE ROLE OF THE STATE IN RUSSIA’S ECONOMY
If further evidence of the success of raising the domes c food industry was needed, then that is provided by
the response of the Russian government to the hos le an ‐Russian sanc ons by imposing bans on food
imports from EU and other Western countries. Although cri cs of Russia have been tou ng year a er year
how Russia does not produce anything and is totally dependent on the West for feeding the country, the
import ban which came into effect overnight did not lead to any detectable deficiencies in food supplies,
save a rela vely slight increase in food prices, which is natural considering interrup ons in the logis c chains
and the ruble devalua on which coincided with it.
Chart 17b. Produc on of livestock and poultry, 2000‐2013
thousand
tons
9000
8000 Livestock and poultry
for slaughter
7000
including cattle
6000
5000 including pigs and
hogs
4000
including sheep
3000
2000 including poultry
1000
0
2000 2005 2008 2009 2010 2011 2012 2013
Source: Rosstat
24 DECEMBER, 2014PUTIN 2000 – 2014, MIDTERM INTERIM RESULTS:
DIVERSIFICATION, MODERNIZATION AND
THE ROLE OF THE STATE IN RUSSIA’S ECONOMY
PUBLIC SECTOR
Oil & gas and other natural resources rents, share in GDP
The flawed narra ve of cri cs claims that Russia is a renter state living exclusively out of windfall profits from
oil & gas extrac on. This claim is being backed up by the much trumpeted reference to the oil & gas exports
figure, but the cri cs are hard‐pressed to come up with any other arguments to sustain their claim. Contrary
to the widespread legend, the share of oil & gas and other natural resources (natural resources rents) in the
Russian economy has actually drama cally decreased over the years from 2000 to 2012. According to World
Bank data the share of natural resources rents in GDP (the sum of oil rents, natural gas rents, coal rents,
mineral rents, and forest rents) more than halved between 2000 to 2012 from 44.5% to 18.7%. The actual
share of oil & gas (net of other natural resources rents) was 16%. – This sure looks like diversifica on to us.
Russia's total tax rate as % of GDP is among developed economies
The conten on that Russia runs a bloated state sector is disproved by the fact that Russia's total tax rate (the
sum total of all taxes collected measured as a percentage of the GDP) is excep onally low compared with
other developed countries (Chart 18). While Russia's total tax rate was 29.5%, the countries with developed
Eurosocialism, like Finland, Sweden and France, had a total tax rate of 45%. This means that the Russian
government imposes significantly less taxes on its ci zen and corpora ons than the Western countries. It is
our firm opinion that this is the most important parameter for considering economic freedom and the extent
of state involvement in the economy. This is especially true for Russia considering its record low 13% flat tax
on personal income, which leaves the discre onary power over spending with the individuals.
Chart 18. Total tax rate, % of GDP
50
45
40
35
30
25
20
15 Total tax rate,
% of GDP net oil
10 of oil & gas
5
0
Brazil
Sweden
Japan
Finland
Poland
US
France
Canada
Russia
Rep. of Korea
Australia
China
Norway
Italy
Germany
UK
Russia, non oil
Total tax rate, % of GPD
Source: 2014 Index of Economic Freedom, Heritage Fouda on
25 DECEMBER, 2014You can also read