Q1 MANAGEMENT STATEMENT - FCE Bank plc For the quarter ended 31 March 2021 - Ford Credit Europe
←
→
Page content transcription
If your browser does not render page correctly, please read the page content below
FCE Bank plc
Q1 MANAGEMENT STATEMENT
For the quarter ended 31 March 2021
Highlights (unaudited)

This management statement is based on unaudited preliminary data. Final data will be included in FCE’s 2021 Annual Report.
Management Statement
Key financial data (unaudited) Q1 2021 Q1 2020
Quarterly income statement data (Mils) (Mils)
Net interest income £ 108 £ 125
Net fees and commiss ions income 9 13
Other operating income 59 59
Total income £ 176 £ 197
Allowance for expected credit losses £ 0 £ (39)
Operating expens es £ (64) £ (75)
Depreciation on property and equipment (57) (62)
Fair value adjustments to financial instruments and
gain or loss on foreign exchange 6 (14)
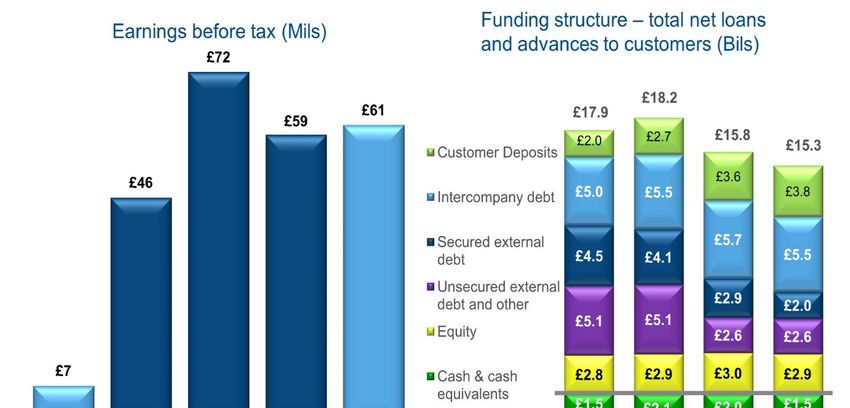
Profit before tax £ 61 £ 7
Asset data
Net loans and advances to customers £ 15,252 £ 18,232
Total assets 17,638 21,513
Average net loans and advances for the quarter 15,500 17,890
Regulatory capital data
Common equity tier 1 (CET1) capital £ 2,845 £ 2,788
Own funds / Total capital 3,171 3,129
Common equity tier 1 (CET1) capital ratio 20.0% 16.4%
Total capital ratio 22.3% 18.5%
Business Highlights
As a consequence of the on-going COVID-19 pandemic that factors which include changes in receivables levels and
continues to impact European markets, and also the global execution and maturity of capital market transactions. At 31
semiconductor shortage, Ford’s vehicle sales and production March 2021, total liquidity sources were £4.6 billion of which
continue to be below pre-COVID-19 levels. As a result, FCE £3.8 billion were available for use.
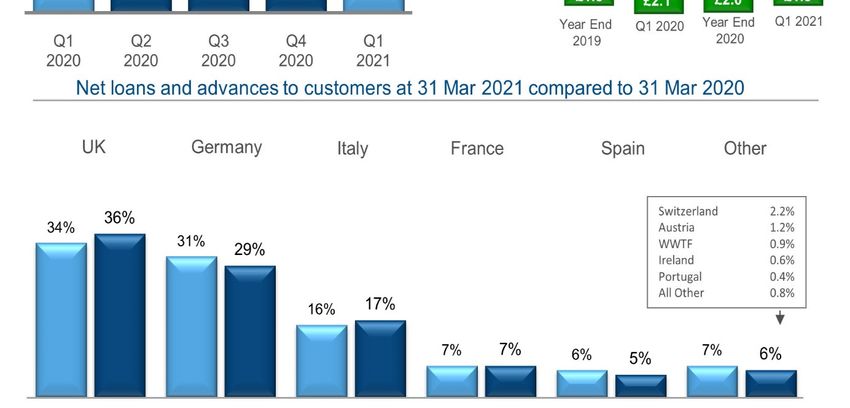
Bank plc’s (FCE’s) ‘Net loans and advances to customers’
reduced to £15 billion, £3 billion lower than Q1 2020. In April 2021, FCE paid a dividend of £300 million, which
equates to 48.83 pence per ordinary share, to its shareholder.
In Q1 2021, FCE recorded earnings before tax of £61 million, This dividend payment is consistent with FCE's plan to align
£54 million higher than Q1 2020. The improvement is its capital base with the current scale of its business.
explained primarily by non-recurrence of the first quarter 2020
increase to the credit loss reserve, partially offset by reduced At 31 March 2021, FCE's long term debt credit
interest income reflecting lower loans and advances. ratings/outlooks were Ba2/Stable with Moody’s (changed from
Ba2/Negative), BBB-/Negative with S&P (unchanged) and
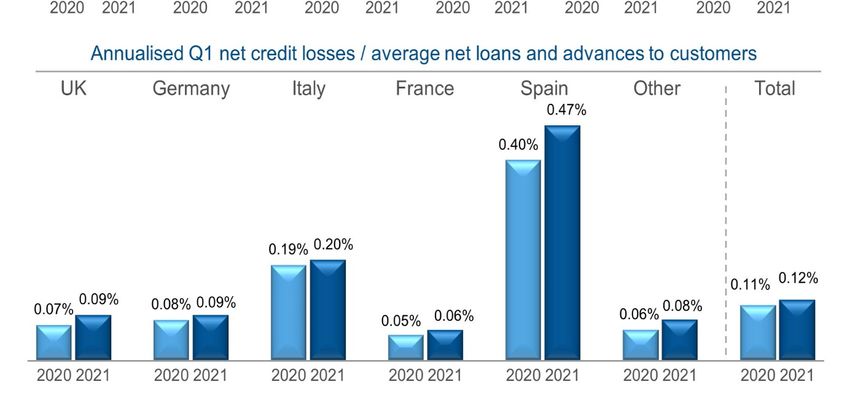
FCE’s credit loss reserves are aligned with its expectation that BB+/Negative with Fitch (unchanged).
credit losses will trend higher as payment holidays and similar
support provided to customers expire. Full Year Outlook
Funding and Liquidity FCE expects to be solidly profitable in 2021. However, our
future results depend on the further developments of the
Our funding strategy remains focused on diversification, and COVID-19 pandemic, its impact on economic conditions and
we plan to continue accessing a variety of markets, channels, potential further reductions in vehicle production, as a result of
and investors, including government-sponsored funding semiconductor shortages.
programs. These diverse sources of liquidity will provide FCE
with flexibility to adapt its plans as the impact of COVID-19 on From 1 April 2021, FCE has transferred operations to a new
investor behaviours and pricing continues to evolve. finance company in Italy and a new Austrian branch of Ford
Bank GmbH as the final elements of its Brexit contingency
As at 31 March 2021, customer deposits represented a total plans.
of £3.8 billion of funding, which includes both the UK Deposit,
and the growing German Deposit programs. FCE’s sources of
liquidity include cash and cash equivalents, committed
unsecured credit facilities, committed securitisation capacity
and assets eligible as collateral in ECB monetary policy
transactions. Liquidity available for use will fluctuate based onManagement Statement
Public Term
2021 2021
Funding Plan
YTD 2020 2019
Forecast Actual* Actual Actual
(Bils) (Bils) (Bils) (Bils)
- Unsecured Debt £ - - £ - £ -
- Securitisation 0.4 - 0.8 0.4 - 1.1
Total £ 0.4 - 0.8 £ 0.4 £ - £ 1.1
* includes transac tions settled up to and including 28 April 2021
Mar Dec Mar
2021 2020 2020
Liquidity Sources (Bils) (Bils) (Bils)
Cash and cash equivalents £ 1.5 £ 2.0 £ 2.1
Committed unsecured credit facilities 1.1 1.1 1.0
Central Bank Eligible Assets* 0.1 0.1 -
Committed securitisation capacity 1.9 2.0 2.5
Total Liquidity Sources £ 4.6 £ 5.2 £ 5.6
Utilisation of Liquidity
Cash not available for use in FCE's day-to-day operations** £ (0.3) £ (0.3) £ (0.3)
Committed unsecured credit facilities (0.1) (0.1) (0.1)
Committed securitisation capacity (0.1) (1.1) (1.8)
Total Utilisation of Liquidity £ (0.5) £ (1.5) £ (2.2)
Gross Liquidity £ 4.1 £ 3.7 £ 3.4
Securitisation capacity in excess of eligible receivables £ (0.3) £ (0.4) £ (0.1)
Liquidity Available for Use £ 3.8 £ 3.3 £ 3.3
* Central Bank eligible assets exc ludes FCE's acc ess to the Bank of England's Disc ount Window Facility
** Cash not available for use in day to day operations which primarily inc ludes cash associated with securitisation
transac tionsYou can also read