R 5 - Mercati, infrastrutture, sistemi di pagamento - Banca d'Italia
←
→
Page content transcription
If your browser does not render page correctly, please read the page content below
Mercati, infrastrutture, sistemi di pagamento
           (Markets, Infrastructures, Payment Systems)

           The carbon footprint
           of the Target Instant Payment Settlement (TIPS) system:
           a comparative analysis with Bitcoin and other infrastructures

           by Pietro Tiberi
May 2021

                                                                     5
                                                            Number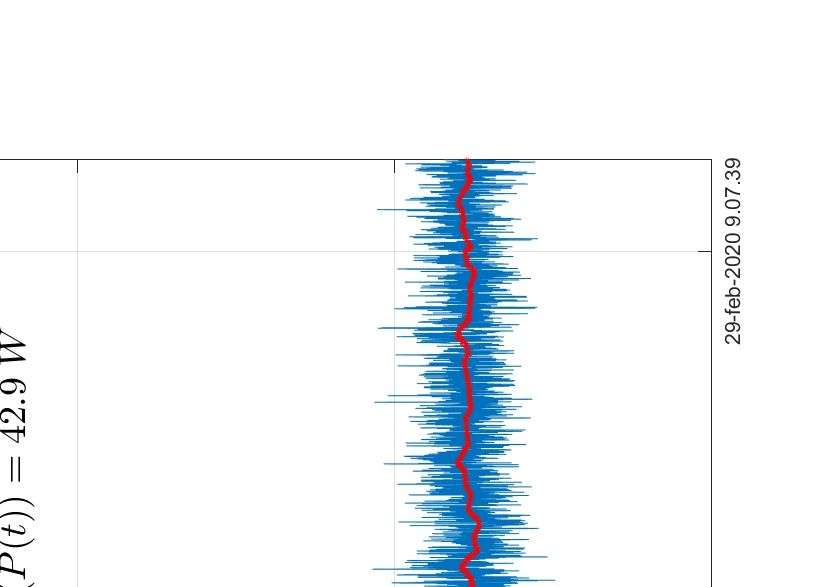
Mercati, infrastrutture, sistemi di pagamento
(Markets, Infrastructures, Payment Systems)

Approfondimenti
(Research Papers)

The carbon footprint
of the Target Instant Payment Settlement (TIPS) system:
a comparative analysis with Bitcoin and other infrastructures

by Pietro Tiberi

Number 5 – May 2021
The papers published in the ‘Markets, Infrastructures, Payment Systems’ series provide
information and analysis on aspects regarding the institutional duties of the Bank of
Italy in relation to the monitoring of financial markets and payment systems and the
development and management of the corresponding infrastructures in order to foster
a better understanding of these issues and stimulate discussion among institutions,
economic actors and citizens.
The views expressed in the papers are those of the authors and do not necessarily reflect
those of the Bank of Italy.
The series is available online at www.bancaditalia.it.
Printed copies can be requested from the Paolo Baffi Library:
richieste.pubblicazioni@bancaditalia.it.

Editorial Board: Stefano Siviero, Livio Tornetta, Giuseppe Zingrillo, Guerino Ardizzi,
Paolo Libri, Cristina Mastropasqua, Onofrio Panzarino, Tiziana Pietraforte, Antonio
Sparacino.
Secretariat: Alessandra Rollo.

ISSN 2724-6418 (online)
ISSN 2724-640X (print)

Banca d’Italia
Via Nazionale, 91 - 00184 Rome - Italy
+39 06 47921
Designed by the Printing and Publishing Division of the Bank of Italy
The carbon footprint
       of the Target Instant Payment Settlement (TIPS) system:
                 a comparative analysis with Bitcoin
                                     and other infrastructures

                                                 by Pietro Tiberi*

                                                    Abstract
Reducing the environmental impact of human activities has become a strategic objective of
governments, institutions, companies and individuals. In this paper, we estimate the CO2 equivalent
emissions of the TARGET Instant Payment Settlement (TIPS) system and compare it with that of
Bitcoin and other infrastructures.
The TIPS carbon footprint in 2019 was almost 40,000 times smaller than that of Bitcoin; the difference
is only partially accounted for by the lower overall volume of TIPS transactions, as the marginal
increase in emissions per additional transaction is very small: the difference would therefore persist
even if TIPS worked at full steam. The huge discrepancy in the carbon footprints of TIPS and Bitcoin
stems from the fact that the latter uses a large amount of energy to generate trust and consensus among
Bitcoin network participants, whereas in the case of TIPS this trust is provided by the Eurosystem.
The comparison is then extended, using publicly available data, to other infrastructures. The
over-performance of TIPS, while less marked than in the case of Bitcoin, remains nevertheless
considerable.

Keywords: TIPS, Carbon footprint, Bitcoin.

                                                     Sintesi
La riduzione dell’impatto ambientale delle attività umane è oggi un obiettivo strategico di governi,
istituzioni, aziende e individui. In questo articolo viene presentata una stima delle emissioni di CO2
equivalente del sistema TARGET Instant Payment Settlement (TIPS), che viene poi confrontata con
quella di Bitcoin e altre infrastrutture.

L’impronta di carbonio di TIPS nel 2019 è stata quasi 40.000 volte inferiore a quella di Bitcoin; la
differenza è solo in piccola parte spiegata dal minor volume complessivo di transazioni di TIPS,
in quanto l’incremento marginale delle emissioni per transazione aggiuntiva è molto contenuto:
pertanto, anche se TIPS lavorasse a pieno ritmo, questa differenza rimarrebbe pressoché invariata.
L’enorme discrepanza nell’impronta di carbonio di TIPS e Bitcoin deriva dal fatto che quest’ultimo
utilizza una notevole quantità di energia al fine di generare fiducia e consenso tra i partecipanti alla
rete, mentre nel caso di TIPS questa fiducia è fornita dall’Eurosistema.

Il confronto viene poi esteso, utilizzando le fonti pubbliche disponibili, anche ad altre infrastrutture.
Le prestazioni di TIPS, per quanto meno pronunciate che nel caso del confronto con Bitcoin,
rimangono purtuttavia sensibilmente più elevate.

*
    Bank of Italy, ITC Operations Directorate.
CONTENTS 1. Introduction 7 2. Methods 8 3. Results 10 4. Discussion 12 5. Conclusions 14 References 16
1   Introduction1
    The term carbon footprint (Thomas and Jan 2007) is a well-established concept commonly un-
    derstood as the carbon equivalent emissions and effects related to a product or service during its
    whole life cycle.2 The carbon footprint, its magnitude and the development trends are important
    matters to investigate for any sector due to the growing concern of global warming (Malmodin and
    Lundén 2018).
        To calculate the impact of ICT (Information and Communication Technology) services on C O 2 e
    emissions, there are several approaches that, in a first approximation, can be divided into two
    categories: bottom-up and top-down (Intellect 2012).
        The bottom-up approach tends to work at a granular level, examining individual characteristics
    of a product or service in detail, often using life cycle assessment (LCA).3 When applied to ICT, the
    assumption is that the results of these individual LCAs can theoretically be multiplied or aggregated
    to give a meaningful idea of the cumulative impact of lots of devices, networks or services, and that
    this in turn can provide an estimation of the impact of ICT sector as a whole.
        A top-down approach starts with the collected data at a corporate, industry or network level
    and then applies assumptions and modelling techniques to extrapolate the total energy usage and
    estimates the embodied carbon.
        In this study a bottom-up approach is used to calculate the carbon footprint of TIPS system
    (Renzetti et al. 2021, Arcese, Di Giulio and Lasorella 2018) in terms of C O 2 e 4 emissions by referring
    to the GHG (Greenhouse gases)5 protocol framework published by GeSI.6 The ICT Sector Guidance
    (The Carbon Trust 2017) provides guidance and accounting methods for the calculation of GHG
    emissions for ICT products with a focus on ICT services .
        The carbon footprint thus calculated is then compared with the one of the payment system
    based on the use of the Bitcoin cryptocurrency (Nakamoto 2018). The energy consumption values
    (kW h) and the amount of C O 2 emissions (k g C O 2 e) of the Bitcoin system used in this paper are
    published in various scientific studies (Stoll, KlaBeen and Gallersdörfer 2018, Köhler and Pizzol
    2019, Stoll, KlaBeen and Gallersdörfer 2019) and by the University of Cambridge that provides
    online data on the annual electricity consumption by the Bitcoin system (University of Cambridge
    2020).

       1. I would like to thank Silvio Orsini, Giampiero Longobardi, Alessio Manzo, Alessandra Rollo , Giuseppe Zingrillo and
    Stefano Siviero for revising the article and for their useful comments. Special thanks to Fabrizio Lucarini for the technical
    support and data collection. The views expressed in the paper are solely those of the author and do not necessarily represent
    those of the Bank of Italy.
       2. The carbon footprint is a parameter that is used to estimate the greenhouse gas emissions caused by a product, a ser-
    vice, an organization, an event or an individual, generally expressed in tons of C O 2 e equivalent (Ministero della Transizione
    Ecologica 2020) taking as reference for all greenhouse gases the effect associated with CO2.
       3. LCA, or Life Cycle Assessment, (sometimes called life cycle analysis) looks at the environmental impacts made by, say,
    a product over its whole life, usually broken into different stages, such as raw material extraction, manufacture, distribution,
    use and end-of-life (Intellect 2012, Guinée et al. 2011).
       4. Carbon dioxide equivalent (C O 2 e) is used to provide a common figure for measuring the impact of different green-
    house gases. It is determined by multiplying the mass of a given greenhouse gas by its global warming potential (GWP).
    GWP is a factor describing the radiative forcing impact of 1 kilogram of a given greenhouse gas relative to a kilogram of
    carbon dioxide over a given period of time.
       5. Greenhouse gases are those gaseous constituents of the atmosphere, both natural and anthropogenic, that absorb
    and emit radiation at specific wave-lengths within the spectrum of thermal infrared radiation emitted by the Earth’s surface,
    the atmosphere itself, and by clouds. This property causes the greenhouse effect.
       6. The Global Enabling Sustainability Initiative (GeSI) is a leading source of impartial information, resources and best
    practices for achieving integrated social and environmental sustainability through ICT. In GeSI there is a collaboration with
    members from major Information and Communication Technology companies and organisations around the globe, (GeSI
    2020).

                                                                   7
1 Measure or estimate the power consumption
2
Measure or estimate the use profile
3 Calculate the energy used
4 Allocate overhead energy
5 Convert energy used into CO2 emissions
Figure 1. The carbon footprint calculation steps for an ICT system (The Carbon Trust 2017)
2 Methods
The LCA method requires the calculation of emission impact for the entire life cycle of the individual
components used to create the ICT system, whose value has to be considered. For what concerns
TIPS, the energy used for the production of servers, for its transportation and installation, for its
usage and disposal at the end of its useful life should therefore be considered (Guinée et al. 2011,
The Carbon Trust 2017).
However for many ICT goods and services like TIPS, the use stage dominates the total emis-
sions(The Carbon Trust 2017). Usage stage emissions are primarily caused by the ICT hardware’s
use of electricity (The Carbon Trust 2017). As shown in the Figure 1, 5 steps are necessary in order
to calculate the amount of emissions in terms of k g C O 2 . The first step is to measure the amount
of electricity E 1 used by all the systems needed to provide the TIPS service for one year. The ICT
devices used by TIPS are hosted in datacenters operated by Banca d’Italia and all devices are
installed in racks located inside modular islands for which the measurement of the instantaneous
power P (t ) absorbed by the single rack is available.
N ∫
Õ
E1 = Pi (t )d t (1)
i =1 one y e ar
The total amount of energy used by TIPS over a year E 1 is given by (1) where Pi (t ) is the
instantaneous power absorbed by the single rack i and N is the number of racks where TIPS
equipment are installed.
Considering that the power absorbed by the single rack, in the observation period, is not very
variable around its average value, it can be approximated with the average Pi (see Figure 3); the
equation (1), expressed in kW h , becomes:
N
!
Õ
E1 ' Pi × 365 × 24 kW h (2)
i =1
The second step of the methodology involves the usage profile calculation of the service over
8Transformer High Density POD
Total Input Chiller pPUE
Power Power for Zone 1
Chiller
Total IT
Power for Zone 1
IT Equipments
UPS
Other IT Equiments
Total IT
Power for Zone 1
IT Equipments
Chiller
PUE Power for Zone N
Chiller
Datacenter
Figure 2. PUE calculation reference environment (The Green Grid 2012)
time U (t ) 7 by users. Since TIPS service is available to users over a 24-hour period for the whole
year without scheduled maintenance windows, it can be considered always on and therefore:
U (t ) = 1 (3)
Considering the use profile (3) step 3 of the methodology can be completed by calculating the
energy used by TIPS which is:
E 2 = E 1U (t ) = E 1 (4)
To complete step 4 it is necessary to consider the overhead energy necessary to keep the
devices in optimal operating conditions and datacenter operations. The parameter that provides
this indication is the PUE8 which is defined as (Sharma, Arunachalam and Sharma 2015, The Green
Grid 2012):
T ot al F aci l i t y E ner g y
PUE = (5)
IT E qui pment E ner g y
Using (5) and knowing the amount of energy used by IT equipment (E 2 ) is possible to calculate
the total energy (E 3 ) required in step 4 of the methodology as:
E3 = E2 × P U E (6)
The calculation of the P U E must be done continuously for the derivation of a significant aver-
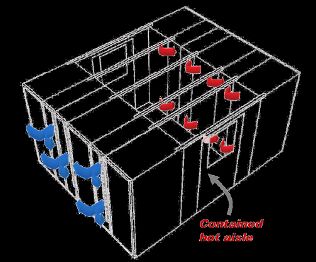
age value. TIPS systems are installed inside high density pods (PODS) which provide continuous
measurement of instantaneous electric power consumption. The PODS are closed rooms, equipped
with their own conditioning and are installed in the datecenter according to the diagram reported
in Figure 2.
7. The function U (t ) takes values in the range [0, 1] in which the extreme values 0 and 1 have the following meaning:
U (t ) = 0 when the service is never used while U (t ) = 1 holds when the service is always active.
8. Power Usage Effectiveness (PUE) is a measure of how efficient a data center is in using the electricity that powers it
(The Green Grid 2012). It is a parameter that gives a figure of how much electrical power is dedicated to the power supply
of IT equipment compared to auxiliary services such as air conditioning or UPS losses.
9Table 1. Average,Min,Max and Std.Dev of the instantaneous power Pi (t ) measured in Watt absorbed by the
individual racks over the observation period.
Rack Id. P (t ) [W ] min P (t ) [W ] max P (t ) [W ] σ [W ]
R ack 1 3,375 3,236 3,565 42.9
R ack 2 3,885 3,776 4,033 33.8
R ack 3 3,925 3,834 4,081 27.3
R ack 4 3,463 3,332 3,742 46.9
According to The Green Grid 2012, the measured P U E value, in our case, is actually a partial
P U E (pP U E ). The average pP U E in the case of TIPS is 1.46 and does not take into account the
energy losses of the UPS system and the Transformer. The UPS devices available on the market
typically have efficiency greater than 90%. As a precaution an overall impact of 10% of energy losses
is considered and therefore a value of 1.60 for the pP U E is assumed. The equation (6) becomes:
E 3 = E 2 × pP U E = E 2 × 1.6 (7)
To complete the calculation and obtain the TIPS carbon footprint, it is necessary to convert the
energy used into k g C O 2 e emitted. This conversion can be carried out with the C O 2 e emission by
electricity generation 9 parameter which is specific to each country and depends on the methods
used to produce electricity. As TIPS systems are installed in Italy, more precisely in Banca d’Italia’s
datacenters, the most recent italian value of this parameter published by Istituto Superiore per la
Protezione e la Ricerca Ambientale (ISPRA 2019) which is 316 g C O 2 e/kW h is to be used.
So the formula to obtain the yearly carbon footprint of TIPS (C FT I P S ) is:
C FT I P S = E 3 × (C O 2 E mi ssi ons b y el ect r i ci t y g ener at i on) I t al y (8)
where C FT I P S is measured in k g C O 2 e emitted per year. Combining (8) and (7) the formula to
evaluate the TIPS carbon footprint is obtained:
C FT I P S = 0.316 × E 3 ' 0.506 × E 2 k g C O 2 e (9)
3 Results
The monitoring system of the PODS in which the racks that house the TIPS devices are located
detects the electricity consumption in terms of instantaneous power P (t ) every 5 seconds.
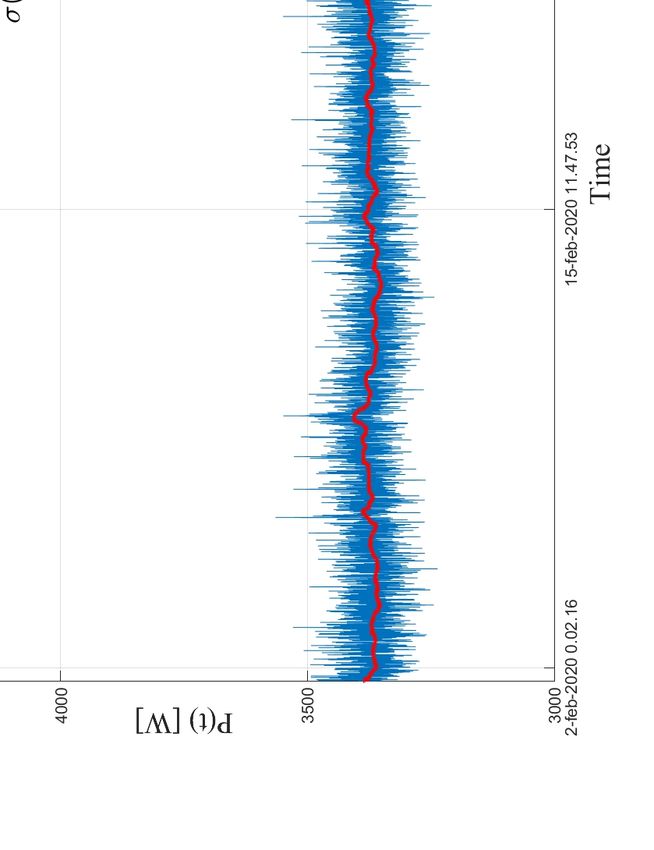
Figure 3 shows the measurement values for the period February 1 2020 - March 2 2020 of one rack.
It can be easily seen that P (t ) oscillates slightly around a constant average value. In Table 1 the
minimum, maximum, average and standard deviation σ (P (t )) of the measured values for each
rack are reported. The moving average, calculated using a sliding window of 120 samples, is almost
constant (red curve in Figure 3) and the standard deviation (σ in Figure 3 and Table 1) is very limited
and oscillates in the range 27.3 - 46.9 W (0.7 - 1.4 % of the average value).
This means that the average value P (t ) can be used as a significant indicator for electricity
consumption in the observation period.
Applying (2) and (4) the following value for TIPS total energy E 2 can be derived:
E 2 ' (3, 375 + 3, 885 + 3, 925 + 3, 463) × 365 × 24 ' 128, 317 MW h/y e ar (10)
9. The emission factors are reported in g C O 2 e/kW h excluding the electricity produced from pumped storage units
using water that has previously been pumped uphill, as requested by Directive 2009/28/EC of the European Parliament,
based on the values published in Italy by Istituto Superiore per la Protezione e la Ricerca Ambientale (ISPRA 2019).
10Figure 3. TIPS Instantaneous power consumption from 01 February 2020 to 02 March 2020 for R ack 1 . The
moving average (red line) is computed using a sliding 10 minutes window (120 values)
Applying (9) and (7) and using the total measured total energy E 3 the following value for the
total C O 2 e emissions of TIPS in the year 2019 can be obtained:
k g C O2
C FT I P S 2019 = 128, 317 kW h × 0.506 = 64, 928.4 k g C O 2 (11)
kW h
The value C FT I P S 2019 calculated in (11) indicates the absolute emissions of C O 2 caused by the set
UT I P S of all the devices necessary for the operation of TIPS. The UT I P S set contains the network
equipment, storage/SAN devices and compute servers used to create the Development, Certification
and Production environments.
Defining NT I P S 2019 the number of settlement transactions managed by TIPS in the year 2019
the average amount of C O 2 e emissions per single transaction can be derived:
C FT I P S 2019 64, 928.4
C FTTIrPx S 2019 = ' g C O 2 = 8.43 · 102 g C O 2 (12)
NT I P S 2019 77, 000
The adoption of the TIPS service by the European banking community is gradual and therefore the
value NT I P S 2019 is much lower than the number NT I P S N or mal of annual transactions for which the
system has been sized.10
A more accurate estimation of the environmental impact per transaction of TIPS is obtained by
measuring the electricity consumption under normal load conditions (NT I P S N or mal ). This measure
is possible because in the certification environment (CERT) , which is specular to the production
(PROD) environment, is possible to inject payment orders at a variable rate of up to 2000 transactions
10. The TIPS system is currently sized to handle an average volume of 500 transactions per second which corresponds
to NT I P S N or mal = 15.7 × 10⁹ transactions per year. In addition, the system is currently able to absorb traffic peaks of 2000
transactions per second (European Central Bank 2018).
11Table 2. Average instantaneous power P (t ) [W ] , absolute carbon footprint C F [k g C O 2 ], total transactions
N and C O 2 e emissions per transaction (C F T r x [g C O 2 ]) measured for TIPS in different trx/s scenarios: (A)
TIPS in 2019; (B) Bitcoin in 2018; (C) Mature instant payments market (e.g. Sweden); (D) TIPS under normal
load conditions.
trx/sec. P (t ) C FT I P S NT I P S C FTTIrPx S
(A) TIPS in 2019 0.0025 14,648 64,928.4 7.70 · 104 8.43 · 102
(B) Bitcoin in 2018 4 14,994 66,461.8 1.26 · 108 0.53
(C) Mature instant payments market 100 15,078 66,834.1 3.15 · 109 21.21 · 10−3
(D) TIPS under normal load conditions 500 15,201 67,379.4 15.7 · 109 4.29 · 10−3
per second and therefore, for a given time interval, the load and the total energy consumption of
the TIPS system under different load profiles can be reproduced.
In Table 2 the values measured in CERT environment in four different traffic scenarios are
reported : (A) TIPS in 2019; (B) Bitcoin in 2018; (C) Mature instant payments market (e.g. Sweden);
(D) TIPS under normal load conditions. It is useful to remember how the calculation of the absorbed
power is always estimated considering the totality of the test (TEST), certification (CERT) and
Production (PROD) systems therefore the power consumption measurements detected injecting
payments in CERT are undoubtedly an excellent estimation of the actual consumption that would
have the same production volumes.
As it can be clearly seen from the measurements in Table 2, the average values of the instantan-
eous power P (t ) cumulated for the four Racks increases slightly with the increase of the number
of transactions and the increase between the two extreme cases is of about 553 W which corres-
pond to a growth rate of about 4% compared to an increase of a factor 2 × 10⁵ in the number of
transactions per second.
A good estimation of the C O 2 e emissions per TIPS transaction is therefore given by:
C FT I P S N or mal 67, 379.4
C FTTIrPx S N or mal = ' k g C O 2 = 4.29 · 10−3 g C O 2 (13)
NT I P S N or mal 15.7 · 109
4 Discussion
The results obtained allow to have a clear idea on the environmental impact of TIPS both in ab-
solute terms (C FT I P S ) and per single transaction (C FTTIrPx S ). Similar data are also available for
other payment systems such as those based on the Bitcoin cryptocurrency (Stoll, KlaBeen and
Gallersdörfer 2019, Köhler and Pizzol 2019, University of Cambridge 2020).
The Cambridge Bitcoin Electricity Consumption Index (CBECI) provides a real-time estimate of
the total electricity load and consumption of the Bitcoin network. Given that the exact electricity
consumption cannot be determined, the CBECI provides a range of possibilities consisting of a
lower bound (floor) and an upper bound (ceiling) estimate. Within the boundaries of this range, a
best-guess estimate is calculated to provide a more realistic figure that comes closest to Bitcoin’s
real annual electricity consumption (University of Cambridge 2020).
The method followed to calculate the CBECI index is of the bottom up type and basically follows
steps 1-4 of Figure 1 but, as it cannot have direct measurements of the electricity consumption of all
the devices of the Bitcoin network, it is based on a model that estimates the energy consumption.
The following equation is used:
ÍN
1 θi
E est i mat ed = × H × P U E × 3.16 · 107 (14)
N
12ÍN
θ J
where 1N i is the average energy efficiency of profitable bitcoin hardware ( hash ), H is the hashrate
7
( s ) and 3.16 · 10 is the number of seconds in a year. The PUE value used in this formula is equal
hash
to 1.10 and is significantly lower than that typical of a normal datacenter (in our case PUE = 1.6)11 .
CEBCI index estimates an average electricity consumption value for 2018 equal to around 42
TWh. This value is in good agreement with what is estimated by Stoll, KlaBeen and Gallersdörfer
2018 which calculate, for the same year, a consumption of 48.2 TW for entire the Bitcoin network. In
2019, article Stoll, KlaBeen and Gallersdörfer 2019 reviews the values provided by Stoll, KlaBeen and
Gallersdörfer 2018 and calculates the total annual electricity consumption of the bitcoin network
in 45.8 TWh.
In Stoll, KlaBeen and Gallersdörfer 2019, step 5 of the method described in Figure 1 is also
completed. The geographical location of all the Bitcoin servers is taken into consideration and the
corresponding conversion factors between kW h and k g C O 2 e are applied to obtain the following
value for the total C O 2 e emissions in 2018:
22.0 × 10⁹ k g C O 2 < C F Bi t coi n 2019 < 22.9 × 10⁹ k g C O 2 (15)
By comparing (11) with (15) the ratio between the C O 2 e emissions of Bitcoin (year 2018) and
TIPS (year 2019)12 can be calculated:
C FBi t coi n 2018 22 × 109 k g C O 2
RCF = = ' 3.39 × 10⁵ (16)
C FT I P S 2019 6.49 × 10⁴ k g C O 2
The R C F value calculated in (16) indicates how the impact, in absolute terms, on the C O 2 e emis-
sions of the TIPS system is absolutely negligible compared to the amount of C O 2 e emitted by the
Bitcoin network in 2018.
The number of transactions made using Bitcoins is public and is available online. Using the data
provided by Blockchain.com 2020 it is possible to calculate the total number of Bitcoin transactions
made in the year 2018 (N Bi t coi n 2018 ).
N Bi t coi n 2018 is equal to13 0.82 × 10⁸ and therefore the C O 2 e emissions per single transaction for
the year 2018 can be calculated:
C F Bi t coi n 2018 22 × 1012 g C O 2
Trx
C F Bi t coi n 2018 = ' ' 2.68 × 10⁵ g C O 2 (17)
N Bi t coi n 2018 0.82 × 10⁸
By comparing (12) with (17) the ratio between the C O 2 e emissions of Bitcoin (year 2018) and TIPS
(year 2019) can be calculated:
Trx
C FBi 2.68 · 105 g C O 2
' 3.18 × 10²
t coi n 2018
RCFT rx = = (18)
C FTTIrPx S 2019 8.43 · 102 g C O 2
To make a more reliable comparison the data in Table 2 relating to an annual TIPS traffic
(NT I P S 'Bi t coi n ) of the order of 108 transactions (Footnote (b) of Table 2) which is comparable with
the volumes of Bitcoin transactions in the year 2018 should be considered:
Trx
C FBi 2.68 · 105 g C O 2
' 5.05 × 10⁵
t coi n 2018
RCFT rx = = (19)
C FTTIrPx S 'Bi t coi n 0.53 g C O 2
11. According to University of Cambridge 2020 and Stoll, KlaBeen and Gallersdörfer 2019 mining facilities generally have
significantly lower PUE than traditional data centres. The Uptime Institute estimated an average PUE for 2019 equal to 1.67
for general purpose datacenters (Uptime Institute 2019).
12. TIPS has been released into production 30 November 2018 so there is not enough data for 2018.
13. This number is an estimate obtained by multiplying by 365 the average number of daily transactions which in 2018
was equal to 223,450.
13Table 3. C O 2 e emissions per transaction(Leopold and Englessson 2017) (C F T r x [g C O 2 ]) and comparison
with TIPS (R TC rFx calculated using C FTTIrPx S derived by (13)) for Ether, USD Dollar on VISA network and
N or mal
Ripple (XRP)
Currency CFTrx R TC rFx
Ether (ETH) 9.07 × 10³ 2.1 × 10⁶
VISA (USD) 3.6 8.3 × 10²
Ripple (XRP) 6.03 × 10⁻³ 1.40
On the basis of what has been obtained in (19), it is clear that the environmental impact of TIPS
for each transaction is also negligible compared to that of a transaction carried out on the Bitcoin
network.
Bitcoin is the most studied cryptocurrency and not many works have been published on the
other currencies regarding environmental impact assessment. However, in Leopold and Englessson
2017 a comparison of the carbon footprint of Bitcoin (BTC), Ether (ETH),14 Ripple (XRP) 15 and US
dollar on the VISA circuit is presented.
The comparison with these systems is particularly interesting because Ethereum is the reference
platform for smart contracts (Buterin 2014), Ripple is the wholesale settlement system that is
establishing itself for cross-currency payments (Ripple 2020b) and Visa is one of the world’s leaders
in digital payments (VISA 2020).
In table 3 the values of C O 2 e emissions per single transaction (C F T r x ) of Ether, Ripple and US
Dollar on the Visa circuit (Leopold and Englessson 2017) are reported and the comparison with
TIPS using C FTTIrPx S N or mal is inserted using (13). The obtained value is reported in Table 3 and it is
just a rough estimate of the order of magnitude of R TC rFx because the comparison is made between
systems managing very different total amount of transactions per year.
However, it can be observed that systems such as Ether based on permissionless public block-
chains have low energy efficiency while systems based on private blockchains (permissioned) and
which are limited only to the validation of transactions using a reduced number of nodes such as
Ripple have an environmental impact comparable to that of TIPS.
The comparison with VISA seems to indicate the greater energy efficiency of the TIPS application;
it must also be taken into account that the VISA network, in addition to offering value-added services
compared to the settlement service, is operational on 4 datacenters hosting thousands of servers
(VISA 2018).
5 Conclusions
Analyzing the results obtained, it is evident that the environmental impact of TIPS is drastically
lower than that of the Bitcoin network. This result is not surprising because of the peer to peer
nature of Bitcoin and its promise to solve the so-called double-spending problem16 with distributed
ledger technology.
In the Bitcoin network, in the absence of a currency universally recognized and guaranteed
by an entity such as the European Central Bank, there is a need to build a distributed community
14. Ether (ETH) is the cryptocurrency generated by the Ethereum protocol (Buterin 2014) is presented. Unlike Bitcoin,
Ethereum operates using accounts and balances according to the so-called state transitions, which are not based on un-
spent transaction outputs (UTXOs), but on the current balances (called states) of all accounts, as well as to some additional
data. Status information is not stored in the blockchain, but is stored in its own binary tree.
15. Ripple is a real-time gross settlement system, currency exchange and remittance network (Ripple 2020a). XRP is the
native currency of the Ripple network.
16. This refers to the incidence of an individual spending a balance of that cryptocurrency more than once, effectively
creating a disparity between the spending record and the amount of that cryptocurrency available, as well as the way that
it is distributed.
14and generate a shared consensus among all participants in the network. The construction of the
consensus is based on a Proof of Work which is based on the use of processing power and therefore
electricity.
Most of the energy is therefore dissipated to generate trust among all the Bitcoin network parti-
cipants. In the case of TIPS, this trust is provided by the European Central Bank which guarantees
every transaction made in euros.
Furthermore, the results of Table 2 clearly show how TIPS electricity consumption grows very
slowly with the increase in the number of transactions leading to obtaining a C O 2 e emission value
per single transaction of 4.29 × 10⁻³ g C O 2 e if we consider the traffic of 500 payments per second
for which the current system has been sized.
The comparison with the 2.68 × 10⁵ g C O 2 e emitted by the Bitcoin network to validate a single
transaction in 2018 makes the reduced environmental impact of the TIPS system even more evident.
The excellent energy efficiency of TIPS is also confirmed by the comparison with the energy
consumption per single transaction of other currencies shown in Table 3.
15References
Arcese, M., V. Di Giulio and V. Lasorella. 2018. “Real-Time Gross Settlement systems: breaking the wall of
scalability and high availability”. Markets, Infrastructures, Payment Systems, nos. 2021-2.
Blockchain.com. 2020. “Bitcoin online data”, https://www.blockchain.com/.
Buterin, V. 2014. “A Next-Generation Cryptocurrency and Decentralized Application Platform”. Bitcoin Magazine.
European Central Bank. 2018. “The Target Instant Payment Settlement system”, https://www.ecb.europa.
eu/paym/target/tips/html/index.en.html.
GeSI. 2020. “GeSI member list”. gesi.org, https://gesi.org/public/members.
Guinée, J. B., R. Heijungs, G. Huppes, A. Zamagni, P. Masoni, R. Buonamici, T. Ekvall and T. Rydberg. 2011.
“Life Cycle Assessment: Past, Present, and Future”. Environmental Science & Technology 45 (1): 90–96.
https://doi.org/10.1021/es101316v. https://doi.org/10.1021/es101316v.
Intellect. 2012. “Evaluating the carbon impact of ICT orThe answer to life, the universe and everything”, http:
//www.greendigitalcharter.eu/evaluating-the-carbon-impact-of-ict.
ISPRA. 2019. “Greenhouse Gas Inventory 1990-2017”, http://www.isprambiente.gov.it.
Köhler, S., and M. Pizzol. 2019. “Life Cycle Assessment of Bitcoin Mining”. Environmental Science & Technology
53 (23): 13598–13606. https://doi.org/10.1021/acs.est.9b05687. https://doi.org/10.1021/acs.est.
9b05687.
Leopold, S. J., and N. Englessson. 2017. “How Eco friendly is our money and is there an alternative?”, http:
//papers.netrogenic.com/sid/eco-friendly-money.pdf.
Malmodin, J., and D. Lundén. 2018. “The Energy and Carbon Footprint of the Global ICT and EM Sectors
2010–2015”. Sustainability (August). https://doi.org/10.3390/su10093027.
Ministero della Transizione Ecologica. 2020. “Cos’è la carbon footprint”, https://www.minambiente.it/pagin
a/cose-la-carbon-footprint.
Nakamoto, S. 2018. “Bitcoin: A Peer-to-Peer Electronic Cash System”. Bitcoin.org, https://bitcoin.org/bitcoin.
pdf.
Renzetti, M., S. Bernardini, G. Marino, L. Mibelli, L. Ricciardi and G. M. Sabelli. 2021. “TIPS - TARGET Instant
Payment Settlement Il sistema europeo per il regolamento dei pagamenti istantanei”. Markets, Infra-
structures, Payment Systems, nos. 2021-01, https : / / www . bancaditalia . it / pubblicazioni / mercati -
infrastrutture-e-sistemi-di-pagamento/questioni-istituzionali/2021-001/MIS-20210129.pdf.
Ripple. 2020a. “Move Money to All Corners of the World”, https://ripple.com/xrp/.
. 2020b. “The Role of Blockchain and Digital Assets in Cross-Border Payments”, https://ripple.com/
insights/the-role-of-blockchain-and-digital-assets-in-cross-border-payments/.
Sharma, M., K. Arunachalam and D. Sharma. 2015. “Analyzing the Data Center Efficiency by Using PUE to
Make Data Centers More Energy Efficient by Reducing the Electrical Consumption and Exploring New
Strategies”. Procedia Computer Science 48 (December): 142–148. https://doi.org/10.1016/j.procs.2015.
04.163.
Stoll, C., L. KlaBeen and U. Gallersdörfer. 2018. “The Carbon Footprint of Bitcoin”. MIT CEEPR: Working Paper
Series, nos. 2018-018, 1–18. http://ceepr.mit.edu/files/papers/2018-018.pdf.
. 2019. “The Carbon Footprint of Bitcoin”. Joule 3 (7): 1647–1661.
The Carbon Trust. 2017. “ICT Sector Guidance built on the GHG Protocol Product Life Cycle Accounting and
Reporting Standard”. GeSI, 22–23. https://gesi.org/public/research/ict-sector-guidance-built-on-the-
ghg-protocol-product-life-cycle-accounting-and-reporting-standard.
16The Green Grid. 2012. “PUE, A Comprehensive Examination of the Metric”.
Thomas, W., and M. Jan. 2007. “A Definition of Carbon Footprint”. ISA-UK research report 07-01 07-01. https:
//web.archive.org/web/20081108113401/http://www.isa- research.co.uk/docs/ISA- UK_Report_07-
01_carbon_footprint.pdf.
University of Cambridge. 2020. “Cambridge Bitcoin Electricity Consumption Index”, https://www.cbeci.org/.
Uptime Institute. 2019. “2019 Annual Data Center Survey Results”, https://uptimeinstitute.com/2019-data-
center-industry-survey-results.
VISA. 2018. “Visa doubles down on global data centers”, https://usa.visa.com/visa-everywhere/innovation/
global-data-centers.html.
. 2020. “Visa Facts Sheet”, https://usa.visa.com/dam/VCOM/download/corporate/media/visanet-
technology/aboutvisafactsheet.pdf.
17You can also read