R 655 - Corporate bond financing of Italian non-financial firms by Giorgio Meucci and Fabio Parlapiano - Banca d'Italia
←
→
Page content transcription
If your browser does not render page correctly, please read the page content below
Questioni di Economia e Finanza
                (Occasional Papers)

                Corporate bond financing of Italian non-financial firms

                by Giorgio Meucci and Fabio Parlapiano
November 2021

                                                                          655
                                                                 Number
Questioni di Economia e Finanza
(Occasional Papers)

Corporate bond financing of Italian non-financial firms

by Giorgio Meucci and Fabio Parlapiano

Number 655 – November 2021

The series Occasional Papers presents studies and documents on issues pertaining to
the institutional tasks of the Bank of Italy and the Eurosystem. The Occasional Papers appear
alongside the Working Papers series which are specifically aimed at providing original contributions
to economic research.

                 The Occasional Papers include studies conducted within the Bank of Italy, sometimes
in cooperation with the Eurosystem or other institutions. The views expressed in the studies are those of
the authors and do not involve the responsibility of the institutions to which they belong.

                 The series is available online at www.bancaditalia.it .

ISSN 1972-6627 (print)
ISSN 1972-6643 (online)

Printed by the Printing and Publishing Division of the Bank of Italy
CORPORATE BOND FINANCING OF ITALIAN NON-FINANCIAL FIRMS
by Giorgio Meucci* and Fabio Parlapiano*
Abstract
This work analyses the main trends in bond financing by Italian non-financial firms and its
role in relation to bank credit across different economic phases. The first part of the analysis
refers to the 2008-2019 period, characterized by both crisis and recovery episodes, while the
second part focuses on the specific effects of the recent pandemic crisis. The corporate bond
market experienced substantial growth over the years, with an increasing number and more
diverse types of issuers tapping the market. At the same time, not all crises episodes have had
similar effects for bond financing. The 2008 and 2012 crises encouraged non-financial firms,
especially the larger ones, to use bond instruments as an alternative to (rationed) bank credit,
highlighting substitutability between market and bank-based financing channels. Instead,
during the 2020 pandemic crisis, both bond issuances and bank credit expanded at
unprecedentedly high rates, highlighting complementarities.
JEL Classification: G1, G3, G32.
Keywords: corporate bond, corporate finance.
DOI: 10.32057/0.QEF.2021.0655
Contents
1. Introduction and main findings ............................................................................................. 5
2. Trends in the corporate bond market ..................................................................................... 6
2.1 The expansion of the market and in the types of issuers ................................................. 6
2.2 Terms of financing: cost of debt, maturity and risk premiums ....................................... 9
2.3 The substitution of bank loans with bond funding ........................................................ 12
3. Corporate bond financing in Italy during the pandemic ...................................................... 12
3.1 The drop and recovery of bond issuances ..................................................................... 12
3.2 The dynamics of credit for bond issuers ........................................................................ 14
Appendix .................................................................................................................................. 18
References ................................................................................................................................ 21
_______________________________________
*
Bank of Italy, Economic Research and International Relations.1. Introduction and main findings1
This note explores the main trends in corporate bond financing by Italian non-financial companies
(NFCs) emerging over the 2008-2020 period. The analysis characterizes the changing profile in the
type of issuers, depending on their size-class and riskiness, as well as on the dynamics of the cost and
maturity of bond financing; it also investigates whether bond financing replaced loans from banks.
Moreover, we highlight developments in the Italian corporate bond market during the pandemic crisis
and study the relationship between bond and bank financing, with specific regard to the year 2020.
We exploit a large dataset, which includes both listed and privately placed securities, covering a wide
array of information on the characteristics of bond issuances (Anagrafe Titoli and Dealogic), on firms’
balance sheets (Cerved) and credit relationships (Centrale dei rischi).
The analysis shows that the corporate bond market experienced substantial growth over the recent
years. Indeed, the number of issuers and the offered amount reached an unprecedented level.
Moreover, the terms of financing, such as coupon rates and maturities, gradually eased and a greater
range of issuers tapped the market, including an increasing number of first-time issuers and riskier
firms, i.e. non-investment-grade corporates. As shown by several recent studies, such developments
were driven, among others, by: declining official rates and investors’ risk aversion; fiscal incentives
provided to unlisted issuers (so-called “minibond” regulation);2 improved liquidity conditions
ensured by the Corporate Sector Purchase Program (CSPP), implemented by the Eurosystem since
June 2016; finally, by the demand for bonds eligible within long-term individual saving plans.3
We document that credit risk premia, i.e. the coupon rate spread between risky and safe borrowers,
have declined over the considered time period for larger issuers, signaling increased investors’ risk
appetite and ample liquidity for this asset class.4 In contrast, smaller issuers, representing a more
1
We thank Paolo Angelini, Alessio de Vincenzo, Emilia Bonaccorsi di Patti, Giuseppe Cappelletti, Francesco Columba,
Giovanni Guazzarotti, Silvia Magri and Sabrina Pastorelli for the useful comments. The opinions expressed are our own
and do not necessarily reflect those of the Bank of Italy.
2 See Accornero, M. et al., (2018), Missing investors in the Italian corporate bond market, Bank of Italy Occasional
Papers n. 450; ESRB, Macroprudential policy issues arising from low interest rates and structural changes in the EU
financial system, November 2016.
3 Bond securities are eligible for purchases under the CSPP program when: issued by non-bank corporations in both the
primary and the secondary market; have a minimum first-best long-term credit rating corresponding to investment grade
(BBB-); are denominated in euro and issued by a corporation established in the euro area; the remaining maturity of the
securities ranges between 6 months and 31 years at the time of purchase. See for instance Mäkinen, T. et al., Effects of
eligibility for central bank purchases on corporate bond spreads, BIS Working Papers n. 894, October 2020, and ESRB,
Issues note on liquidity in the corporate bond and commercial paper markets, the procyclical impact of downgrades and
implications for asset managers and insurers, May 2020.
4
Accordingly, major financial institutions have warned against this trend at the global level. See International Monetary
Fund, Global financial stability report, October 2019.
5heterogeneous group of firms, did not record such trend appetite and ample liquidity for this asset
class.5 In contrast, smaller issuers, representing a more heterogeneous group of firms, did not record
such trend.
Corporate issuers generally replaced bank loans with bond financing during crises periods. Larger
and riskier borrowers substituted a significant share of bank loans with bonds and reduced their bank
dependence (the proportion of bank credit to total assets) relatively more than highly rated issuers.
While the access to market-based finance contributed positively to diversify firms’ source of funding,
it also strengthened their financial structure by reducing their overall indebtedness level.
Nonetheless, not all crises episodes had similar consequences on firms’ financing patterns. The
recent experience of the pandemic crises shows that bank loans, made widely available by public
guarantee schemes, have expanded greatly along with bond financing and compensated most of firms’
liquidity needs. Debt security issuance rose substantially for large and financially sound NFCs also
thanks to the monetary policy support provided by the pandemic emergency purchase programme
(PEPP).
In our assessment, the Covid-19 shock had short-lived effects on the Italian corporate bond
market. Following monetary and fiscal responses from the public sector, large non-financial firms
were able to refinance the majority of bonds coming due in 2020. Nevertheless, for smaller and riskier
issuers the access to market financing appears to have become more difficult. After the initial spike
in bond yields, the average financing terms (cost and maturity) stabilized to slightly tighter levels
than the pre-Covid period.
2. Trends in the corporate bond market
2.1 The expansion of the market and in the types of issuers
Despite a traditionally limited role for bond financing in Italian firms’ financial structure, the
bond market has been gaining prominence as a source of funding for NFCs at least since 2014. During
the 2008-2013 period, characterized by two crises episodes in the years 2007-08 and 2012, the
average ratio of bond debt to total financial debt amounted to just 7.6 per cent (Figure 1), below the
euro area average (9.7 per cent), and significantly less than in countries with more advanced capital
5
Accordingly, major financial institutions have warned against this trend at the global level. See International Monetary
Fund, Global financial stability report, October 2019.
6markets such as France (17.1 per cent) and the UK (22.8 per cent).6 During the 2014-19 period,
characterized by economic recovery, the bond market strengthened its role in funding Italian NFCs.
Indeed, the share of bonds to total financial debt grew substantially, up to a level (12.1 per cent) above
the euro area average (11.6 per cent), especially with respect to Germany (10.3) and Spain (8.4),
though still below the level reached in the most developed financial markets.7
Figure 1: Bonds to financial debt ratio
(per cent)
25
20
15
10
5
0
Italy France Germany Spain Euro Area UK
2008-13 2014-19
Source: Bank of Italy, Financial accounts.
The expansion of the bond market, which accelerated decisively since 2014, is reflected in the
positive dynamics in both the number of issuers and the amount offered. The number of firms that
tapped the bond market grew steadily, to about 250 issuers in 2019 (Figure 2). First-time issuers also
increased their participation in the market, accounting for more than 55 per cent of the total number
of issuers. Similarly, the value of gross offerings increased over the years; the annual issued volume
has been above EUR 30 billion since 2014 and reached a peak in 2017 and 2019, with a nominal
amount of about EUR 48 billion.
6 Source: Bank of Italy, Financial accounts.
7
Previous research documented a significant advance in the Italian capital markets as a whole. During the 2014-19 period,
both bonds and equity offerings increased at a marked pace (See: Caselli, S. et al., The Italian Corporate Bond Market:
What is Happening to the Capital Structure of Italian Non-financial Companies?, Baffi Carefin, Università Bocconi,
2019; Finaldi Russo, P. et al., Firms’ listings: what is new? Italy versus the main European stock exchanges, Bank of
Italy Occasional Papers, N. 555, 2020.
7Figure 2: Issued amount and number of issuers
(EUR billion; units)
60.00 300
50.00 250
40.00 200
30.00 150
20.00 100
10.00 50
- 0
2008 2009 2010 2011 2012 2013 2014 2015 2016 2017 2018 2019
Amount Number of issuers Number of new issuers
Source: Our elaboration on the Bank of Italy’s securities database (Anagrafe Titoli) and Dealogic.
Note: Gross amount of bond offerings (blue bar – left-hand scale), number of issuers (yellow line – right-hand scale),
number of first-time issuers (orange line – right-hand scale).
The size class of corporate bond issuers did not change substantially over the years. However, the
proportion of Small and Medium Enterprises (SMEs) involved in bond financing was larger until
2013; interestingly, starting with 2014, their share declined from 60 to about 50 per cent (Figure 3).
Figure 3: Type of bond issuers
Panel A- The size of bond issuers Panel B - The riskiness of bond issues
(per cent) (per cent)
100% 100%
90% 90%
80% 80%
70% 70%
60% 60%
50% 50%
40% 40%
30% 30%
20% 20%
10% 10%
0% 0%
2008 - 13 2014 - 19 2008 - 13 2014 - 19 2008 - 13 2014 - 19 2008 - 13 2014 - 19
all issuers first-time issuers all issuers first-time issuers
SME Large Sound Solvent Vulnerable Risky
Source: Our elaboration on the Bank of Italy’s securities database (Anagrafe Titoli), Dealogic and Cerved Group data.
Note: Panel A - The figure displays the proportion of issuers by size class, with SMEs having total assets or revenues
less than 43 mln and 50 mln, respectively. Panel B - The figure displays the proportion of corporate bonds issued
amounts by risk class, comparing first-time corporate bond issuers to the entire pool of corporate bond issuers. We
compute risk classes starting with credit risk scores from Cerved Group and binning observations as follows1-2 for
sound firms, 3-4 for solvent, 5-6 for vulnerable and greater than 7 for risky. First-time issuers are those firms that had
not issued bond previously.
8The risk profile of bond issuers, including first-time issuers, gradually increased over the years.
Using credit risk scores from Cerved, we decompose NFCs’ bond offerings by issuers’ risk class,
with investment grades including issuers deemed as sound or solvent, and high-yields including
vulnerable and risky issuers (Figure 3). The large majority (about 76 per cent in the recovery period)
of corporate bonds belong to the high-yield class, with vulnerable issuers by far the most prevalent
class (about 66 per cent in the recovery period). The risk distribution of the pool of bond issuances
also became more polarized over the entire period, with an increase of both tails of the distribution:
the risky and investment-grade firms.
2.2 Terms of financing: cost of debt, maturity and risk premiums
Amid declining government yields,8 funding conditions for NFCs in the bond market also
improved. The average cost of debt declined notably, with a strong acceleration since the onset of the
CSPP program (De Santis et al., 2018). Over the 2008-2019 period, the subset of fixed-rate securities,
which accounts for about 60 per cent of the amount issued yearly, recorded a twofold drop in the
average coupon rate (Figure 4). At the same time, the average maturity of new offerings lengthened
Figure 4: The cost and maturity of bond issues
(per cent)
Source: Our elaboration on the Bank of Italy’s securities database (Anagrafe Titoli), Dealogic and Cerved Group data.
Note: The figure displays the weighted (by volume) average coupon rate and maturity of bond securities issued in the
two time periods.
8
Between 2008 and 2019, the 10-year Italian Government bond yield recorded a drop from about 4.5 to about 0.5 per
cent.
9to about eight years, a trend that is also consistent with other main Euro area countries.9
The maturity of the majority of bond issuances is above 5 years (Figure 5). In the 2014-19 period,
such proportion increased even further from 50 to 60 per cent, allowing borrowers to secure a medium
to long-term funding source. This is potentially due to the easing in the terms of financing, i.e. an
increased investors’ risk appetite, which provided an incentive for borrowers to offer securities that
mature in the longer run. In addition, first-time corporate bond issuers, which account for about 10
per cent of the average yearly issued amounts, were able to place a larger proportion of medium to
long-term bonds, thus contributing to the lengthening of the average maturity.
Figure 5: Distribution of bond issues by maturity buckets
(per cent)
100%
90%
80%
70%
60%
50%
40%
30%
20%
10%
0%
2008 - 13 2014 - 19 2008 - 13 2014 - 19
all issuers first-time issuers
very short short medium long
Source: Our elaboration on the Bank of Italy’s securities database (Anagrafe Titoli) and Dealogic.
Note: The figure displays the proportion of corporate bonds issued amounts by maturity buckets defined as follows: less
than 3 years (very short), between 3 and 5 years (short), between 5 and 10 years (medium), and more than 10 years
(long).
The credit risk premium, i.e. the spread paid by risky versus sound issuers to raise funds on the
bond market, has declined globally since the financial crisis. Several financial institutions have
warned against the risks of an excessive compression of such premium. A growing number of low
credit quality borrowers tapped the bond market due to the incentive provided by low interest rates
and investors’ greater willingness to hold riskier assets.10 In this section, we explore whether the
9
Since 2016 the maturities of newly issued CSPP-eligible bonds has lengthened in all major euro area countries. In
contrast, non-eligible securities have not shown a similar increase in residual maturities. (See: De Santis, R. et al., The
impact of the corporate sector purchase programme on corporate bond markets and the financing of euro area non-
financial corporations, ECB Economic Bulletin, Issue 3, 2018).
10
Bond spreads were unduly low by historical standards reflecting primarily strong investor risk appetite. Misalignments
are relatively large in the United States and moderate in Europe. See: International Monetary Fund, Global financial
stability report, October 2019 and Çelik, S. et al., Corporate Bond Markets in a Time of Unconventional Monetary Policy,
OECD Capital Market Series, Paris, 2019.
10pricing of corporate bonds in the Italian market has followed a similar trend, using a subset of euro-
denominated fixed-rate securities for which we have information about the coupon rate; this sample
represents, however, a significant proportion of the total issued amount (60 per cent).
In Italy, consistent with the global trend, we document an easing in financing, namely a drop in
the risk premium and a lengthening in the average bond maturity. By focusing on the average,
however, one overlooks the difference in larger vs smaller issues’ trends. The coupon rate spread
between high-yield and investment-grade issues decreased for large tranches (tranches with size
above the median tranche amount of about EUR 6 million; Figure 6 - Panel A) over the two periods.
In contrast, we document an increase in the average spread for the smaller tranches by about 80 basis
points, mostly associated with SME issuers. At the same time, the maturity of larger tranches
lengthened, while for the smaller ones the average maturity shortened (Figure 6 - Panel B). We may
rationalize this finding with the higher liquidity that characterizes larger tranches, making their
offering more appealing for a broader set of less risk-averse investors. We can instead explain the
different and increasing trend in coupon rates for smaller issuances with the differences in bond
issuers. Indeed, these tranches were issued mainly by SMEs whose risk profile is more heterogeneous
and includes riskier issuers than the larger ones.
Figure 6: Coupon and maturity: Investment grade versus high yield spread
Panel A: Panel B:
high yield – investment grade high yield – investment grade
coupon rate spread maturity spread
(per cent) (years)
0.90 0.40
0.80 0.20
0.70 -
0.60
Maturity spread
-0.20
Coupon spread
0.50
-0.40
0.40
-0.60
0.30
-0.80
0.20
0.10 -1.00
- -1.20
2008-13 2014-19 2008-13 2014-19
Coupon rate spread: Tranches < 50° percentile Maturity spread: Tranches < 50° percentile
Coupon rate spread: Tranches > 50° percentile Maturity spread: Tranches > 50° percentile
Source: Our elaboration on the Bank of Italy’s securities database (Anagrafe Titoli), Dealogic and Cerved Group
data. Note: Panel A displays the average coupon rate spread between high yield (below BBB-) and investment-grade
corporate bonds. We weight coupon rates by the amount issued and compute risk classes using credit risk scores from
Cerved Group. Panel B displays the average maturity spread between high yield (below BBB-) and investment-grade
corporate bonds. We weight maturity by the amount issued and again use Cerved score-based risk classes.
112.3 The substitution of bank loans with bond funding
The financial structure of Italian firms, typically tilted towards bank credit, was affected by the
expansion in bond financing over the 2008-2019 period. The growth in the amount and number of
issuers contributed to a reduction of firms’ dependence on banks, a development prompted by the
financial crises that hit the banking system in 2008 and 2012. At the same time, the access to such
alternative financing source brought to a strengthening in firms’ overall financial structure.
3. Corporate bond financing in Italy during the pandemic
3.1 The drop and recovery of bond issuances
The financial turmoil in March 2020, triggered by the Covid-19 shock, led to acute stress in key
European funding markets. A dash-for-cash followed the demand for safe assets (flight-to-quality);
relatedly, money market funds and corporate bond funds recorded significant outflows.11 The
corporate bond market became illiquid and the cost of issuing bonds increased markedly, especially
for high-yield corporates (Figure 7 and Table A3), resulting in increased difficulties for corporates to
Figure 7: The European corporate bond market
Panel A: Yields Panel B: Volumes in 2020
(per cent) (billion)
7 20
18
6
16
5
14
4 12
3 10
8
2
6
1
4
- 2
4Q19 1Q20 2Q20 3Q20 4Q20 1Q21 2Q21*
-
Jan Feb Mar Apr May Jun Jul Aug Sep Oct Nov Dec
Europe senior BB-rated Bonds Europe senior B-rated Bonds
Note: A) LCD by S&P Global Market Intelligence. New-issue yields for BB and B rated bond securities; B) LCD by
S&P Global Market Intelligence. Issuance of corporate bonds by European firms.
raise funds. In June 2020, following central banks’ unprecedented policy actions,12 financial market
conditions gradually normalized, bond financing recovered, and yields stabilized, though at levels
higher than before the start of the crisis.
11
Financial stability board, Holistic Review of the March Market Turmoil, 17 November 2020.
12
Policy actions alleviated market stress through different tools: asset purchases liquidity operations and backstop
facilities designed to provide targeted liquidity to specific financial entities (e.g. money market funds and primary
12The dynamics of bond issuances in Italy were similar to those of the broader European market.
The offered amount and the number of issuers contracted drastically in March 2020 and next
eventually rebounded, exceeding pre-crisis levels in the following months (Figure 8). Overall,
between March and December, 220 firms raised about EUR 42 billion worth of bonds, an amount
almost 25 per cent higher than the 2017-2019 average for the same period.
Figure 8: Number of issuers and amount raised by Italian firms
(million, units)
8000 70
7000 60
6000
50
5000
40
4000
30
3000
20
2000
1000 10
0 0
Jan Feb Mar Apr May Jun Jul Aug Sep Oct Nov Dec
amount 2020
avg. amount 2017-19
number of firms 2020 (right axis)
avg. number of firms 2017-19 (right axis)
Source: Anagrafe Titoli and Dealogic.
Note: Number of issuers and amount of bonds placed by Italian non-financial firms, including foreign subsidiaries.
The number of issuers in April ’20 equals the average number of issuers in the 2017-19 period.
The recovery in bond financing involved mostly investment-grade13 issuers, while riskier firms
faced greater challenges in placing bond securities. Investment-grade bond offerings accounted for
more than two-thirds of the overall amount issued in 2020, against an average of about one third in
the previous three years (see Table A1). The dynamics of bond financing were heterogeneous also
across sectors: on the one hand, manufacturing firms reduced their gross offerings; on the other,
Telecom and Transports firms were among the most active issuers (Table A2).
While volumes largely recovered after March 2020, financing conditions remained tight, reflecting
the slowdown in economic activity and the increased uncertainty over corporate creditworthiness. For
dealers). While in the Eurozone corporate bond purchases targeted investment grade securities only, in the US the program
also included high yield bond ETFs, which had operational advantages relative to buying a heterogeneous portfolio of
underlying bonds. Overall, purchases of risky assets supported markets indirectly by lowering risk premiums, which
helped increase risk appetite further.
13
The rating grades of corporate issuers is assigned using Cerved credit risk score: scores above 4 correspond to
investment grade issuers.
13the subset of fixed-rate bond securities14 the average coupon rate since March was higher by about
40 basis points with respect to its historical average; furthermore, the maturity got more than 24
months shorter (Figure 9). Such worsening in the average financing terms is not explained by the
change in the composition of issuers. The share of risky corporates decreased after the pandemic and,
more importantly, the evidence is unchanged when using a closed sample of issuers and controlling
for firm’s rating (see Table A3).15
Figure 9: Coupon rate and maturity of bonds
(percent; years)
Source: Anagrafe Titoli and Dealogic.
Note: Weighted average coupon rate for May ’19 to February ’20 (pre-Covid) and March to December ’20 (Covid).
We computed the average for euro-denominated fixed-rate securities with maturity greater than 12 months.
3.2 The dynamics of credit for bond issuers
In this section, we investigate whether bond issuers complemented their market-based financing
with bank loans or whether bond issuance substituted banks’ funding during the pandemic crisis.
During the Sub-prime and Sovereign debt crises, weakened banks’ balance sheets and poor asset
quality caused a restriction in bank credit, and NFCs used debt security financing as a substitute
14
Which covers more than 60 per cent of euro-denominated issuance by Italian firms.
15
Using a closed sample of about 57 issuers that placed bonds both in the pre- and Covid period, we computed the average
cost of financing and maturity of securities issued by both investment grade and high yield sub-groups. Results confirms
the increase of coupon rates and the decrease in maturities within each risk class; this trend is more pronounced for high-
yield issuers.
14channel (Altavilla et al., 2019)16. The pandemic crisis, on the contrary, caused severe scarcity of
liquidity in the corporate sector, which was largely compensated through bank loans.17 The loan
guarantee schemes enacted by the government to prevent waves of corporate insolvencies helped
maintaining favorable financing conditions. The growth rate of bank loans has been significantly high
(about 8 per cent), especially if compared with the previous 2009 and 2012-13 crises episodes when
the supply of credit decreased.18 As shown in Section 3.1, once market conditions recovered following
central bank interventions, large and sound firms also accessed the bond market to meet their liquidity
needs.
At the aggregate level, we can derive from Credit Register data evidence on the complementarity
between debt security issuance and the supply of bank loans during the pandemic. The supply of bank
credit to bond issuers between March and December 2020 has been large and sustained, even when
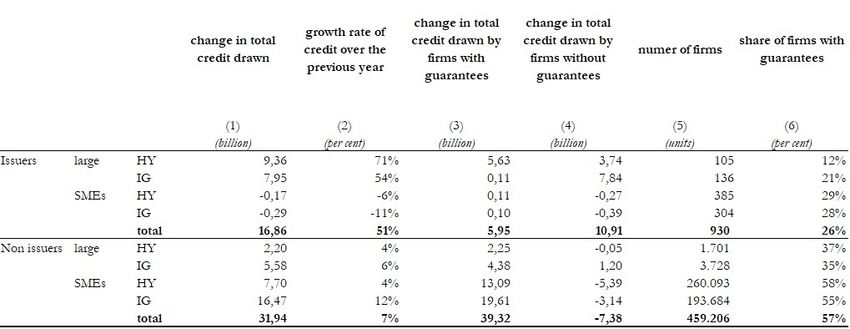
compared to other NFCs’ (Table 1: columns 1 and 2). Credit to bond issuers grew at a rate of 51 per
cent (7 per cent for the other NFCs)19 and it accounted for about one fourth of all credit to NFCs (17
out of 49 billion). Large issuers increased both their bond and bank financing; in contrast, SMEs
issuers partially reduced their lending from banks (see Tables 2 and A4).
Table 1: Bank Credit to bond issuers
Source: Credit Register, Cerved, Medio Credit Centrale, Sace.
Note: Amount of disbursed loans between March and December 2020 based on the Credit Register data for the sample
of firms in Cerved. We recovered information about firms’ size class using Cerved data, while information about
guaranteed loans comes from SACE and MCC-Medio Credito Centrale.
16
Altavilla, C., Darracq Pariès, M., Nicoletti, G., (2019), Loan supply, credit markets and the euro area financial crisis,
Journal of Banking & Finance, Volume 109, 2019, 105658.
17
See the box ‘The impact of the pandemic on the riskiness of firms’, in Financial Stability Report, 2, 2020.
18
See ‘Financial support measures and lending to firms during the pandemic’, in Chapter 7, Annual Report for 2020.
19
In the same period in 2019, bond issuers increased their borrowings by about 2 per cent while non-issuers maintained
a substantially stable level of indebtedness.
15Large issuers were able to expand their borrowings irrespectively of the provision of guarantees,
while SMEs where able to increase their lending from banks only by using guarantees. Indeed, bond
issuers benefited relatively less (both in terms of amounts and number of firms, columns 3 and 6)
than other NFCs from publicly backed loans; this result is robust even when controlling for firms’
size.
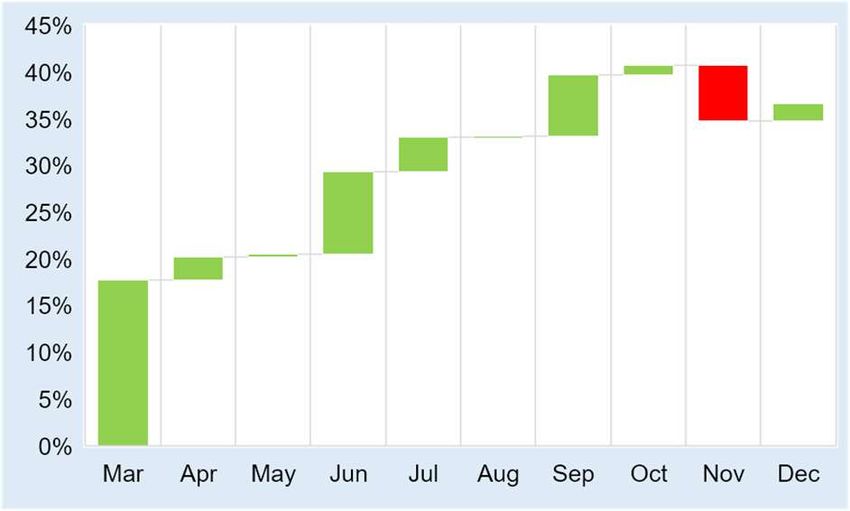
We shed further light on the relation between bank and bond financing during the pandemic by
decomposing the cumulative growth rate of credit to NFCs between March and December 2020 at a
monthly frequency. As Figure 10 indicates, most of the increase in credit to bond issuers (accounting
for more than 70 percent of the cumulative increase) took place in March, presumably prompted by
the temporary halt of market-based financing at the onset of the pandemic. Interestingly, bank credit
remained high even in the following months, when bond financing jumped back. This suggests that,
once markets recovered, credit and bonds complemented each other. In contrast, the credit dynamics
displayed by non-issuers looks more aligned with the timing of the government guarantee schemes,
with most of the credit flowing in May, following the introduction of the government-sponsored
guarantee schemes with decrees ‘Cura Italia’ and ‘Liquidità’.
Figure 10: Cumulative growth rate of credit
(a) bond issuers (b) other non-financial firms
Source: Centrale dei Rischi, Anagrafe Titoli and Dealogic.
Note: Monthly growth rate of credit to bond issuers and other non-financial firms.
The credit dynamics for bond issuers from April to December – under restored normal market
conditions – can be attributed, first, to the actual liquidity shortfalls resulting from the Covid-19 shock
and, second, to the precautionary hoarding of cash reserves (due to a high level of uncertainty about
future economic prospects). To assess the relative strength of these two motives, we match the
information on estimated individual firms’ liquidity needs resulting from the pandemic with their
16borrowing from banks.20 We can analyze 170 out of 220 issuers (liquidity shortfall projections for
holding companies are not available). We find that only 21 firms out of the 170 that issued bonds
after the pandemic outbreak were estimated to have a liquidity shortfall. These firms are mainly SMEs
and account for a small share of the overall amount of credit extended to bond issuers in 2020. Overall,
this evidence suggests that the liquidity needs related to the Covid-19 shock were not the primary
driver of bond issuers financing choices during the pandemic and that the liquidity hoarding motive
played an important role.
20
We use non-financial firms’ liquidity shortfalls resulting from the pandemic calculated as in Note Covid-19, Gli effetti
della pandemia sul fabbisogno di liquidità, sul bilancio e sulla rischiosità delle imprese, by De Socio, A., Narizzano, S.,
Orlando, T., Parlapiano, F., Rodano, G., Sette, E., e Viggiano, G., 13 November 2020. Only for 70 out of 230 issuers we
were able to retrieve their projected liquidity position at the end of 2020.
17Appendix
Table A1: Bond issuance by firm risk
Panel A: Investment grade
amount issuers coupon rate maturity
years
(billion) (number) (per cent) (years)
2020 28 93 1,7 8,3
2017-19 12 84 1,8 8,2
Panel B: High yield
2020 16 140 2,0 7,6
2017-19 30 156 2,4 8,2
Source: Anagrafe Titoli and Dealogic.
Note: Number of issuers and amount of bonds placed by Italian non-financial firms, including foreign subsidiaries. For
the period 2017-19, average values are reported.
18Table A2: Bond issuance by sector
Panel A: 2020
amount issuers coupon rate maturity
sector
(billion) (number) (per cent) (years)
Agriculture 0.0 2 3.5 1.0
Trade 1.7 23 3.0 7.0
Construction 0.9 13 5.0 5.7
Energas 21.7 22 1.0 9.1
Real estate 0.1 10 11.2 1.5
Manufacturing 6.9 72 2.1 7.2
Services 3.8 84 4.1 5.7
Telecom 3.5 4 1.8 6.9
Transports 7.9 11 2.1 8.1
Panel B: 2017-19
Agriculture 0.0 2 3.3 5.4
Trade 0.5 21 3.5 8.4
Construction 1.1 10 5.5 10.4
Energas 20.2 14 1.4 8.3
Real estate 0.8 14 3.6 6.6
Manufacturing 8.1 89 2.3 8.3
Services 4.0 80 4.6 6.3
Telecom 2.0 5 2.9 7.2
Transports 6.0 7 1.8 9.4
Source: Anagrafe Titoli and Dealogic.
Note: Number of issuers and amount of bonds placed by Italian non-financial firms, including foreign subsidiaries. For
the period 2017-19, average values are reported.
Table A3: Closed sample of bond issuers by risk class
coupon rate maturity
risk class pre-Covid Covid pre-Covid covid
high yield 1.35 2.16 10.30 7.54
investment grade 1.23 1.33 9.23 8.99
total 1.30 1.76 9.83 8.24
Source: Anagrafe Titoli and Dealogic.
Note: Average coupon and maturity for a closed sample of about 57 issuers that placed bonds both in the pre- (May ’19 –
February ‘20) and Covid (March – December ‘20) periods.
19Table A4: Bond issuance by firm size
Panel A: Large
amount issuers coupon rate maturity
years
(billion) (number) (per cent) (years)
2020 43.6 149 1.7 8.0
2017-19 42.1 153 2.3 8.1
Panel B: SMEs
2020 0.4 147 3.2 6.1
2017-19 0.7 149 5.5 5.5
Source: Anagrafe Titoli and Dealogic.
Note: Number of issuers and amount of bonds placed by Italian non-financial firms, including foreign subsidiaries. For
the period 2017-19, average values are reported.
20References
Accornero, M. et al. ‘Missing investors in the Italian corporate bond market’, Bank of Italy Occasional Papers
n. 450, 2018.
Altavilla, C., Darracq Pariès, M., Nicoletti, G., (2019), Loan supply, credit markets and the euro area financial
crisis, Journal of Banking & Finance, Volume 109, 2019, 105658.
Bank of Italy, ‘Annual Report for 2020’, 2021.
Bank of Italy, ‘Financial Stability Report 2’, 2020.
Caselli, S. et al., ‘The Italian Corporate Bond Market: What is Happening to the Capital Structure of Italian
Non-financial Companies?’, Baffi Carefin, Università Bocconi, 2019.
Çelik, S. et al., ‘Corporate Bond Markets in a Time of Unconventional Monetary Policy’, OECD Capital
Market Series, Paris, 2019.
De Santis, R. et al., ‘The impact of the corporate sector purchase programme on corporate bond markets and
the financing of euro area non-financial corporations, ECB Economic Bulletin, Issue 3, 2018.
De Socio, A., Narizzano, S., Orlando, T., Parlapiano, F., Rodano, G., Sette, E., e Viggiano, G., ‘Gli effetti
della pandemia sul fabbisogno di liquidità, sul bilancio e sulla rischiosità delle imprese’, mimeo, 2020.
ESRB, ‘Macroprudential policy issues arising from low interest rates and structural changes in the EU financial
system’, 2016.
ESRB, ‘Issues note on liquidity in the corporate bond and commercial paper markets, the procyclical impact
of downgrades and implications for asset managers and insurer’s, 2020.
Finaldi Russo, P. et al., ‘Firms’ listings: what is new? Italy versus the main European stock exchanges’, Bank
of Italy Occasional Papers, N. 555, 2020.
Financial stability board, Holistic Review of the March Market Turmoil, 17 November 2020.
International Monetary Fund, ‘Global financial stability report’, 2019.
Mäkinen, T. et al., ‘Effects of eligibility for central bank purchases on corporate bond spreads’, BIS Working
Papers n. 894, 2020.
21You can also read