Reading on the Go: An Evaluation of Three Mobile Display Technologies - Daniel Ashbrook
←
→
Page content transcription
If your browser does not render page correctly, please read the page content below
Reading on the Go: An Evaluation of Three
                Mobile Display Technologies

                    Kristin Vadas1 , Kent Lyons1 , Daniel Ashbrook1,
                       Ji Soo Yi2 , Thad Starner1 and Julie Jacko3
                                    1 College of Computing
                     2   Department of Industrial and Systems Engineering
                           3 Department of Biomedical Engineering

                                Georgia Institute of Technology
                                      Atlanta, GA 30332
                         vadas,kent,anjiro,thad @cc.gatech.edu1


                                   jyi@isye.gatech.edu2
                               julie.jacko@bme.gatech.edu3

       Abstract. As mobile technology becomes a more integral part of our everyday
       lives, understanding the impact of different displays on perceived ease of use
       and overall performance is becoming increasingly important. In this paper, we
       evaluate three mobile displays: the MicroOptical SV-3, the Sony Librié, and the
       OQO Model 01. These displays each use different underlying technologies and
       offer unique features which could impact mobile use. The OQO is a hand-held
       device that utilizes a traditional transflective liquid crystal display (LCD). The
       MicroOptical SV-3 is a head-mounted display that uses a miniature LCD and
       offers hands free use. Finally, the Librié uses a novel, low power reflective elec-
       tronic ink technology. We present a controlled 15-participant evaluation to assess
       the effectiveness of using these displays for reading while in motion.

1 Introduction
Mobile computing platforms are rapidly replacing the personal computer as the most
widely adopted computing device on the planet. Mobile phones, PDA, smartphones,
laptops, palmtops and wearables are becoming widely used: for example, in 2004 there
were 1.3 billion mobile phone subscribers, and two billion are predicted by 2007 [1].
Wireless text messaging is widespread, with predictions that soon over one trillion mes-
sages will be sent per year [13]. Despite slow initial adoption, electronic books are
becoming more popular, and some mobile phone manufacturers are working on inte-
grating head-mounted displays into their devices.
     These devices have one important thing in common: they are all used for reading
on the go. Whether the use is browsing the web on a smartphone while waiting in line,
using an electronic book to read a document on the way to a meeting, or simply trying
to find a friend’s telephone number while walking to a restaurant, the ability to read on
the go is quickly becoming an important skill.
     In this paper, we present an investigation into how three different mobile display
technologies influence the ability to read while in motion. Participants perform reading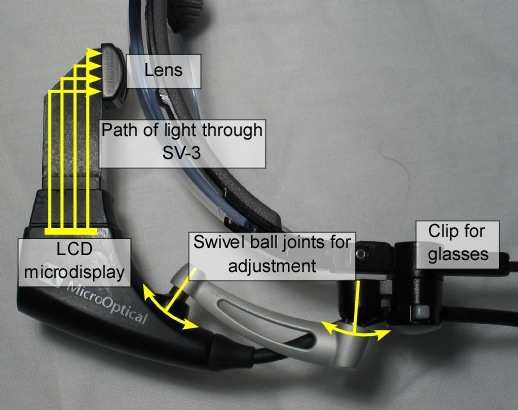
comprehension tests while moving, using a palmtop computer, an electronic ink book
reader, and a head-mounted display; to avoid confounding effects of differing input
techniques per device, we use a common input method across all of the devices. We
assess the ability of participants to read on the go, as well as the perceived workload for
each device.
2 Mobile Displays
We use three different mobile devices with different display technologies for our evalu-
ation. Two of the displays are hand-held and one is head-mounted; two are transflective
(using a backlight) and one is reflective (using ambient light). The hand-held displays
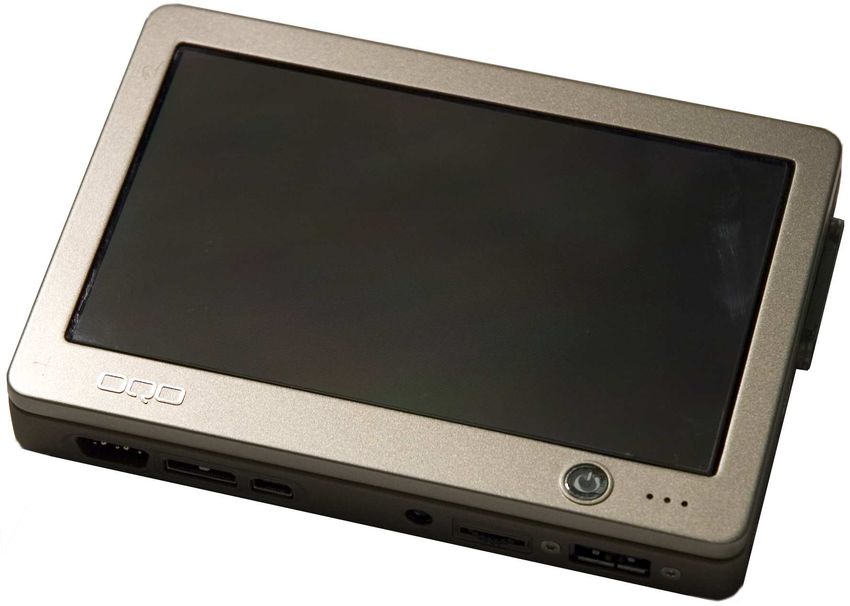
are the OQO Model 01 palmtop computer with a transflective LCD (Figure 1) and
the Sony Librié EBR-1000EP electronic book reader which uses a reflective electronic
ink display (Figure 2). The head-mounted display is the MicroOptical SV-3 Instrument
viewer, which uses a transflective LCD (Figure 3). Table 1 shows a comparison of the
weight, display size and resolution for each device.
Fig. 1. The OQO Model 01 Fig. 2. The Sony
palmtop computer. Librié e-book reader.
Weight Display Size Resolution Pixel density
Device (gm) (mm) (pixels) (dpi)
OQO Model 01 (LCD) 397 109.5x66.6 800x480 185
Sony Librié (e-ink) 190 122.23x90.5 800x600 165
MicroOptical SV-3 (LCD) 35 N/A 640x480 341
Table 1. Characteristics of devices and displays.
1 The focus of the SV-3 may be changed by the user, meaning the pixel density can change. At
a focus depth of 1.6m, the SV-3 has approximately 34dpi.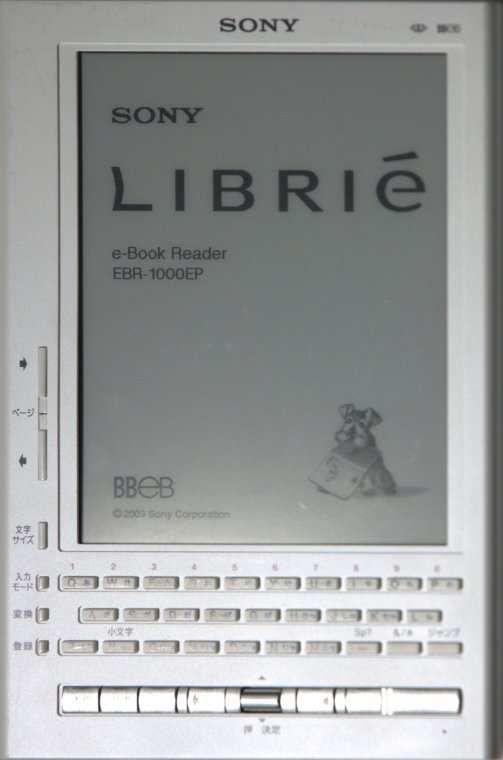
2.1 OQO Model 01 Palmtop

Typically, mobile devices can be categorized as either low–power–use, low–performance
devices, such as personal digital assistants (PDAs) and mobile phones, or as high–
power–use, high–performance devices, such as laptop and tablet computers. Recently,
however, a new category of mid-power-use, mid-performance devices has been intro-
duced: the palmtop PC. The palmtop PC is usually equivalent in performance to an
older laptop but is closer in size to a PDA. Palmtop PCs also usually have standard pro-
cessors and run desktop operating systems, such as Windows XP. We selected the OQO
Model 01 palmtop PC as one of the display devices for our study.
    The OQO Model 01 (Figure 1) is a small form-factor palmtop computer. It weighs
approximately 400g and fits comfortably in the palm of the hand. The OQO display is
a transflective TFT liquid crystal display (LCD) that measures 109.5x66.6mm and has
a resolution of 800x480, resulting in approximately 185dpi. The OQO has a Transmeta
Crusoe 1Ghz processor, 256MB memory, and a 20GB hard drive. It also has a variety
of peripheral ports including USB 1.1 host, VGA output, and Firewire. The screen on
the OQO slides to reveal a miniature QWERTY keyboard; however, during our study
the keyboard remained hidden.

2.2 Sony Librié E-book reader

Electronic book (or e-book) reader technology has yet to gain a significant consumer
market share. Detractors of e-book readers mostly attribute their lack of commercial
success to unwieldy size and weight (largely due to batteries) and hard-to-read dis-
plays (most e-book readers to date have used cheaper black-and-white LCDs such as
those found in early PDAs). In the past few years, however, E-Ink Corporation has
successfully commercialized a non-LCD display technology ideal for e-books. Called
“electronic ink” or “digital paper,” the display is reflective rather than transflective and
offers a contrast ratio close to that of standard paper. Table 2 (from [5]) compares the
reflectivity and contrast ratio of electronic ink technology to other reflective display
technologies.

                                                             White State Contrast
     Display Technology                                      Reflectance Ratio
     Transflective Mono STN LCD (older PDA with touchscreen)    4.2%       4.1
     E-Ink                                                     41.3%       11.5
     Wall Street Journal Newspaper                             64.1%        7

    Table 2. Characteristics of E-Ink displays and other reflective display technologies [5].

    Electronic ink consists of microcapsules filled with a clear fluid, black particles
and white particles. When an electrical charge is applied to a microcapsule, it causes
the black particles to move in one direction and the white to move in the other direc-
tion, producing a change in color. Once the particles move within the microcapsule, no
power is needed to keep them in place; the batteries can be removed from the device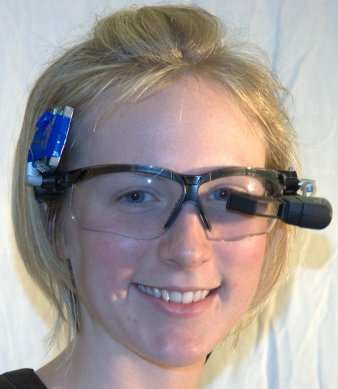
and the display contents remain unchanged. Furthermore, for static images, this tech-
nology requires no refresh cycle. The speed of update when changing between images,
however, is slow: an update takes approximately one second. Additionally, when a pixel
is changed from black to white, a grey-colored residual “ghost” image remains which
eventually needs to be cleared.
    The Sony Librié (Figure 2) is one of the first publicly-available devices to use E-
Ink’s digital paper technology. The Librié is currently only sold in Japan, and was de-
signed to be the same size and weight as a standard Japanese paperback book. The
Librié runs a version of the Linux kernel and has a greyscale display with a resolution
resolution of 800x600. We modified the Librié software to provide additional function-
ality to display images sent to it over USB from a host computer 2 .

2.3 MicroOptical SV-3 HMD

Due to its expense, the head-mounted display (HMD) is still a relatively uncommon
display technology. Although first developed in the 1960s, only recently have HMDs
become sufficiently light and low–powered to be worn on a daily basis. Head-mounted
displays are currently used by medical personnel, the military, and bridge inspectors.
In addition, HMDs are being marketed as consumer DVD -player displays targeted for
airplane use.
    The MicroOptical SV-3 is a head-mounted display (HMD) which attaches to a pair
of eye-glasses (Figure 3). It is monocular (seen by only one eye) and opaque. It contains
a very small LCD and backlight, with a 90-degree mirror and lens to direct the image
into the user’s eye (Figure 4). The lens is adjustable and can be used to change the focus
of the display from 0.6 to 4.5 meters.

                  Fig. 3. The MicroOptical
                  SV-3 head-mounted dis-     Fig. 4. Top-down view of
                  play and the head-worn     the MicroOptical SV-3 head-
                  accelerometer.             mounted display.

    The SV-3 weighs 35g and has a resolution of 640x480. The viewport of the dis-
play measures 9.5x11mm, but the dimension is not a good indicator of the viewable
2   anonymized: url to software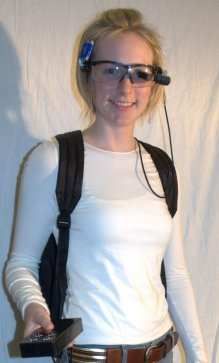
display as the lens system creates a virtual image viewable by the user. The display has
a horizontal viewing angle of 16 degrees, resulting in 40 horizontal dots per degree. For
a focus depth of 1.6m (about floor depth), the display has about 34dpi; at a focus of
0.6m (about hand-held display depth), the display has 71dpi. The SV-3 accepts a stan-
dard VGA signal as input, and a small controller box converts the signal to drive the
integrated LCD.

3 Related Work

As mobile technology becomes increasingly popular, it is important to evaluate the
impact of mobile settings on these devices. Kjeldskov and Stage examined different
usability techniques and ways to obtain results in a laboratory setting that are similar
to findings from a more naturalistic field environment [9]. Oulasvirta et al. evaluated
the use of a web browser on a mobile phone while walking in a city setting [15]. They
found that while participants were waiting for web pages to load while walking on a
busy street, their participants spent most of their time focused on their environment and
interacted with the device in approximately four second bursts.
     Reading is one fundamental task performed on mobile devices. Mustonen et al. eval-
uated legibility of text on mobile phones while walking at different speeds on a tread-
mill and while walking down an empty corridor [14]. They found visual performance
deteriorates with increased walking speed and that as subjective taskload increases,
performance declines. Studies conducted by Bernard et al. [2, 3] examined word search
and reading comprehension on a PDA while either walking on a treadmill, following a
path on the floor, and while sitting. They also examined contextual factors, in particular
lighting level. Participants rated subjective workload higher while walking on a path as
opposed to a walking on a treadmill. They also found participants read faster, had better
comprehension, and perceived less workload while sitting as compared to walking on
a path. The experimental procedure used in our study leverages the design from this
work.
     The above studies all examined various tasks on hand-held displays such as PDAs
and mobile phones. Some studies have explored the use of head-up displays in aviation
[18, 19], automobiles [6], and soldier combat [20]. There has also been work evaluating
stationary use of head-mounted displays. Curry et al. examined the use of a HMD and
a conventional desktop display for pointing tasks [4]. The pointing device, a standard
mouse, was constant across all display types. The results indicated that “the human
performance on the visual component of pointing tasks [for the HMD] is equivalent
to that of a desktop display.” Sheedy and Bergstrom compared different display types
for use in paragraph reading, word count, and word search tasks [16]. All of the tasks
were completed while stationary. The results of this study showed performance speed
for the head-mounted display was comparable to the flat panel desktop and hard copy
conditions. The monocular near-eye display and the hard copy display together showed
best performance in paragraph reading, and the HMD was second in performance to the
flat panel display for the word search tasks.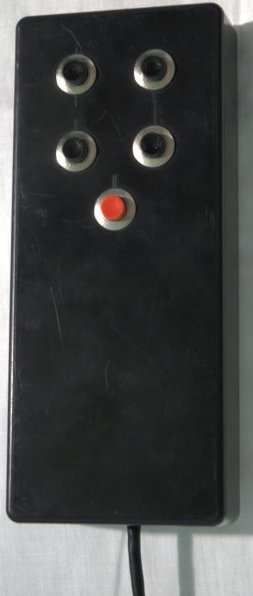
Fig. 5. An example reading passage.       Fig. 6. A multiple choice question example.

4 Method

4.1 Experimental Design

In order to test reading performance on the three devices, we designed a single-variable
within-subjects experiment with one condition per device. The conditions were: the
MicroOptical SV-3 head-mounted display, the Sony Librié e-book reader, and the OQO
Model 01 palmtop computer. Our experimental design is largely based on the studies
performed by Barnard et al. [2, 3] where participants walk a predefined path while per-
forming reading comprehension trials.
     Each participant is presented with ten reading comprehension trials. A reading com-
prehension trial consists of a short passage followed by two questions (Figure 5 and 6.
Both the passages and questions were selected to be short enough to fit on one screen
without scrolling, and were taken from a book designed to prepare high school students
for standardized tests [12] (the same source used in the Bernard et al. experiments).
     The experiment was conducted in a laboratory environment and a path was con-
structed by placing tape on the floor (Figure 7). We designed the path to be approxi-
mately 40 meters long and 30 cm wide across its entire length. The path was curvy and
required the participants to navigate around several objects: tables, a tall garbage can,
and a couch. Furthermore, the evaluation occurred in a functional computer science lab-
oratory with many visual distractions in the environment including computers, shelving
and office clutter. Both the path and positioning of obstacles remained constant across
all participants. The start of the path was marked with red tape, and at 30.5cm (1 foot)
intervals with pencil (barely visible to participants) to facilitate measuring distance.
     The direction the participants walked on the path (clockwise or counter-clockwise)
is randomized across conditions and participants. The order of the reading comprehen-
sion trials and the distribution of the passages across conditions is also randomized for
each participant to prevent any effects ordering or variable trial difficulty may have on
performance and workload measures.
Fig. 8. The keypad used
Fig. 7. The path particpants walked along. for input.
4.2 Equipment and Software
The OQO serves as the base platform for the experiment. Our custom experimental
software, written in Java, presents the reading comprehension passages and questions
and performs all of the data collection. The OQO is also used to drive the Librié and
MicroOptical displays.
During each condition, the participants wear a backpack and safety goggles and
carry a custom keypad. The participant also carries (or in the HMD condition wears)
the display for the current condition. The backpack contains the unused displays; this
technique ensures that the participant carries the same amount of weight in each con-
dition. Safety glasses are used for mounting the head-mounted display, but are also
worn in the non-HMD conditions. Figures 9, 10, and 11 illustrate the apparatus for each
condition.
The custom keypad used for input has five buttons (Figure 8). Four buttons are black
and correspond spatially to answers in the reading comprehension task, and one button
is red and conceptually corresponds to a “Done” or “Next Screen” key (Figure 6). We
chose to use a separate keypad for input because we are interested in studying mobile
displays; by standardizing on this input device across the conditions, we have attempted
to remove input as a source of influence.
For all three devices, we controlled for the number of pixels used on the display.
Regardless of the actual resolution of the screen, our software utilizes only 640x480
pixels. Any extra pixels are rendered white, and the text is centered on the screen. In
normal use as an e-book reader, the Librié is held in portrait orientation (so its resolution
is 600x800); we have participants hold it in landscape orientation (800x600).Fig. 9. The OQO Fig. 10. The Librié Fig. 11. The SV-3
hand-held condition. hand-held condition. HMD condition.
The Librié is attached to the OQO with a USB cable. Since we did not have a direct
method for writing to the screen, we devised software which pushes images from our
experimental software over USB to the Librié. In the head-mounted display condition,
the MicroOptical is attached to the OQO by a VGA cable.
To collect motion and orientation data, we utilize several wireless Bluetooth three-
axis accelerometers. An accelerometer is strapped to each ankle. Additionally, an ac-
celerometer was velcroed to the back of the hand-held displays, and an accelerometer
was attached to the safety glasses on the side opposite of the dominant eye (Figure 3).
Data from the accelerometers is sent directly to the OQO through Bluetooth and logged
in a time-stamped file.
4.3 Procedure
The experiment begins for each participant with a brief description of the experiment,
an introduction to the NASA Task Load Index (TLX) questionnaires, and a short back-
ground survey. Once the paperwork is complete, the participant performs a simple eye-
dominance test as previous research has shown that HMDs should be worn over the
dominant eye [10, 11]. The participant centers a small triangular hole in a piece of pa-
per over a dot on the wall five meters away, and then close their left eye. If the dot
remains centered in view with the left eye closed, the experimenter records the partici-
pant as being right-eye dominant. If not, the experimenter repeats the procedure testing
the other eye to confirm left-eye dominance. Next, the participant is introduced to the
accelerometers and the experimenter attaches an accelerometer to the participant’s left
and right ankles and one to the safety glasses on the side of the non-dominant eye.
Baseline data for average natural walking speed along the path is then collected. The
participant is instructed to walk once around the path in each direction at a comfortable
pace while wearing the glasses and backpack. The time to complete each lap is recorded.
Before the first condition starts, the experimenter explains the design of the study in
more detail, including an introduction to the hardware and software and a demonstration
of how to use the input device. At the beginning of each condition, the experimenterconfigures the appropriate display. The participant then calibrates the display using a
blank screen numbered one through nine with a number in each corner, at the center
of each edge, and in the center of the screen. We included this step to ensure the head-
mounted display is positioned properly and such that the entire screen is visible. For
consistency, we performed this procedure for all three displays.
For the hand-held displays, the researcher places the device in the participant’s non-
dominant hand in the landscape orientation. For the head-mounted display condition,
the experimenter shows the participant how the MicroOptical moves on two ball joints
and what part of the device to move to adjust the focal depth (Figure 4). The exper-
imenter mounts the display on the safety glasses over the participant’s dominant eye.
With the aid of the experimenter, the participant adjusts the display using the calibra-
tion pattern and changes the display’s focal length to match the floor. After the display is
calibrated and ready to use, the experimenter places the input device in the participant’s
dominant hand and starts the experimental software.
Each condition begins with one practice reading trial which is performed with the
participant standing still at the beginning of the path. Once the reading trial has been
finished, and the participant’s questions have been addressed, the trials begin. Partic-
ipants are instructed to walk along the path as during baseline measurement; that is,
along the path and inside the lines. The participants are instructed to continue walking
until they finish the last (10th) trial and informed that they can slow down or speed up
as desired, but not to stop; they are also instructed to answer the questions as accurately
as possible. The experimenter tells the participant when to start; the participant begins
walking and must press the red button to see the first passage.
As the participant walks around the path and completes the trials, the experimenter
follows behind as quietly as possible and uses a silent tally counter to keep track of
the number of times the participant steps outside the path and the number of complete
laps. When the participant completes the final trial, the software shows an ending screen
asking the participant to stop. The experimenter notes the time required to complete the
10 trials and records the participant’s final position.
At the end of each condition, the experimenter directs the participant to complete
the NASA-TLX surveys, reminding them to consider only the most recent 10 trials
and the display just used. After the TLX, the procedure is repeated with the remaining
display devices. Once all three conditions are complete, another assessment of natural
walking speed is conducted before removing the bag, glasses, and accelerometers. Fi-
nally, the experimenter asks the participants to share any comments they had about their
experience with any of the displays and the task performed.
4.4 Participants
Twenty-two participants were recruited from the student body by word-of-mouth. We
did not control for any demographic factors (i.e. gender, eye-sight, native language,
etc.). All participants were compensated $10 per hour, regardless of their performance.
Time to complete the study ranged from 1.25 to 2 hours, with a median of 1.5 hours.
Of the 22 data sets generated, only 15 data sets were used. Seven of the twenty-two
data sets were missing accelerometer data. We consider only the 15 complete data sets
throughout the rest of this paper.The 15 participants ranged in age from 21 to 49 years, with a median of 25 years.
Two participants were left-handed, twelve were right-handed, and one was ambidex-
trous. Six participants were right-eye dominant and nine were left-eye dominant. The
seven non-native English speaking participants had experience reading English ranging
from 5 to 17 years, with a median of 12 years. Only two participants indicated having
experience with a head-mounted display, and both noted that their experience consisted
of simply looking through a display once.
4.5 Data Collection and Analysis
To assess participant performance, we record reading time, response time, response ac-
curacy, path accuracy, walking speed and walking accuracy. Reading time is the time
from when a passage is first displayed to when the participant presses the red button
to proceed to the question. Response time is the time from when an answer screen is
displayed to when the participant presses the red button to proceed. Response accuracy
is whether or not the participant selected the correct answer. All of these values were
calculated from the data logs after the experiment was competed. Path accuracy is the
number of times the participant stepped outside the path. Total distance was calculated
by counting the number of laps (full and partial) around the path. To assess perceived
workload, each participant completes the standard NASA-TLX scale and demand com-
parison surveys after each display condition.
The accelerometers on each ankle are used to track the movement of each foot.
Previous research anecdotally noted that users tended to increase or decrease walking
speed with changes in task difficulty [3]. The time-stamped acceleration data provides
quantitative data that can be used to analyze the changes in walking speed in relation
to what the participant was seeing on the display and what buttons they were pressing.
The accelerometers on the hand-held devices and head provide orientation information.
Previous research has demonstrated both the utility and validity of using accelerometers
in experiments designed to investigate mobile device while in motion [21].
5 Results
5.1 Passage and Question Performance
Our 15 participants read a combined total of 450 passages and answered 900 ques-
tions. Table 3 shows the percentage of questions answered correctly, the average time
spent reading each passage, and the average times spent answering the first and second
questions for each display condition. In terms of accuracy, the participants performed
surprisingly poorly, regardless of display type. A repeated measures ANOVA on the
display condition shows no statistical difference in ability to answer the questions cor-
rectly. The average accuracy across all conditions is only 69.4%.
Examining the average time spent during each of the three phases of the trials (read-
ing the passage, answering question one, and answering question two) reveals statisti-
cally significant differences for the three conditions. While a post-hoc pairwise analysis
reveals no significant effects for the time spent on each question phase, we do findDevice
Librié OQO MicroOptical p-value
Percent correct, overall 70.30 71.52 66.36 p 1.00
Percent correct, Q1 68.48 72.73 67.27 p 1.00
Percent correct, Q2 72.12 70.30 65.45 p 1.00
Passage time (s) 68.04 66.05 89.46 p 0.01
Time Q1 (s) 14.63 14.56 14.57 p 0.01
Time Q2 (s) 14.25 15.66 17.69 p 0.01
Table 3. Performance on passage questions.
significant pairwise effects for reading time. Results show participants read faster on
both of the hand–held devices than on the head–mounted display. This finding is re-
inforced by participant comments stating they would often lose their place in the text
while reading on the head-mounted display. Several participants indicated that they lost
their place due to motion of the HMD, while others mentioned being distracted by
the environment. The issue of distracting environmental backgrounds is consistent with
findings from studies of stationary head-mounted display use [11].
5.2 Walking Performance
We also tracked measures related to the walking portion of the task: total distance trav-
eled, total time spent walking around the path, and total number of steps outside of the
path for each display condition. From this data we computed two additional, normal-
ized values: walking speed and number of steps off the path per unit distance (meter).
The mean values for each condition and the p-value from a one-way repeated measures
ANOVA are shown in Table 4.
Device
Librié OQO MicroOptical p-value
Distance (m) 502.97 480.70 609.29 p 0.01
Time (s) 697.45 673.62 1003.38 p 0.01
Speed (m/s) 0.72 0.71 0.63 p 1.00
Steps off path 112.00 116.67 197.67 p 0.01
Steps off/m 0.22 0.23 0.31 p 1.00
Table 4. Walking performance for the three conditions.
The analysis reveals statistically significant differences between the three conditions
for distance, speed and number of steps off the path. Post-hoc pairwise analysis shows
worse performance for the head-mounted display condition relative to each hand held
display (p 0.01). It is interesting to note, however, that our two normalized metrics
(walking speed and steps off path per meter) show no statistically significant difference.
Using the data from the accelerometers, we calculated the angle at which the hand
held displays were held relative to the ground. We calculated the mean angle for eachpassage and set of questions. The Librié was held on average at an angle of 40.9 degrees
(SD=10.8) where 0 degrees is parallel to the ground. In contrast, the OQO was held at
58.0 degrees (SD=9.0). A Student’s t-test reveals a statistically significant difference
between these two conditions (p 0.01).
Finally, the data show that participants slowed down while reading and walking the
path, regardless of display type. The baseline “natural” walking speed for the partici-
pants was 0.99 m/s (SD=0.18) while the mean walking rate in the conditions was only
0.69 m/s (SD=0.22).
5.3 Nasa Task Load Index
The NASA Task Load Index (TLX) is a questionnaire used to measure subjective work-
load ratings. Previous studies have indicated that it is both a reliable and valid measure
of the workload imposed by a task [8, 7]. The NASA-TLX consists of six scales: men-
tal demand, physical demand, temporal demand, performance, effort, and frustration;
each scale has 21 gradations. For each scale, individuals rate the demands imposed by
the task. In addition, they rank each scale’s contribution to the total workload by com-
pleting 15 pairwise comparisons between each combination of scales. This procedure
allows an investigation of how task demands load on each scale, as well as a measure
of the total workload.
Interpretation of the mental, physical, and temporal demand scales are straightfor-
ward; each scale captures the demand imposed by its title. The performance scale cap-
tures how successful participants felt they were at accomplishing the given task. The
effort scale captures how hard individuals had to work in order to achieve their level of
performance; both mental and physical effort can contribute to this scale. The frustra-
tion scale captures how much the task annoys or discourages individuals.
The overall workload rating is calculated by summing the product of each scale’s
rating and weight. This calculation results in a score between 0 and 100. It reflects an
individual’s perception of the amount of workload devoted to each of the scales, along
with each scale’s contribution to overall workload [8]. Here, we analyze the overall
workload ratings in addition to the six individual scale ratings. For each analysis a one-
way repeated measures ANOVA is used.
Device
Librié OQO MicroOptical p-value
Total workload 30.84 34.29 42.56 p 0.01
Mental 48.13 43.73 40.27 p 0.01
Physical 10.80 28.00 30.53 p 0.01
Temporal 6.13 4.40 4.47 p 0.01
Performance 10.07 9.67 14.20 p 0.01
Effort 13.87 13.07 22.67 p 0.01
Frustration 3.53 4.00 15.53 p 0.01
Table 5. Total TLX workload as well as weighted component scores (out of 100). Each metric
shows that the three displays are statistically different at the p 0.01 level.
The analysis shows significant effects (p       0.01) for the total workload as well
as the six component scales (Table 5). Pairwise post-hoc analysis reveals statistically
significant differences for total workload, frustration and effort with the Librié and OQO
scoring better than the head–mounted display. In contrast, the physical dimension for
the Librié is rated as less demanding than either the OQO or MicroOptical.

6 Discussion

Overall, our data and analysis show participants performed least well in the head-
mounted display condition. When there are statistically significant differences, both of
the hand-held displays yield better performance than the HMD. The only exception we
found in the data is that participants rated the Librié as less physically demanding than
either the OQO or MicroOptical. Rating the HMD worse than the Librié is consistent
with the other findings. The difference of the Librié relative to the OQO is likely due
to the weight of the devices. Even though the Librié has a large height and width, it
is much thinner and lighter than the OQO. This result is supported by comments from
several participants about the weight of the OQO.
    The HMD may have seen a reduction in performance due to its monocular nature;
the participants were able to see the hand-held displays with both eyes, but had to use
only one to look at the HMD. Velger [17] identifies several characteristics that can cause
difficulty in viewing when an image is only shown to one eye with an HMD: when
presenting an image: brightness, image characteristics (i.e., text vs objects), viewing
distance, contrast, resolution, color, motion and orientation. Velger also discusses the
issue of binocular rivalry, where the brain causes the images from each eye to alternate.
This factor may have caused difficulty in reading because of distracting backgrounds
[11]. Another potential factor that may impact these results is that all of our participants
were novices with head-mounted displays. As a result, the displays may not have been
positioned optimally, and the participants did not have the benefit of strategies that
might be developed by more experienced users.
    We were anticipating some issues with the Librié due to its slow refresh rate. While
several participants commented on the delay in screen updates, our data do not show
statistically significant results indicating this delay had an impact on the reading com-
prehension task.
    As expected, participants slowed their walking rate while performing the reading
tasks using the mobile displays. On average, they slowed down from a mean “natural”
walking speed of 0.985 m/s to 0.687 m/s during the trials.
    Many participants commented that they were surprised by difficulty of completing
the reading comprehension tasks while walking, regardless of display type. This issue
is reflected in the data, with a mean response accuracy of 69.4% across all conditions.
There could be several factors contributing to this effect. For example, it is possible the
task may be unrealistically difficult. The reading comprehension passages and questions
are designed for preparing students for standardized tests as opposed to a more typical
task requiring less concentration such as reading a web page.
7 Future Work
We intend to further analyze the data collected from the accelerometers to get more
detailed information about any potential gait changes that may have occurred while
performing the reading comprehension task with the different displays. We also plan
on examining more experienced HMD users to see if practice might mitigate some of
the performance penalties observed in this study. It would also be interesting to explore
these devices in a more longitudinal setting to see if training, particularly with the HMD,
might impact participants’ ability to read on the go.
While our laboratory experiment of reading comprehension ability while walking on
a path provides interesting insights, we are also interested in exploring the capabilities
of these displays in more natural settings. Walking on our path involved navigating
static obstacles. A mobile device user in the real world would also encounter mobile
obstacles such as other people. Furthermore, the user can be mobile in other ways, such
as riding in an automobile or standing on a subway train.
As noted above, our experiment used passages designed help students practice for
standardized tests. We would also like to explore other visual tasks that are likely to be
performed on mobile devices such as browsing email or reading a web page. We would
also like to examine more fundamental issues of the displays while in motion such as
font size and psycho-perceptual factors like visual acuity. Another approach would be to
evaluate the effects of visual layout on our participants’ ability to read while in motion.
Several participants commented in the HMD condition that while they were reading,
they would lose their place and end up rereading the same line multiple times. It is
possible that adding more white space or other visual separators might minimize this
effect and alter performance.
In addition to the devices used in this study, there are other new interesting display
technologies being created. In particular, Symbol has a small personal scanning projec-
tor 3 approximately 3.3 cubic cm in size. With this type of technology it will be possible
to carry a projector to create a display on the floor. It would be interesting to explore if
the technology has any potential benefit for use while in motion.
8 Conclusions
We evaluated in-motion reading performance on mobile devices using three different
displays: a MicroOptical SV-3 monocular head-mounted display, a Sony Librié elec-
tronic ink e-book display, and an OQO palmtop computer display. Furthermore, we
updated an existing framework for evaluating devices for use while in motion [2, 3] by
introducing a method for decoupling input from output.
The results of our study indicate that the performance of our participants was worst
when using the head-mounted display; we found no significant differences between
the two hand-held displays for most measures. The only exception was the subjective
measure of perceived physical demand, in which the Librié was perceived as being less
demanding than the OQO. While the Librié screen takes longer to update than either of
3 http://www.symbol.com/products/oem/lpd.htmlthe other displays, our findings did not indicate any significant negative effects from the
slow refresh rate.
9 Acknowledgements
This work is funded in part by the National Science Foundation and the National Insti-
tute on Disability and Rehabilitation Research. This material is based upon work sup-
ported by the National Science Foundation (NSF) under Grant No. 0093291. Any opin-
ions, findings, and conclusions or recommendations expressed in this material are those
of the author(s) and do not necessarily reflect the views of NSF. This is a publication
of the Rehabilitation Engineering Research Center on Mobile Wireless Technologies
for Persons with Disabilities, which is funded by the National Institute on Disability
and Rehabilitation Research of the U.S. Department of Education under grant number
H133E010804. The opinions contained in this publication are those of the grantee and
do not necessarily reflect those of the U.S. Department of Education.
References
1. S. Baker, H. Green, B. Einhorn, M. Ihlwan, A. Reinhardt, J. Greene,
and C. Edwards. Big bang! BusinessWeek, June 2004.
http://www.businessweek.com/magazine/content/04 25/b3888601.htm.
2. L. Barnard, J. S. Yi, J. A. Jacko, and A. Sears. An empirical comparison of use-in-
motion evaluation scenarios for mobile computing devices. International Journal of Human-
Computer Studies, 62(4):487–520, 2005.
3. L. Barnard, J. S. Yi, J. A. Jacko, and A. Sears. A new perspective on mobile device evaluation
methods (in-press). To appear in Personal and Ubiquitous Computing, 2005.
4. M. Curry, J. Hobbs, R. Toub, and S. Douglas. Will using a head-mounted display affect
pointing on wearable computers? Technical Report CIS-TR 97-03, Dept. of Computer and
Information Science, University of Oregon, January 1997.
5. E Ink Corporation. Display Readability, 051702 edition, 2002.
http://eink.com/pdf/eink readability 02.pdf.
6. K. W. Gish and L. Staplin. Human factors aspects of using head-up displays in automobiles:
A review of the literature. Technical Report DOT HS 808 320, National Highway Traffic
Safety Administration, 1995.
7. S. G. Hart and L. E. Staveland. Human Mental Workload, chapter Development of NASA-
TLX (Task Load Index): Results of empirical and theoretical research. North-Holland, 1988.
8. S. G. Hill, H. P. Iavecchia, J. C. Byers, A. C. Bittner, A. L. Zaklad, and R. E. Christ. Com-
parison of four subjective workload rating scales. Human Factors, 34(4):429–439, August
1992.
9. J. Kjeldskov and J. Stage. New techniques for usability evaluation of mobile systems. Inter-
national Journal of Human-Computer Studies, 60:599–620, 2004.
10. D. Knudson and D. Klika. The impact of vision and vision training on sport performance.
The Journal of Physical Education, Recreation and Dance, 1997.
11. R. S. Laramee and C. Ware. Rivalry and interference with a head–mounted display. Trans-
actions on Computer–Human Interaction, 9(3):238–251, September 2002.
12. LearningExpress, editor. 501 Reading Comprehension Questions. Learning Express, 1999.
13. Mobile CommerceNet http://www.mobile.seitti.com, January 2002.14. T. Mustonen, M. Olkkonen, and J. Hakkinen. Examining mobile phone text legibility while
walking. In CHI ’04 extended abstracts on Human factors in computing systems, pages
1243–1246, New York, NY, USA, 2004. ACM Press.
15. A. Oulasvirta, S. Tamminen, V. Roto, and J. Kuorelahti. Interaction in 4-second bursts: the
fragmented nature of attentional resources in mobile hci. In Proceedings of SIGCHI, pages
919–928, New York, NY, USA, 2005. ACM Press.
16. J. Sheedy and N. Bergstrom. Performance and comfort on near-eye computer displays. Op-
tometry and VisionScience, 79(5):306–312, May 2002.
17. M. Velger. Helmet-Mounted Displays and Sights. Artech House, Inc., Norwood, MA, 1998.
18. P. M. Ververs and C. D. Wickens. Conformal flight path symbology for head-up displays.
Technical Report ARL-98-5/NASA-981, Aviation Research Laboratory, 1998.
19. C. D. Wickens and J. Long. Object versus space-based models of visual attention: Impli-
cations for the design of head-up displays. Journal of Experimental Psychology: Applied,
1(3):179–193, 1995.
20. M. Yeh, J. L. Merlo, C. D. Wickens, and D. L. Brandenburg. Head-up vs. head-down: Effects
of precision on cue effectiveness and display signaling. In Proceeding of the 45th Annual
Meeting of the Human Factors and Ergonomics Society, 2001.
21. J. S. Yi, Y. S. Choi, J. A. Jacko, and A. Sears. Context awareness via a single device-attached
accelerometer during mobile computing. In Proceedings of MobileHCI, pages 303–306,
2005.You can also read