REC GROUP SOLAR MARKET INSIGHT - H1 2018 - REC Solar
←
→
Page content transcription
If your browser does not render page correctly, please read the page content below
REC GROUP
SOLAR MARKET INSIGHT
H1 2018

                       August 14, 2018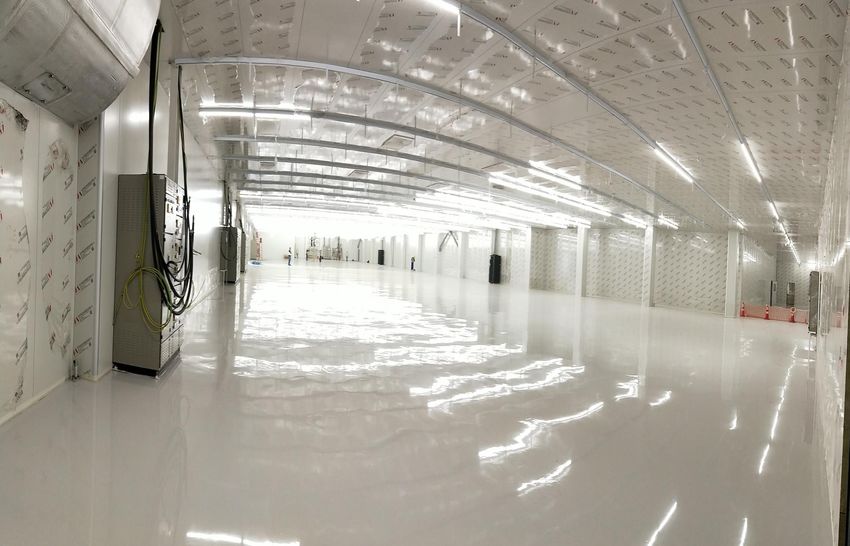
REC Group Solar Market Insight Report – H1 2018

 1   REC Highlights – H1 2018

 2   REC Operations

 3   Global Performance – H1 2018

 4   REC Global Outlook 2018

                                                  2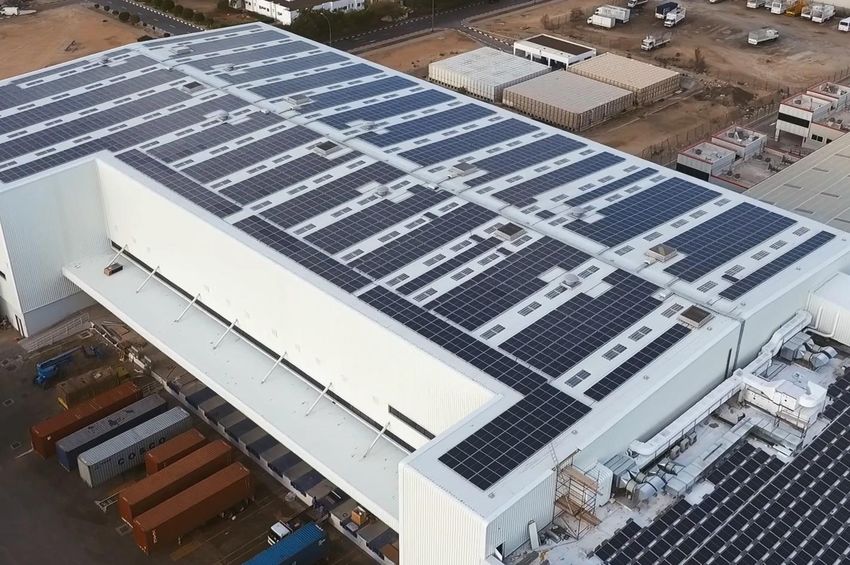
REC H1 2018 Highlights

• Launch of world’s first n-type mono solar panel with half-cut cells
  and a twin design, starting a new era for the company

• Very strong operational performance

     o Module production +39% in H1 2018 vs. H1 2017
• Active growth of customer base globally, with the Americas
  showing the biggest growth of 83% compared to H1 2017
• REC escalates innovations along the full value chain, in particular
  silicon kerf recycling
• REC completed transition to diamond wire slicing and new
  texturizing methods
• For the 3rd year in a row, REC has been named a Top Performer by
  DNV GL
• REC achieves an industry-leading energy payback time thanks to
  its fully integrated solar value chain and silicon production in Norway

• REC Group’s Norwegian entity, “Elkem Solar”, changed its name to
  “REC Solar Norway”, completing the integration into REC Group

• REC breaks ground for one of Singapore’s largest rooftop solar
  installations at its Tuas manufacturing plant, attended by Singapore’s
  Senior Minister of State for the Environment and Water Resources,
  Dr. Amy Khor

• Roll out and expansion of REC’s Channel Programs in APAC                  3
1   2   3   4

REC Highlights – H1 2018
Launch of new flagship product: REC N-Peak

                            • REC entered into a new era with its N-Peak Series, a
                              solar panel with n-type mono half-cut cells and a twin
                               design – the 1st of its kind
                            • Successfully launched at Intersolar Europe in June 2018
                            • Most powerful 60-cell product ever by REC with power
                              output of up to 330 watt peak
                            • Unique combination of value adding features
                                     • Mono n-type: the most efficient crystalline silicon
                                       technology
                                     • No Light Induced Degradation
                                     • Super-strong frame design up to 7000 Pa snow load
                                     • Flexible installation options
                                     • Improved performance in shaded conditions
                                     • Long-term high power for lasting performance
                            • Industry leading 25-year power warranty, with 0.5%
                              degradation per year; 12-year product warranty
                            • Manufactured in REC’s brand-new ‘Industry 4.0’ cell
                              building at REC’s Singapore plant
                            • Distinct energy yield advantage over competitive p-mono
                              products, shown by initial field test carried out by SERIS1

                            1 SERIS = Solar Energy Research Institute of Singapore
                                                                                             5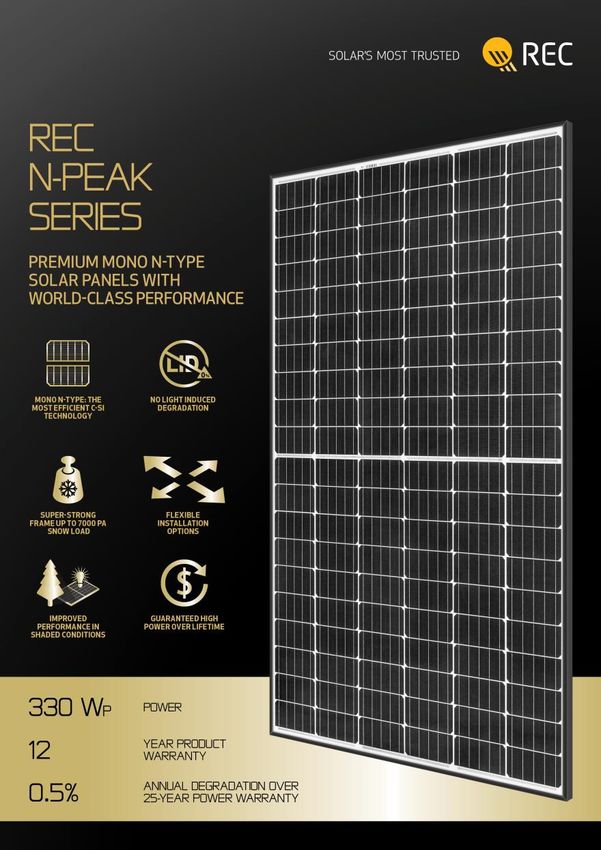
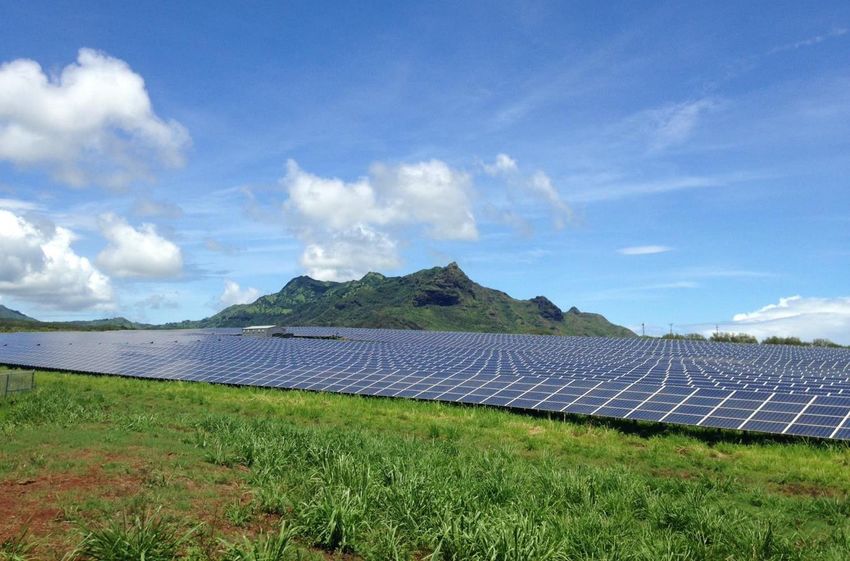
Industry-leading energy payback time achieved

 • REC solar panels achieve an energy
   payback time of around 1 year, which
   is class-leading
 • One year of energy payback time refers
   to the time a panel needs to generate                                                                              Annual
   the amount of electricity which was                                                                                         Yield/Year   EPBT1
                                                                             Location                                  GHI
   required to produce the panel itself                                                                                       (kWh/kWp)     (years)
                                                                                                                     (kWh/m²)
 • The company’s efforts throughout its
   entire value chain are leading the way in                                 Munich, Germany                          1,183      1,182       1.7
   sustainable panel production
                                                                             Barcelona, Spain                         1,635      1,651       1.2
 • As the most energy intensive phase of
   the entire production process is the                                      Phoenix, Arizona, U.S.                   2,093      1,319       1.0
   silicon production, REC benefits from its
   proprietary silicon process by REC                                        New Delhi, India                         1,973      1,939       1.1
   Solar Norway
                                                                             Tuas, Singapore                          1,623      1,804       1.5
 • In combination with hydro as the main
   energy source for REC Solar Norway                                        Perth, Australia                         1,938      1,830       1.1
   operations, this leads to one of the
   lowest carbon footprints in the
   industry
 • More insights available in REC’s recent
   published whitepapers
 1 EPBT = Energy Payback Time; Data based on an 290Wp solar module and calculated using PVsyst simulation software
                                                                                                                                                   6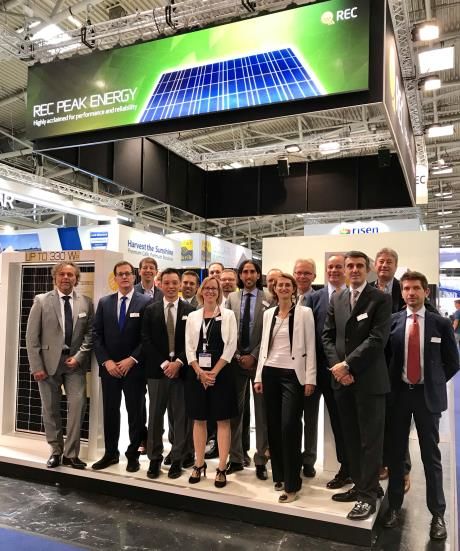
REC Group again Top Performer in PV Module
Reliability Scorecard by DNV GL

• REC has been named a Top Performer by DNV GL in its PV
  Scorecard – for 3rd year in a row
• This rating acknowledges REC’s continuous efforts and ambition
  to deliver highest quality to its customers
• REC demonstrates an industry leading low claims rate of far
  below 100 parts per million (ppm), an outstanding results if one
  considers that in 2017, REC Group manufactured 4.3 million solar
  panels in its integrated and automated production plant in
  Singapore
• REC earned Top Performer status for its award-winning TwinPeak
  2 panels in all test categories:
      o Potential induced degradation (PID) tests (power output
        losses caused by voltage, heat and humidity)
      o Thermal cycling tests (resilience to fluctuations in
        temperature)
      o Damp heat tests (use high temperature and high humidity to
        evaluate panel construction)
      o Dynamic mechanical load tests (load effect of snow and
        wind to measure a panel’s resilience to degradation)

 *DNV GL, the world’s largest independent expert & certification body for renewable energy
                                                                                             7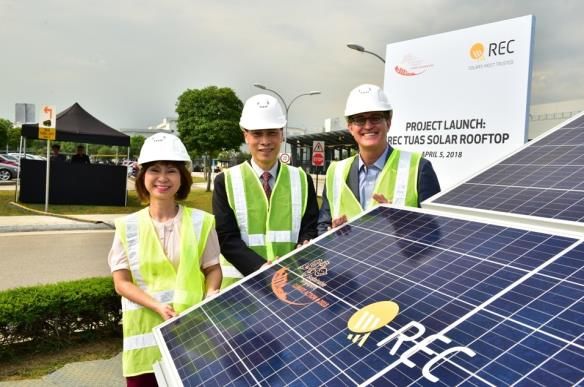
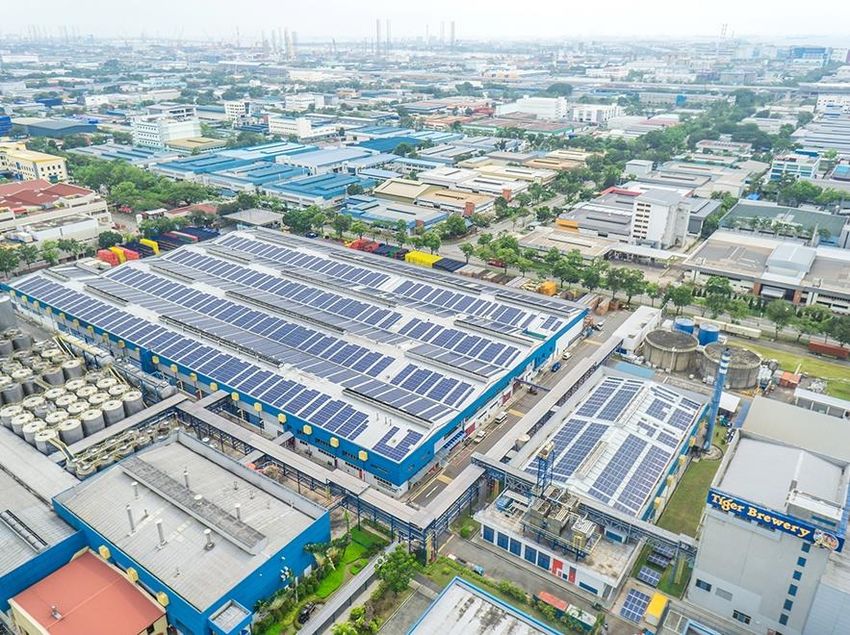
REC breaks ground for one of Singapore’s largest
rooftop solar installations at its own Tuas plant
• REC held a ground-breaking and contract-signing
  ceremony for one of Singapore’s largest-ever rooftop
  solar installations
• The new installation, located on the rooftops of REC’s
  integrated factory in Tuas
    o Built in collaboration with Singapore-based power
      company PacificLight Energy; to be operational by
      August 2018
    o Will generate around 2.6 million kWh annually =
      enough to power 550 HDB four-room apartments
    o Will save 1,400 tons of CO2 emissions every year =
      equivalent of planting 64,000 trees or taking almost
      300 cars off the road
    o Further reduces already low carbon footprint of REC
      solar panels
• As guest of honor, REC welcomed Singapore’s Senior
  Minister of State for the Environment and Water
  Resources, Dr Amy Khor
• By installing solar on its own roof, REC shows its support
  to Singapore’s Year of Climate Action

                                                               8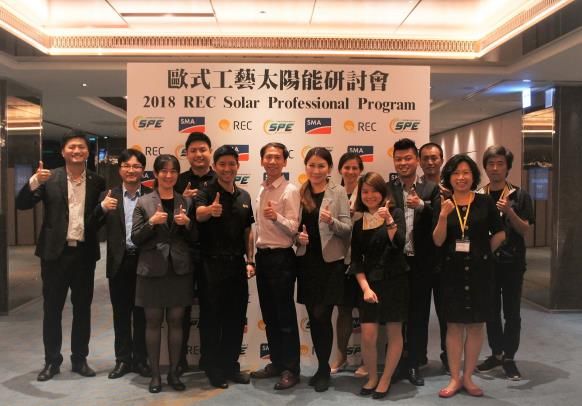
Roll out and expansion of REC’s Channel Programs
in APAC
REC Partner Program                                       REC Solar Professional Program
• REC added seven new partners in APAC to                 • REC organized together with its partners 12
  the REC Partner Program in Q2 2018                        certification trainings in APAC H1 2018
    o New Partners are in Australia, Taiwan, Japan, New   • 237 new installers in APAC are now REC Solar
      Zealand, Thailand and Indonesia                       Professionals (Australia, India, Taiwan)
• REC Partner Program builds and maintains                • To date, the REC Solar Professional Program
  alliances with distributors by offering partners a        comprises over 1,500 certified installers
  range of technical and marketing services, tools          globally with 500+ in APAC
  and benefits to grow business profitably with
  REC products                                            • The Program gives installers unique training and
                                                            skill-building to ensure global best practice in
• Launched in 2011, the REC Global Partner                  system installation
  Program now numbers 45 Platinum Partners and
  Authorized Distributors worldwide                       • Certified REC Solar Professionals benefit from
                                                            an extended product warranty of additional 2
                                                            years and a range of sales and marketing tools

                                                                                                             9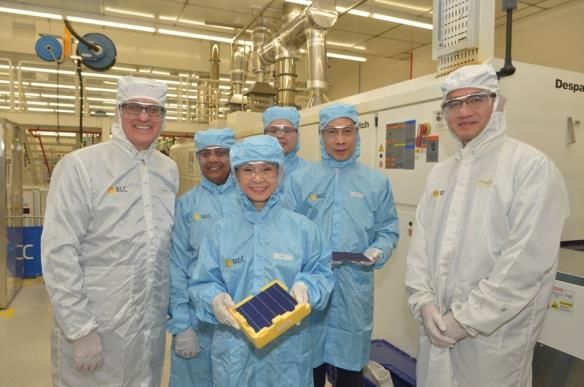
1   2   3   4

REC Operations
Performance highlights
REC achieved 50% cost reduction from 2012 to 2017

                                                                                                  •   REC was highly
Total Cost1 Development – Actual and Projection from 2012 to 2018
                                                                                                      successful in
                                                                                                      reducing its total cost
                                                                                                      per watt over the last
                                                                                                      six years – achieving
                                                                                                      a 50% cost decline
                                                                                                  •   While most peers
                                                   -50%                                               struggled to bring
                                                                                                      down cost during
                                                                                                      2017 due to higher
                                                                                                      input prices
                                                                             -15%
                                                                                                      especially in H2 2017
                                                                                                      (i.e. polysilicon),
                                                                                                      REC managed a cost
                                                                                                      reduction of ~15%,
                                                                                                      thanks to its
                                                                                                      continuous efforts to
                                                                                                      invest in new
   Q4’12              Q4’13              Q4’17             Q4’15         Q4’16   Q4’17   Q4’18F       technology and
                                                                                                      achieving efficiency
                                                                                                      gains
1 Total Cost including silicon + raw material, wafer, cell module cost
                                                                                                                            11
Thanks to its technology focus, REC enjoys continuous
improvement in cell efficiency
REC Average Cell Efficiency Trend
Cell Efficiency
(average, in %)
20.5 20.1
20.0
19.4
19.5
19.0 18.8
18.5
18.0
18.0 17.7
17.4
17.5
17.0
17.0 16.7
16.5 16.1
16.0
15.5
15.0
2010 2011 2012 2013 2014 2015 2016 2017 2018F
12REC innovates along the value chain while pushing
its production output to new records
Value
Chain
Step
ESS Silicon Block Wafer Cell Panel
REC achieved increasing production output in each step of its value chain from H1 2017 to H1 2018,
except for cells due to line upgrades and line conversion
+39%
+6% +58%
+5%
727
1,850 630 -3%
3,656 3,882 602
404 391 522
Actual 1,172
Production
Output
H1 ‘178H1 ‘18 H1 ‘17 H1 ‘18 H1 ‘17 H1 ‘18 H1 ‘17 H1 ‘18 H1 ’17 H1 ‘18
(in MT) (in MT) (in MW) (in MW) (in MW)
Innovation: N-
Innovation: Innovation:
mono half-cut
Kerf recycling N-Peak Series
cells
13REC starting ‘Industry 4.0’ manufacturing
• For its brand-new flagship product,
N-Peak, REC Group built a new
‘Industry 4.0’ cell building at its
Network integrated production plant in
Industrial
IoT Centric Singapore
• This expansion adds the ‘Internet
of Things’ idea to REC’s already
highly automated production
Sensors Quality
• In this so called ‘Cyber-physical
System’, machines communicate
Industry and cooperate with each other and
4.0 with humans in real time across the
Monitoring full value chain
Tools
• By using advanced sensors,
Safety
software and data, machines are
moving around along dedicated
Automation paths and fulfilling tasks stand-
alone, resulting in efficiency
improvements, economic benefits,
and reduced human exertions
14REC Solar Norway pioneering in Kerf Recycling
• With the planned implementation of REC’s
inimitable “Silicone Kerf Recycling”
process, the already low carbon footprint of
REC’s silicon and solar panels will even
further improve
• For the very first time, REC was able to
upgrade fines from the wafer process to solar
grade silicon in a test phase – this is not only
recycling but true upcycling
• REC is the only solar company who has
demonstrated the capability to upcycle
silicon fines into high-quality solar grade
silicon
• In Q1 2018, REC Solar Norway has
successfully finalized the concept study, and
received grant approval from Enova for next
steps to demonstrate feasibility of mass
production
151 2 3 4 Global Performance – H1 2018
REC’s H1 2018 shipments were balanced segments
 with Americas and EMEA as strongest regions
                                                                                           •     Balanced shipments among all key segments
   H1 2018 Module Shipments by Region
   (in MW)                                                                                 •     Americas and EMEA equally account for the
                                                                                                 largest portion of REC shipments
                     APAC
                                                                                           •     Americas
                              26%                                Americas
                                                        36%                                          • Shipments increased by 23% y-o-y and
                                                                                                       customer base grew by 83% y-o-y
                                                                                                     • REC ranks amongst the Top 5 most popular
                                                                                                       panel brands for residential installations in the
                                                                                                       entire U.S. in Q1 20182
                                     37%                                                   •     EMEA:
                               EMEA                                                                  • Top 5 markets were Germany, France, the
   H1 2018 Module Shipments by Segment                                                                 Netherlands, Turkey and Belgium
   (in %)                                                                                            • REC enjoyed strong growth rates from H1 2017
             Utility                                                                                   to H1 2018 in France with +183%, having
                                    Residential                                                        achieved CRE3 and CRE4 methodology
                     26%
                                32%                                                                    certification for its TwinPeak products as well
                                                                                                       as in Belgium (+115%) strengthening its brand
                                                                                                       position
                                                                                           • APAC
    Commercial &                                                                                     • Top markets were India, Japan, Australia,
       Industrial                                                                                      Thailand and Singapore
                                      42%
                                                                                                     • Strong demand for REC products in rooftop
                                                                                                       applications, esp. C&I, a key segment of REC
1 REC market segment module shipment volume splits are best estimates; 2 Based on Q1 2018 data by GTM, published June 2018
Source: REC; GTM Research US PV Leaderboard Q2 2018, IHS Markit
                                                                                                                                                     17
1 2 3 4 REC Global Outlook 2018
Expected reduced Chinese PV demand in 2018 could cut
 global installations to ~95GW
 Solar PV Installations                                                                                 •   The Chinese policy change has
 (in GW, base-case vs optimistic)                                                                           turned an expected global PV market
                                                                                                            growth of 8-10% in 2018 into a
             Optimistic                                                                                     demand drop of 7% (in total -14 GW)
                                                                                                 122
             Base-case                                                                                  •   But the overall market outlook is still
                                                                                 114                        bright: more than 30 countries are
                                                                                                 20         expected to grow in 2018, with China
                                                      -7%                         13
                                                                                                            tending for a surprise
                                                                                                        •   The global PV market will benefit from
                                                                                                            increasing demand diversification –
                                                                                                            more markets to achieve 1+ GW
                                                                                                            installation mark, hence increasing
                                                                                                            the overall PV market resilience
                                                                                                            against individual market changes
                                                                                                        •   Rather than being active in China,
                                             101                                 101             102        REC’s core markets are expected to
                                                                95
                                                                                                            grow
                            80
                                                                                                        •   In the mid- and long-term, solid
          56                                                                                                fundamentals for solar PV will
                                                                                                            continue to improve worldwide
                                                                                                        •   Global benchmark levelized cost of
                                                                                                            electricity for PV has fallen 19% to
                                                                                                            $70/MWh, from $86/MWh in H1 2017
        2015              2016              2017             2018F             2019F            2020F

Source: REC (June 2018); IHS Markit, Bloomberg New Energy Finance, GTM Research, ROTH Capital                                                  19
The European PV market returned to growth with
auctions and self-consumption being strong facilitators
Europe PV Installations • European PV demand continuous its recovery
(In GW, 2016-2019e) path
• Revised RE target of 32% (increased from 27%)
by 2030, requires roughly almost a doubling of
the annual 2017 installations
16 • The “Top Six” markets will grow at 42% CAGR
from 2017 to 2019 (Germany, France,
+31% Netherlands, Italy, Turkey, Spain); with the
Netherlands set to become a 1 GW+ market
11 • Former heavyweights are expected to make
their comeback
9
7 • European demand picture is set to increasingly
diversify
• Rooftop PV1 is growing by ~22% from 2017 to
2019
• Due to expected ongoing PV cost decline, there
is the potential for a growing number of LCOE
driven large-scale project
2016 2017 2018e 2019e
Remark: country forecast are based on average of IHS and BNEF forecasts; 1 Rooftop PV including residential as well as small and medium C&I applications
Source: REC, IHS March 2018, BNEF Q2 2018, SolarPower Europe, Feb. 2018 20Despite Section 201 trade case, the U.S. PV market
demand for 2018 is expected to remain rather flat
Annual U.S. PV Installed Capacity and Forecasts • After a muted H1 2018, shipments are
2017 - 2019E, (GW) expected to pick up around end of Q3 2018
as tariff-free inventory will be cleared
Residential Non-Residential Utility
• Current total market estimates at ~10-11 GW
+3% for 2018, forecasting:
+1%
11.1 • Relatively stable residential market
10.7 10.8
• Non-residential faces some headwinds
2.2 2.4 due to policy changes, yet enjoys
2.2
community solar growth
1.7 • Robust performance of utility segment
2.2 1.9
• REC won several large U.S. deals in the
last weeks of H1 2018 for its multi-award-
winning TwinPeak 2 solar panels, reinforcing
its position as one of the U.S.’s top five
panel brands for residential installations
6.6 7.0
6.2
• REC signed its 1st N-Peak deal – just days
after the U.S. unveiling with a long-standing
distribution partner
2017 2018E 2019E
Source: REC; GTM Research & SEIA, U.S. Solar Market Insight: Q2 2018 21The content of this presentation is strictly confidential. REC is the exclusive owner or licensee of the content, material, and information in this presentation. Any reproduction, publication or reprint, in whole or in part, is strictly prohibited. The information in this presentation may not be accurate, complete or up to date, and is provided without warranties or representations of any kind, either express or implied. REC, as well as its directors, officers and employees, shall not be responsible for and disclaims any liability for any loss or damages, including without limitation, direct, indirect, incidental, consequential and special damages, alleged to have been caused by or in connection with using and/or relying on the information contained in this presentation.
You can also read