Relative speed - AXA Investment Managers
←
→
Page content transcription
If your browser does not render page correctly, please read the page content below

For professional clients only
                                                                                       Research & Strategy Insights

Relative speed

# 38 – 23 March 2020                                                       Key points
Lockdowns work but they take time                                          • The daily growth rate of Covid-19
                                                                             cases in Italy is abating but stays at a
Focus last week was on the policy response and we will explore this in       double-digit pace.
the next sections, but let’s first assess the damage already               • Beyond the inference we can make
quantifiable. Lockdowns work, but they will take time to do so, and in       on a bottom-up, sectoral analyses,
the meantime the decline in economic activity is going to be very            the economic impact is now
significant. We are dependent now on the relative speed of the               showing in the” traditional” data in
pandemic and the policy response.                                            the US and the Euro area,
                                                                             strengthening the case for a steep
We continue to look at Italy as a “benchmark” for tracking the epidemic      recession worldwide in 1H 2020. We
in democratic, Western economies. Every day at 6 pm local time the           brought our forecasts further down.
Italian government releases very precise data on the propagation of        • The policy response is “almost
the virus. The growth rate at the national level has abated. As of           there” but we need more details
March 22nd, smoothed over three days, the average daily growth rate          and politicking around the US
in the number of cases across all Italy stood at 13%, against 20% a          stimulus is a concern. Swift
week ago (although testing has roughly doubled). Still, there is a stark     implementation is of the essence
contrast (see Exhibit 1) between the situation of some of the areas          given the level of market stress.
which were first hit, and hence went in “lockdown” early, such as the      • Looking ahead, we explore whether
province of Lodi (where covid-19 cases grew by 4.6% on average over          the crisis will be inflationary. We
the last three days) and the Southern regions where the restriction          think it won’t.
measures started on 9 March only (+16% in Rome).

                                                          1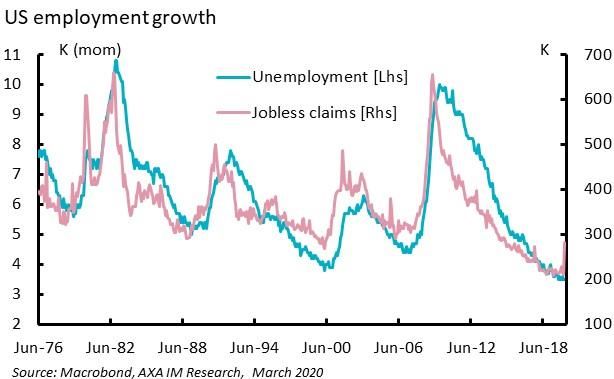
But for the time being there is no proper “Hubei” like situation in Italy where the epidemic has been completely
halted after an initial “explosion”. The confinement measures started at the national level on March 9 and in any
case, no one was expecting a swift effect. The comparison with Hubei is made more complicated by the changes in
counting methods in China at the very end of January, but for now Italy as a whole is still behaving like Hubei with a
lag of 37 days, which would be consistent with the daily growth rate in the number of cases falling below 5% in 10
to 12 days, assuming the conditions of the lockdown are comparable.

                                       Exhibit 1 – Give lockdowns time to work

                   Hopefully "early lockdown" provinces show the
                   way
                  10000
                        Nbr of
                        cases>                                        Lodi       Rome
                        100.
                        Log
                   1000 scale

                                         Days from first lockdown
                     100
                           1 2 3 4 5 6 7 8 9 10 11 12 13 14 15 16 17 18 19 20 21 22 23 24 25 26 27
                    Source: protezione civile, AXA IM Research civile, 21 March

For now, the epidemic is not slowing down enough to relieve the pressure on the hospital system there. This can be
proxied by looking at the status of the infected patients in Italy. On 12 March 52% of those were hospitalised in
“normal care” and 9% in intensive care, with only 39% at confined at home. On 21 March, the proportion in ICU
had fallen to 6.7% and 52% were home. Some of this may reflect wider testing – thus “catching” more people with
only mild symptoms - but can also reflect some limitation of full medical support to the most critical patients.

Economic shock emerging in the data

In a nutshell, for lockdowns to work and reach their intermediate target (keeping the pressure on medical capacity
at an acceptable level) they need to be maintained for long and imposed early enough. And, sure enough, more
and more countries are implementing them. Actually, what is striking – and relevant from a macroeconomic point
of view – is that in quite a few cases the population “took the matter into their own hands” and engaged in fairly
drastic social distancing before the authorities imposed anything. Using real time data from Opentable (a
restaurant booking website), the contraction last week was already quite severe in the US and the UK (see Exhibit
2).

                                                             2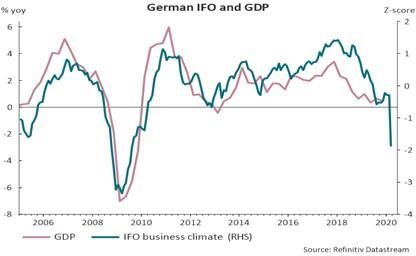
Exhibit 2 – People did not wait for governments to engage in social distancing

Anyway, we no longer need to rely solely on sometimes bizarre real-time data to gauge the impact of the epidemic
on the economy. The first “traditional” indicators are now available for the relevant periods, and they confirm the
depth of the contraction. The relationship between the IFO survey and German GDP has not been perfect over the
last 4 years (see Exhibit 3). Still, based on the historical elasticity, the March reading is consistent with a decline in
GDP of c.3%yoy, half of the loss seen at the trough of the 2008-2009 Great Recession. We suspect that the survey
will tank further when the news of the lockdown are fully taken into account.

In the US, the last weekly jobless claims shot up to their highest level since 2017. The “fit” with the unemployment
rate has historically been very tight (see Exhibit 4) even if the lag has been unusually long after the Great Recession.
Still, we should already brace ourselves for a rise in the unemployment rate to close to 5% quickly.

Exhibit 3 – Halway to the Great Recession already            Exhibit 4 – It didn’t take much time…

Last week we lowered further our forecasts for 2020. We now expect US GDP to fall by 0.4% and by 2.1% in the Euro
area. The US outperformance does not stem from any specific resilience to the epidemic or its economic impact –
we have a shock of about 2% of GDP throughout the developed world – but merely from the fact that the carry-
over from 2019 was better there and trend growth higher. The whole first half of the year would see a steep
recession, with some rebound in 2H, assuming the epidemic is under control and the most disruptive containment
measures can be lifted by the end of Q2.

The message from the first macro indicators is consistent with our forecasting scenario, but at this stage we prefer
focusing on a “bottom-up” approach, imposing next to zero output for the duration of the lockdown on the sectors
(food services, recreation) which are going to be directly hit. We also must think of sectors which should see little
or limited drawdown by nature or because they will be crucial in the current environment and may contribute
more than usual to economic activity. We would consider “energy and water supply”, “information and

                                                            3
communication”, “financial and insurance services” and public services in this “protected perimeter”. The overall
sensitivity of a national economy would depend on the relative weight of those “directly hit” and “protected”
sectors (see Exhibit 5). Spain and Italy look particularly vulnerable by these metrics, even if differences across
countries should not be overstated.
Exhibit 5 – A sectoral sensitivity approach
"Bottom up" approach by sector
% of GDP
40.0
35.0 "Protected sectors" "Worst-hit sectors"
30.0
25.0
20.0
15.0
10.0
5.0
0.0
France Germany Italy Spain Belgium UK
Source: Refinitiv, AXA IM Research, March 2020
Policy response: almost there (but details matter)
The risk to our new forecast unfortunately lies to the downside but did not want to take our baseline lower since
we also need to consider a policy response which fortunately is starting to take shape, even if implementation
remains to be refined in quite a few cases.
After the previous week’s miscommunication, the European Central Bank had to dispel any sense that it would be
unable to ensure the financial sustainability of the unavoidable steep rise in budget deficits in the Euro area. The
market had come to focus on the “limits” (not buying more a third of a government’s eligible debt, apportioning
the asset purchases according to the capital key). Last week the ECB delivered beyond expectations. The limits are
still nominally there but they no longer bite. That’s the welcome main takeaway from their announcements.
Beyond the impressive overall new figure for QE (EUR 750bn until the end of 2020, with the possibility to do more),
key is that on the “limits” the “Council will consider revising them to the extent necessary”. The capital key will
remain the “benchmark” of the purchases, but they will be conducted “in a flexible manner” across jurisdictions
and between public and private assets. So, in reality, those limits are now probably mere “reference values”.
The ECB has added non-financial commercial paper (CP) to the list of purchasable assets. It is important given the
pressure on this market while from the macro point of view it is key to a number of crucial European corporates
which don’t need this additional concern at the moment.
In our view the ECB has by now plugged the “reactivity gap” with the Federal Reserve. Actually, we believe that on
some issues the US central bank is now “late” and strangely timid in its response. We will need to see how exactly
the ECB implements its purchases of non-financial CP but at least it has potentially offered “unconditional
protection” to this asset class. The Fed’s approach is qualified. The Commercial Paper Funding Facility would
purchase at a minimum yield of OIS+200bps, basically replicating the 2008 arrangement, but given the speed of the
market deterioration a stronger commitment to “mop up” any liquidity conversion there would be welcome.
Maybe more fundamentally, the corporate bond market remains the “gaping hole” in the Fed’s new arsenal. There
is something quite paradoxical in the fact that the ECB intervenes on this market although loans continue to be the
4dominant form of corporate funding in Europe, while the Fed does not although market funding dominates in the
US.
Timeliness in implementation is of the essence though, including in Europe. Policy announcements must be followed
by swift action. The current crisis is of a different nature than the Great Recession but some of the ramifications in
the financial system materialise much faster.
Yet, in both the US and the Euro cases, on the sovereign funding side the central banks are providing a very
significant backstop. The bond market sell-off on Friday triggered some questions on the capacity to absorb the
looming fiscal deficits. We are not worried. In the Euro area the two instalments of additional QE directly triggered
by the necessity to deal with the pandemic amount to EUR 870bn by year end. Assuming only 65% of that goes into
sovereigns (a low proportion now that the “limits” do not force a shift towards private assets irrespective of market
developments there), this would still be enough to purchase a borrowing requirement of 7.3% of GDP. We think
most of the sell-off late last week “merely” reflects the need from some investors to sell their safest assets in their
search for liquidity. Their price had actually remained resilient so far. Selling them implied little or no capital loss.
True, the figures announced by some governments are staggering, but a bit of national accounting theory is needed
there. The German Finance Minister shifted decisively on its approach to mitigating the economic cost of the
pandemic by announcing the huge figure of EUR 650b for his programme, which makes the ECB purchasing
commitment look small. But most of it is very unlikely to trigger actual borrowing. The majority (EUR500bn) are
state guarantees to private businesses. These will count towards the deficit – and trigger debt issuance - only if
they have to be drawn. The additional “traditional deficit” is limited to EUR 150bn. It is still a very large number:
4.5% of GDP, now exceeding the French package (2% of GDP for the “traditional” deficit spending) but well within
the absorption capacity of a bond market underpinned by ECB buying.
There again, implementation is key. The announcements are impressive, but details should be available as fast as
possible, for instance on the precise forms state guarantees will take, and when they become effectively available,
to support financial conditions for the corporate sector.
In the US, the package discussed in the Senate is worth about USD1.8trn (5% of GDP) but Secretary Mnuchin was
talking about USD4tn in “liquidity that can be used to support the economy”. Still, as we are writing those lines on
Sunday night no agreement has been found between Republicans and Democrats on the bill. This is particularly
concerning given the weakness of automatic stabilisers in the US.
Discussing the European coordinated response
A group of prominent European economists have just argued in favour of using the European Stability Mechanism
(ESM) in Vox on March 21st (“A proposal for a Covid Credit Line”) to fund some of the fiscal push in the member
States with joint issuance. We supported a similar approach one week ago, but at the time the rationale for us was
to incentivise the ECB to dispose of its “limits” (an ESM programme in principle opens the door to Outright
Monetary Purchases). Now that the ECB has stated its readiness to exceed its limits anyway, there might be less of
a point here. However, there is still probably some political value in expressing European solidarity in a jointly-
backed package, at a time when retraction on national lines is clearly a temptation. But fundamentally, this would
still be a second-best. Indeed, loans from the ESM count towards the member State’s public debt. Joint issuance
allows to reduce the funding cost, but the impact on national debt sustainability is not absolute.
Are we taking risk with inflation?
Focus remains squarely on the emergency policy response, but some fundamental questions still need to be
addressed. One is the impact on consumer prices of the current crisis and its policy management.
In our view the current supply-side shock takes the form of an extreme decline in capacity utilisation, while not
much of the existing capacity is destroyed. This suggests inflation should remain subdued when demand starts
5normalising. In the meantime – during the lockdown – there may be sharp price increases for some items which are
highly in demand, while some businesses in crucial sectors may have to hike wages to reward their staff risk-taking.
Yet, there should be some stabilisation mechanisms. For instance, food hoarding – which may push up prices – will
at some point collide with maximum stocking capacity at home. Then, home de-stocking should provide respite for
shop re-stocking. Besides, some sectors currently facing high demand can raise their supply easily without facing a
steep rise in their production costs (if the networks operate well). In clear, streaming services should be able to
respond to a rise in demand without hiking their fees.
What about the impact of the fiscal/monetary stimulus? The fiscal measures everywhere aim essentially at (i)
replacing lost income (e.g. via more comprehensive/readily available unemployment benefits) or (ii) ensuring there
is no lasting decline in production capacity (guarantee on business debt). That cannot be inflationary. The monetary
stimulus works by making the fiscal support financially sustainable. The private sector is highly unlikely to engage in
“runaway borrowing” because of QE.
Looking ahead, should policy support be “unplugged” quickly once the lockdowns are over? We don’t think so. The
hike in public debt will be permanent and sustainability will still need to be protected. This calls for prolonged
accommodative monetary policy. Besides, demand may well be “shell-shocked” for a long while after the
lockdowns are over. This may take some pump priming. Fiscal policy will have to be able to continue helping.
6Country/Region What we focused on last week What we will focus on this week
• Fed cut FFR to 0-0.25%, started $700bn QE, • Liquidity conditions in US markets.
and relaunched facilities to support • Further policy action with likelihood of
commercial paper and money market funds. ~$1.5tn government stimulus and
• NY and Calif urged people to stay at home additional Fed QE.
• Jobless claims rose 70k to 281k (highest ex- • Jobless claims, fears of a sharp rise in claims
hurricane since 2016) in latest week as economic disruption mounts.
• Biden won Az, Fl and Ill primaries • Feb consumer spending and PCE inflation
• In a surprise move the ECB announced an • Flash March PMIs are likely to follow the ZEW
additional EUR 750bn of QE, with flexibility and IFO and show sharp plunge in sentiment
across jurisdictions and between public and • The weekly call on joint fiscal response of EU’s
private assets; capital key are now mere leaders might give interesting headlines,
reference values. especially after last week rumours on
• German Flash IFO shows record plunge in potential attempt to work on Eurobonds
expectations, business climate at a 2009-low
• In unscheduled meeting BoE cut Bank Rate • BoE scheduled meeting. No expectation of
by 15bps to 0.10%, restarted £200bn QE and further easing. Minutes to this and
launched Commercial Paper funding scheme. unscheduled meeting published.
• Chancellor announced further £20bn fiscal • Preliminary PMIs for UK economy to give
stimulus, £330bn loan guarantees. first official estimates of scale of impact in
• Employment growth solid at +184k 3-month Q1/Q2.
to Jan pre virus. Unemployment rose to 3.9%
• As expected, the BoJ announced an increase • March Manufacturing PMI Flash
in ETF purchases (Y12tn per year from 6) and • CPI Tokyo is a good proxy for national index,
some lending facilities. No rate cut. already low in February (+0.5%yoy from 0.7%).
• Tankan DI fall to an 8 year low. • February chain store sales is likely to drop
• February trade data showed a major drop in as a consequences of low inbounds tourist.
imports (-14%yoy) and exports stuck in
negative territory for the 15th month.
• Jan-Feb data shows unprecedented • Expect economic resumption to continue as
weakness, foreshadowing a sharp virus containment makes further progress
contraction in Q1 GDP • Policy easing will continue, although
• New local virus infections fell to zero for the substantive measure will likely be
first time, but imported cases on the rise announced at the NPC in April
• EM assets saw massive outflows. EM equities • Taiwan, Indonesia, Philippines, Turkey and
are now down 20% year-to-date, hard currency Russia central banks to meet. Policy easing
debt spreads widened significantly (above 500bp). ahead.
• EM central banks are using all tools to limit • Chile Q4 GDP is expected to have contracted
the damage towards the real economy: rate as the social unrest likely weighed on both
cuts, liquidity injections and FX interventions. demand and supply.
• Polish CPI rose to 4.7% in Feb, fall in oil price
should grant an upcoming slowdown in trend.
Upcoming US: Tue: mfg, servs, comp PMIs, new home sales; Wed: durable goods orders, FHFA house price index;
events Thu: final Q4 GDP, trade balance, initial jobless claims; Fri: PCE indices, Michigan consumer surveys
Mon: Ez consumer confidence; Tue: Ez, Fr, Ge mfg, servs, comp PMIs; Wed: Ge Ifo surveys, France
Euro Area:
jobseekers total; Thu: ECB economic bulletin; Fri: Fr, It consumer confidence, It business confidence
Tue: mfg, servs, comp PMIs, CBI industrial trends; Wed: CPI; Thu: retail sales, BoE MPC meeting; Fri:
UK:
nationwide house price index
China:
Japan: Tue: mfg, servs PMIs, leading index, BoJ core CPI; Thu: Tokyo CPI
7For professional clients only
Research & Strategy Insights
Our Research is available on line: http://www.axa-im.com/en/insights
DISCLAIMER
This document is for informational purposes only and does not constitute investment research or financial analysis relating to transactions in financial
instruments as per MIF Directive (2014/65/EU), nor does it constitute on the part of AXA Investment Managers or its affiliated companies an offer to buy or sell
any investments, products or services, and should not be considered as solicitation or investment, legal or tax advice, a recommendation for an investment
strategy or a personalized recommendation to buy or sell securities.
It has been established on the basis of data, projections, forecasts, anticipations and hypothesis which are subjective. Its analysis and conclusions are the
expression of an opinion, based on available data at a specific date. All information in this document is established on data made public by official providers of
economic and market statistics. AXA Investment Managers disclaims any and all liability relating to a decision based on or for reliance on this document. All
exhibits included in this document, unless stated otherwise, are as of the publication date of this document. Furthermore, due to the subjective nature of these
opinions and analysis, these data, projections, forecasts, anticipations, hypothesis, etc. are not necessary used or followed by AXA IM’s portfolio management
teams or its affiliates, who may act based on their own opinions. Any reproduction of this information, in whole or in part is, unless otherwise authorised by AXA
IM, prohibited.
This document has been edited by AXA INVESTMENT MANAGERS SA, a company incorporated under the laws of France, having its registered office located at
Tour Majunga, 6 place de la Pyramide, 92800 Puteaux, registered with the Nanterre Trade and Companies Register under number 393 051 826. In other
jurisdictions, this document is issued by AXA Investment Managers SA’s affiliates in those countries.
In the UK, this document is intended exclusively for professional investors, as defined in Annex II to the Markets in Financial Instruments Directive 2014/65/EU
(“MiFID”). Circulation must be restricted accordingly.
© AXA Investment Managers 2020. All rights reserved
AXA Investment Managers SA
Tour Majunga – La Défense 9 – 6 place de la Pyramide 92800 Puteaux – France
Registered with the Nanterre Trade and Companies Register under number 393 051 826
www.axa-im.comYou can also read