Results of the Legal Incubator Lawyers' Survey - April 2021 ABA Standing Committee on the Delivery of Legal Services - American Bar ...
←
→
Page content transcription
If your browser does not render page correctly, please read the page content below
Results of the Legal Incubator
Lawyers’ Survey
April 2021

ABA Standing Committee on the
Delivery of Legal Services
Table of Contents
                                                                                                      TABLE OF CONTENTS
EXECUTIVE SUMMARY ........................................................................................................................ 1
   KEY FINDINGS .................................................................................................................................................2
INTRODUCTION................................................................................................................................... 5
   A. RESEARCH TEAM .........................................................................................................................................7
   B. METHODOLOGY...........................................................................................................................................7
   C. REPRESENTATION AND RESPONSES ..................................................................................................................8
   D. REPORT STRUCTURE .....................................................................................................................................9
I. LAWYER CHARACTERISTICS ............................................................................................................ 10
   A. DEMOGRAPHIC INFORMATION .....................................................................................................................10
   B. LAW SCHOOL EXPERIENCE ...........................................................................................................................13
   C. DECISION TO JOIN THE INCUBATOR ................................................................................................................16
   D. INCOME ...................................................................................................................................................19
   E. WORK LIFE ...............................................................................................................................................20
II. PROGRAM VALUE: RESOURCES AND TRAINING ............................................................................. 23
   A. INCUBATION PERIOD ..................................................................................................................................23
   B. POST INCUBATOR EXPERIENCE ......................................................................................................................28
   C. CAREER SATISFACTION ................................................................................................................................35
III. CLIENT AND COMMUNITY SERVICES ............................................................................................. 38
   A. PRACTICE AREAS........................................................................................................................................38
   B. CLIENT SECTORS ........................................................................................................................................41
   C. BILLING AND COLLECTION PRACTICES .............................................................................................................45
   D. PRO BONO ...............................................................................................................................................47
   E. OTHER CLIENT-RELATED MATTERS ................................................................................................................48
LESSONS LEARNED AND FUTURE OUTLOOK ....................................................................................... 51
CONCLUSION .................................................................................................................................... 54
APPENDIX A: LIST OF INCUBATORS AND THEIR OPERATING ENTITIES BY LAUNCH DATE ..................... 55
© 2021 ABA, CALI, and Luz E. Herrera. The material contained herein is protected by copyright and permission has
been granted for the individual and private use of ABA and CALI members in a manner that is consistent with the
ABA's mission, goals, and activities. All other use is strictly prohibited without prior written authorization from
the author. Prohibited use includes but is not limited to the copying, renting, leasing, selling, distributing,
transmitting or transfer of all or any portions of the material, or use for any other commercial and/or solicitation
purposes of any type, or in connection with any action taken that violates the author's copyright. For information
concerning appropriate use of the material, contact copyright@americanbar.org.
American Bar Association
321 N. Clark Street
Chicago, IL 60654
http://www.americanbar.org
Copyright ©2021 ABA, CALI®, and Luz E. HerreraAMERICAN BAR ASSOCIATION
STANDING COMMITTEE ON THE DELIVERY OF LEGAL SERVICES
CHAIR
Frank “Fritz” H. Langrock
Middlebury, VT
MEMBERS
Catherine B. Arrowood Sungyong “Cheryl” Lee
Raleigh, NC Shoreline, WA
Chad E. Burton Michael W. McKay
Beavercreek, OH Baton Rouge, LA
Stephen J. Curley Cecilia Monterrosa
Stamford, CT South Bend, IN
Dan Jackson Ronald “Ron” C Minkoff
Boston, MA New York, NY
SPECIAL ADVISORS
Lucian T. Pera
Memphis, TN
STAFF
Sarah Glassmeyer, Staff Counsel
Chicago, IL
www.americanbar.org/deliveryExecutive Summary
Legal incubators, also known as law firm incubators, in the United States are designed to help lawyers develop and
launch law practices while expanding access to underserved populations. Based on business incubator models, legal
incubator programs support the creation of new law firms by providing space, mentoring, and training to licensed
lawyers. Most of the law firms produced by these legal incubators are solo or small firms that exist as both for profit
businesses and nonprofit entities. Since the first legal incubator appeared in 2007, over 70 self-identified legal
incubator programs have emerged around the globe.
In 2016, the ABA Standing Committee on the Delivery of Legal Services published a Comprehensive Survey of Lawyer
Incubators that provided data on U.S. legal incubator programs. The 2016 Incubator Program Survey Report found
that all legal incubator programs were not uniform in structure; however, all of them were focused on training new
lawyers to become successful solo and small firm practitioners. It also reported that 80 percent of these programs
encouraged lawyers to establish law practices that addressed the needs of low- and moderate-income individuals.1
That survey revealed an overarching commitment to access to justice by exposing lawyers to flat fee, unbundled
legal services, and sliding scale fees models that are commonly employed to reduce the cost of legal services. The
respondents of the 2016 survey identified training in practice management, ethics, and substantive law as the most
common training areas2 and reported that about two-thirds of their alumni continued to work in solo or small firms
of less than 25 lawyers.3 The study documented valuable lawyer training and contributions to the community,
however, program sustainability was flagged as the most significant challenge to address.4
Our research team launched a survey to understand the impact of these programs on the incubated attorneys in
February 2018. This report documents the responses from that survey which is estimated to have captured more
than 10 percent of the population that participated in legal incubator programs spanning eighteen U.S. states. Since
there is no central depository for qualitative data identifying the lawyers that participate in these programs, this
participant survey provides a fractional overview of the characteristics of the participants, their law practices, and
the perceived benefit of these programs to their professional development.
This report of the results of the legal incubator lawyers’ survey serves several purposes, including:
• Confirming the program-reported data.
• Understanding the characteristics and experience of lawyers who participate in legal incubator programs.
• Measuring the short-term impact of legal incubator programs on the career development of lawyer
participants.
• Gauging the impact of the legal incubator program as a model to address new lawyer training.
1
ABA Standing Committee on the Delivery of Legal Services, 2016 Comprehensive Survey of Lawyer Incubators 3,
https://www.americanbar.org/content/dam/aba/administrative/delivery_legal_services/ls_del_comprehensive_survey_lawy
er_incubators.pdf [hereinafter “Incubator Program Report”], p. 33.
2
Incubator Program Report, p. 26.
3
Incubator Program Report, p. 12.
4
Incubator Program Report, p. 34.
1• Giving lawyer incubator participants a baseline for measuring their experience to see how their
experience compares to others nationwide.
Key Findings
The survey data was collected between February 2018 and February 2019. It engaged 44 lawyers who were
participating in the legal incubator programs at the time of the survey and 70 lawyers who graduated from such
programs. An overview of the key findings is presented here with more detail provided in the subsequent pages.
Lawyer Characteristics: Demographics and Finances
The research team was interested in understanding who was participating in legal incubator programs, why they
chose to do so, and how they were faring financially. The survey revealed information that helps us get a better
glimpse at who is most likely to participate in these programs.
Demographics
The average survey participant was 35 years old. Just under half the respondents reported being married or in a
domestic partnership; 43 percent reported having one or more children. Fifty-one percent of respondents identified
as female and 47 percent as male. White/Caucasian participants were underrepresented compared to their
percentage representation in the legal profession. Participants that identified as Americans of Latino, Black, and
Asian descent were overrepresented compared to their national representation in the legal profession.
Financial Life
More than three-quarters of all participants reported educational debt of $50,000 or more, with six percent of
participants reporting debt higher than $300,000. Current incubator participants reported an average income of
$42,946, while past participants reported an average income of $77,206. For both groups, their primary law practice
was their main source of income, making up 75 percent of current participants’ total income and 78 percent of
former participants’ total income. Sixty-five percent of former participants agreed that they were able to create a
sustainable legal practice while in the incubator. Only a little over half of both sets of participants reported carrying
their own health insurance.
Choosing the Incubator Path: Law School Experience & the Decision to Join
The study also aimed to understand a little about the law school experience of lawyers who join an incubator
program. Researchers found that almost all of the participants worked while attending law school and that almost
three-quarters of the participants engaged in some sort of pro bono activity.
Almost two-thirds of all participants, 73 percent, indicated they joined the incubator to establish a new law firm or
to grow an existing one. Approximately 25 percent indicated that they had previously tried to establish a law
practice; however, many reported that they lacked the substantive knowledge to be successful. Only 5 percent
reported that they joined the incubator because they did not have any other job offers at the time. Twenty-six
percent of the respondents stated they ranked in the top 25 percent of their class.
2Program Value: Work Life, Program Experience and Career Impact
The survey of participants allows comparison between what participants feel they are receiving and what programs
indicated they provide in the 2016 Incubator Survey. In addition to learning about lawyers’ experiences in the
incubator program, the survey revealed information about participants’ work life and the impact of the program on
their career.
Program Experience
Current incubator participants identified hands-on practice experience, mentorship from experienced lawyers, peer
support, and subsidized business costs as the most valuable incubator aspects thus far into the program. Further,
when asked what they thought was important to learn about, billing and collecting received the most “extremely
important” and “very important” responses from current incubator participants, followed by money
management/budgeting and client development and marketing. Nearly half responded that learning about
nonprofit law firms was “not at all important.” The participants marked networking as the area they felt most
prepared in thus far into the program, followed by how to best serve low- and moderate-income clients.
Former incubator participants reported that, first and foremost, the incubator prepared them “extremely well” or
“very well” for networking opportunities. They also indicated that the incubator experience prepared them well for
flat or fixed fee arrangements, communicating with clients, and unbundled/limited scope services. They indicated
that the “most helpful” training areas were in developing business plans, substantive law training, and networking.
More former participants felt that subsidized business costs were ”extremely valuable” than any other feature,
followed by subsidized office space, peer support, and mentorship.
In terms of a pro bono requirement, 56 percent of current incubator participants and 35 percent of former incubator
participants stated that the incubator program required them to provide pro bono service. Former participants
reported that pro bono opportunities were the least valuable feature of the programs.
Work Life
Current incubator participants indicated that they worked an average of 46 hours per week, spending 34 percent
of their time on billable client work and 9 percent on pro bono. Former participants reported a similar work week,
spending 47 percent of their time on billable client work and 8 percent of their time on pro bono. Both groups
indicated that they spent 18 percent of their time on administrative tasks and 25 percent of both groups of attorneys
stated they either took no vacation or less than a week’s vacation.
Career Impact & Satisfaction
A vast majority, 93 percent, of current incubator lawyers indicated that they wanted to continue to grow their
existing solo practice or start a small private firm after they left the program. Approximately 72 percent of former
incubator participants reported that they continued to operate the solo firm they incubated when they left the
program. The majority of both groups reported that they were “extremely satisfied” or “very satisfied” with the
control over their schedules, serving underserved populations, the opportunities to build their skills, and control
over their cases/clients. More than 80 percent of all incubator lawyers expressed satisfaction with their career. Both
groups of participants were least satisfied with their compensation, particularly as it relates to their ability to pay
their bills.
3Clients: Services Provided & Financial Arrangements
The survey also revealed key information about these lawyers’ relationships with clients. Specifically, we asked
about the types of legal work they offer clients and the types of financial arrangements they make.
Services Provided
Both cohorts assigned the largest percentage to family law as an area of practice, followed by criminal law and
estate planning/probate/wills for former participants. For current participants, family law was followed by estate
planning/probate/wills and real estate.
The majority of former participants, 56 percent, reported building a niche practice while only 44 percent of current
attorneys identified with a niche practice. In describing the client focus of these niche practices, the three that
constituted the largest share of their client base were immigrants, elderly, and domestic violence survivors. Further,
both former and current incubator lawyers reported that low- and moderate-income individuals constituted the
majority of their client base while high-income individuals represented only 8 percent of their client base. For both
groups, non-profit organizations or small businesses made up 5 percent or less of their client base. A large majority
of all lawyers surveyed, 93 percent, reported that they carried malpractice insurance.
Client communications
At the time of the survey, only 23 percent of current participants’ client interactions and 22 percent of former
participants’ client interactions took place remotely. For those who had remote client interactions, the primary
mode of communication was email, followed by phone calls and texting. Only six percent of client communications
occurred via an online portal, and only 1 percent were conducted via video-conferencing.5
Financial Arrangements
Many of the incubator participants employed alternative fee structures. Flat fees made up an average of 48 percent
of current incubator participants’ total billing and 44 percent of former participants’ total billing. Hourly rates made
up a roughly equal share. Sixty-five percent of current incubator participants and 58 percent of former participants
reported providing sliding scale fees. More than half of both groups reported that more than 25 percent of their
services were unbundled. Former incubator participants reported that they contributed an average of 10 hours per
month of pro bono services.
Conclusion
The study revealed that legal incubator programs support the career development of lawyers interested in starting
solo and small firm law practices. While these lawyers are generally satisfied with their professional lives, many
indicate significant concern about their financial instability. These lawyers report they provide personal legal
services primary to low- and moderate-income clients. More research is required to understand the long-term
impact of these programs on lawyer participants and the clients they serve.
5
We note that the survey closed just prior to the COVID-19 pandemic erupting in the United States. As such, these numbers
are likely no longer indicative of participants’ current practices.
4Introduction
Legal incubators in the United States first emerged in 2007, just before an economic recession impacted the legal
profession in 2008.6 That recession led to loss of employment opportunities for lawyers7 and increased attention
for legal incubator programs that promised training and mentorship opportunities to recent law school graduates
and new lawyers starting their own law practices.8 While the design of the first lawyer incubator program was
developed to foster career opportunities, it also focused on serving the needs of underserved populations.
The original incubator program, developed at the City University of New York School of Law, was designed to help
lawyers develop and launch law practices while expanding access to underserved populations.9 The first model was
based on an entrepreneurship incubator model that supported new businesses by providing space, mentoring, and
training. A number of subsequently developed legal incubator programs adopted a dual mission – to train lawyers
and to address gaps in legal service delivery for underserved populations. Since the first legal incubator appeared
in 2007, over 70 self-identified legal incubator programs have emerged around the globe – the majority of them in
the United States.10
The Comprehensive Survey of Lawyer Incubators, published by the American Bar Association Standing Committee
on Delivery of Legal Services in 2016 (the “Incubator Program Report”), described these legal incubator programs
as having varied structures and designs.11 Some are organized as support structures that do not pay or provide
sizeable stipends to attorney participants, while others are structured as legal residencies where attorneys receive
a salary or significant compensation.12 That study found that despite their different forms, legal incubator programs
6
Fred Rooney and Stephanie Everette, Legal Incubator Programs: An Emerging Movement, 36 GPSolo 58 (2019),
https://www.americanbar.org/groups/gpsolo/publications/gp_solo/2019/january-february/legal-incubator-programs-
emerging-movement/.
7
Kathryn Rubino, “What the 2009 Layoffs Were Really Like”, Above the Law, Sept. 28, 2016 at 2:00 PM,
https://abovethelaw.com/2016/09/what-the-2009-legal-layoffs-were-really-like/. See also Eli Wald, The Economic Downturn
and the Legal Profession, Foreword: The Great Recession and the Legal Profession, 78 Fordham L. Rev. 2051 (2010). Available
at: https://ir.lawnet.fordham.edu/flr/vol78/iss5/1.
8
Jeremy Nobile, “In the recession’s wake, attorneys increasingly find success on their own,” Crain’s Cleveland Business, July
22, 2017, 12:00 PM, https://www.crainscleveland.com/article/20170722/news/170729949/recessions-wake-attorneys-
increasingly-find-success-their-own
9
Jonathan D. Glater, Lawyers Learn how to be Businesslike, New York Times, January 9, 2008 (discussing the legal incubator at
the City University of New York School of Law),
https://www.nytimes.com/2008/01/09/nyregion/09law.html?partner=permalink&exprod=permalink.
10
The American Bar Association’s Standing Committee for the Delivery of Legal Services has kept track of these programs.
The most recent standing of those programs is listed as Appendix A. The foreign countries where legal incubators were
founded are the Dominican Republic, India, Pakistan, Spain, and Bulgaria. According to the Fulbright consultant on these
projects, Fred P. Rooney, all remain active except the one in the Dominican Republic. Email exchange with Fred P. Rooney on
January 27, 2021 (on file with author).
11
\Incubator Program Report
12
See also Luz E. Herrera, Encouraging the Development of Low Bono Law Practices, 14 U. MD. L.J. RACE, RELIGION, GENDER &
CLASS 1, 29-30 (2014) (noting also that residency programs have experienced attorneys supervising the attorneys’ work where
incubator programs have less supervision and are focused on creating self-sufficient solo and small firm lawyers).
5advance “social responsibility through pro bono services and orientations to low- and moderate-income
populations.”13 Of 46 programs whose responses appeared in the 2016 Incubator Program Survey Report, 69
percent indicated they required the lawyers in their program to provide pro bono services and 53 percent indicated
their programs required attorneys to serve moderate-income clients.14 The Incubator Program Report found that
while a variety of organizations such as bar associations, bar foundations, law firms, and legal aid organizations
participated in organizing these programs, it was law schools that most often took the lead.15
This report adds to our understanding of the approximate 843 lawyers who have participated in legal incubator
programs since 2017.16 Since that report some programs have shuttered or are on the brink of ceasing operations,
but there are new ones that emerged since 2016.17 Program sustainability was identified as a key challenge in the
Incubator Program Report. Of the programs that participated in that survey, 46 percent stated they had annual
budgets that are $50,000/year or less. Only three programs reported budgets of $500K or greater.18 Based on
feedback provided by the incubator program organizers during the course of this study, the current pandemic and
its economic repercussions seem to have impacted the financial support to maintain some of these programs.19
This Incubator Lawyer Report seeks to create a better understanding about the lawyers that join these legal
incubator programs. The survey included attorneys currently participating in these programs and those who had
graduated. Including both groups of lawyers provides a more longitudinal view of these lawyers’ career
development as a group. Prior to this survey, in 2015, the American Bar Association collected personal testimonials
by incubator program participants who discussed the impact of these programs. Those testimonials were compiled
in a video called In Their Own Words.20 Throughout this report, we highlight quotes from lawyers in that video that
provides a more personal dimension to the survey results. This survey offers a quantitative component to those
testimonials.
“The incubator is helping me start my own practice by teaching me what I want to do
and what I don’t want to do. And what I can do as a solo person versus what it would
be probably better left to a firm to do.” - Kate Thomas, Vermont Lawyer Incubator Project, The
Vermont Bar Association and Vermont Law School
13
Incubator Program Report, p. 4. Seven out of ten programs reported pro bono activities as a key feature.
14
Incubator Program Report, p. 30.
15
Incubator Program Report, p. 7.
16
As there is no central depository of incubator participant information, this number is based on reports by program
directors as well as information gleaned from the 2016 Incubator Program Report.
17
For example, the legal incubator at Arizona State University, ASU Law Group, closed its doors in June 2020. However, the
Dallas Bar Association launched a legal incubator program in the fall of 2019.
18
Incubator Program Report, p. 16.
19
There are a number of legal incubator programs, including the incubator at Loyola University New Orleans College of Law
and Thomas Jefferson School of Law in San Diego that have ceased operations during the COVID-19 pandemic, but hope to
resume after the pandemic. Appendix A has a list of the various programs and the status of its operations as far as our
research indicates.
20
See the videos at In Their Own Words,
https://www.americanbar.org/groups/delivery_legal_services/initiatives_awards/program_main/incubator_video/
6The responses of lawyers who participated in legal incubator programs overwhelmingly indicate that these
programs truly serve as training grounds for the solo and small firm bar, and are not a temporary holding pad for
unemployed lawyers as has been previously espoused. Survey participants also provided further insight into the
types of lawyers they train, their practice areas, their billing arrangements, some of the delivery methods they
employ and, most importantly, which clients they serve.
A. Research Team
As a follow up to the 2016 Incubator Program Report, the survey instrument was developed by Sara Smith, principal
author of the 2016 Incubator Program Survey and former Research and Policy Analyst for the ABA Standing
Committee on the Delivery of Legal Services,21 and Luz Herrera, Professor of Law at Texas A&M University School
of Law. A draft of the survey was initially vetted with sociologist Rebecca Sandefur and after incorporating her
feedback, the research team presented the survey instrument to several incubator program directors and low bono
leaders for additional input. Once the survey instrument was complete, the Institutional Review Board (IRB) at Texas
A&M University reviewed the research plan and granted permission to proceed. Shortly after receiving IRB approval,
Briana Morris, former Senior Counsel to the ABA Standing Committee on the Delivery of Legal Services, received
IRB approval and joined the research team.22
B. Methodology
The Institutional Review Board (IRB) at Texas A&M University approved a research plan to send an invitation
through the ABA Incubator Program listserv (“Incubator Listserv”) to directors of self-identified legal incubator
programs. The Incubator Listserv has approximately 370 members that include program directors, incubator
participants, and others interested in incubators. It is managed by the ABA Standing Committee on the Delivery of
Legal Services. The ABA Standing Committee on the Delivery of Legal Services also listed the survey participation
invitation on their website. Because the survey did not capture participants’ name or contact information, all survey
participants were completely anonymous.
The invitation asked directors of legal incubator programs to forward the survey link to “attorneys who are currently
part of, or formerly participated in, a program, a law firm, or a nonprofit that provides services for modest-income
populations.” In order to participate, survey respondents had to be at least 18 years of age. Participation in the
survey was voluntary and respondents could decide not to complete it once they began it. Respondents could also
skip any question they wished. We estimated that it would take a participant approximately 20 minutes to complete
the survey, a copy of which is available on the Standing Committee on Delivery of Legal Services website.
The initial goal was to keep the survey open for two months. However, given the difficulty in locating past
participants due to decentralized participant information, the survey remained active from February 2019 to
February 2020. The research team was initially perplexed about the lack of responses but ultimately, we attribute
the long timeline to transitions of personnel in the research team, lack of experience in social science research
21
Sara Smith is currently the Assistant Director of Curriculum Development at the Center for Computer Assisted Legal
Instruction (CALI).
22
Briana Morris is currently Senior Counsel to the ABA Standing Committee on Lawyer Referral and Information Service as
well as to the ABA Center for Professional Responsibility Publications Board.
7methods, and reluctance from program directors to identify incubator participants and/or distribute the survey to
their participants.23
The survey instrument was organized on the Qualtrics platform and data was stored at the ABA. All of the research
team’s findings are the result of this survey instrument, which was formulated to ask current and former incubator
participants about themselves and their practices, the resources and training they received while in the incubator
program, the clients they served, the services they provided, and their future outlook. Not all participants saw all
of the questions, as some questions were only displayed as a follow-up query to a previous response.
C. Representation and Responses
We received a total of 130 responses but 16 responded “None of the above” to the prompt that asked them to
identify themselves as either a former or current incubator participant and were therefore exited from the survey.
Of the 114 remaining responses, 39 percent identified as current participants in an incubator program, and 61
percent were incubator program graduates. (Fig. 1) There is a drop from the 114 total respondents to 112 as soon
as the fifth question. When responses do not add up to 112, we assume that respondents skipped the question or
stopped taking the survey. This report presents the best information available to the research team. Each figure
includes the number of responses for the question represented. Percentages represent the number of affirmative
responses against the total number of responses received for that question or item within a question, unless
otherwise noted. Further, charts represent responses from both current and former incubator participants unless
otherwise noted.
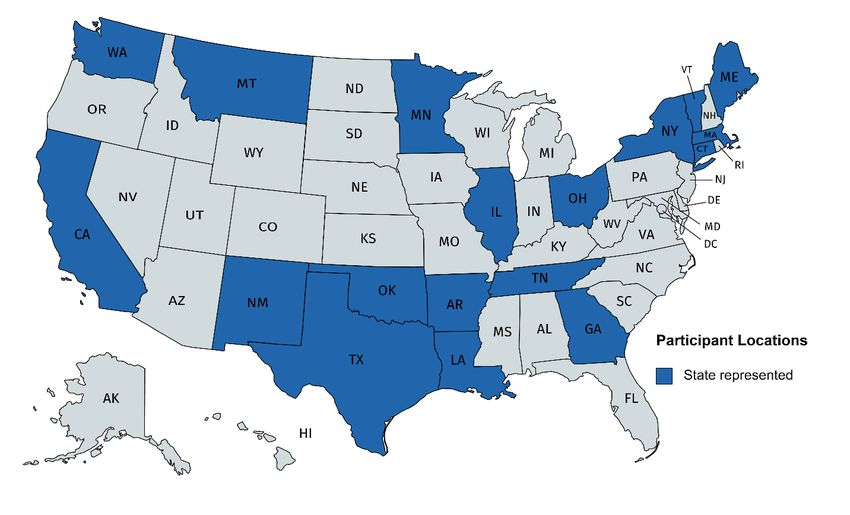
Fig. 1 The survey respondents are located throughout
Survey Participant Status
18 U.S. states, including: Arkansas, California,
Connecticut, Georgia, Illinois, Louisiana, Maine,
Massachusetts, Minnesota, Montana, New
Former incubator Mexico, New York, Ohio, Oklahoma, Tennessee,
participant/alumnus
39% Texas, Vermont, and Washington. (Fig 2) Based
on the known number of 843 lawyers that
61% Current incubator
participant comprise the pool of possible respondents, the
study’s N=114 response rate was approximately
14 percent. The survey does not included
N=114 responses from lawyers outside of the United
States.
23
Some of the feedback we received regarding the lack of participation included objections that the research team did not
embrace more participatory research methods, concerns about having our data gathering conflict with their similar efforts,
and/or time constraints that prohibited key gatekeepers from prioritizing our research.
8Fig. 2. Created with mapchart.net
D. Report Structure
Part I, Lawyer Characteristics, presents demographic information in addition to some information that provides a
better understanding of these lawyers’ educational experience and their motivation for joining an incubator. This
part also includes information about the lawyers’ income and their practice infrastructure including workload,
salary, and related information. Here, the findings of all participants combined seem more appropriate but there
are some areas that require a discussion of differences found between current and former incubator program
participants.
Part II, Program Value: Resources and Training, offers the incubated lawyers’ views about the value of the resources
and training they receive(d) from their program. This part asked them to identify the resources and training
provided during their incubation period. It also asked former participants to evaluate the value of program offerings
that continue to be helpful in their practice.
Part III, Client and Community Services, presents the findings on what client populations these incubator lawyers
reported serving. It discusses their practices areas, their fee and billing arrangements, and their ongoing pro bono
commitments. It also reports on their use of technology for remote communication.
The report ends with Learned and Future Outlook, which proposes next steps in data collection efforts and discusses
the impact of COVID-19 on incubators, law practice generally, and the need for affordable legal services.
9I. Lawyer Characteristics “
The 2020 ABA Profile of the Legal Profession (the “2020 ABA Profile”) indicated, among other things, that the
average lawyer in the United States is a 47.5 year old white male.24 One of the primary purposes for this survey was
our interest in knowing whether the demographics of legal incubator programs were the same. To that effect, the
survey asked lawyers to report on basic demographic characteristics including age, gender, and race or ethnicity. It
also asked about elements of their law school experience that may have contributed to their decision to participate
in an incubator, including details about engagement in pro bono work prior to joining the incubator and educational
debt incurred. This section captures the responses given about motivation and employment status at the time they
applied to and joined an incubator program, and it offers insight into the reported and projected salaries of current
and former incubator participants. A final element of lawyer characteristics captured by the survey and presented
in this section is their law practice infrastructure, including information about their workload, vacation time, and
career satisfaction.
A. Demographic Information
Unlike the 2020 ABA Profile, the majority of the respondents to this question identified as part of the 25-45 age
group. (Fig. 3) The youngest survey participants were 26 years of age and the oldest was 66 years of age. The median
age was 35. This is well below the national legal professional median age of 47.5, which was reported in 2019. 25
(Fig. 4)
Fig. 3 Age - This Study Fig. 4 Age - U.S. Lawyers 2019
8% 1% 15%
25-35 19%
7% 25-34
36-45 35-44
46-55 18% 45-54
54% 56-65 55-64
30% 25%
Over 65 65 and over
23%
N=10
5
Further, 51 percent of respondents identified as female, 47 percent identified as male, and 2 percent identified as
other or preferred not to say. (Fig. 5) The proportion of women to men far exceeded the numbers included in the
24
American Bar Association, ABA Profile of the Legal Profession 2020, p. 32-35,
https://www.americanbar.org/content/dam/aba/administrative/news/2020/07/potlp2020.pdf [hereinafter “Legal Profession
Profile”]
25
Legal Profession Profile, p. 35.
102020 ABA Profile, which reported that only 37 percent of lawyers were women.26 (Fig. 6) One possible cause for the
overrepresentation of women in legal incubator programs may be due to greater gender parity in recent law school
graduating classes. In 2019, the ABA Section on Legal Education and Admission to the Bar reported that there were
7,620 more female law students than male students.27 The trend toward parity in gender of law school students
can be traced back to the turn of the 21st century when the number of female law students reached 49 percent.28
Fig. 5 Fig. 6
Gender - This Study Gender - U.S. Lawyers, 2020
1% 1%
Female
Male Female
37%
47% 51% Other
Male
Prefer not 63%
to say
N=112
Similar to the makeup of the legal profession as a whole, 64 percent of respondents identified as White, 12 percent
as Black or African American, 6 percent as Latino/Hispanic American, and 3 percent as Asian American. There were
also 8 percent of respondents that indicated they were of mixed race and 2 percent identified as other. Of the 112
who answered this question, 5 percent indicated they did not identify by race and ethnicity. (Fig. 7)
Fig. 7 Race/Ethnicity
2% White
5%3%
Black/African American
6%
Multiple
8% races/ethnicities
Latino/Hispanic
American
12% I don't identify this way
64%
Asian/Asian American
Other
N=112
26
Legal Profession Profile, p. 32.
27
Legal Profession Profile, p. 58.
28
Id.
11The 2020 ABA National Lawyer Population Survey reported that White men and women are overrepresented in the
legal profession. Non-Hispanic White men and women comprised 60 percent of the population in 2019 but the
same group represents 86 percent of all lawyers in 2020. People of color are more adequately represented in
incubators than in the legal profession but all groups, except for Whites, are underrepresented compared to their
percentage of the U.S. population. (Fig. 8)
Fig. 8 Race/ Ethnicity Comparison to U.S.
Incubator
Racial or U.S. U.S. Lawyer
Survey
Ethnic Group Demographics29 Demographics30
Participants
White 76.3% 86% 64%
Hispanic 18.5% 5% 6%
Black 13.4% 5% 12%
Asian & Pacific Islander 6.1% 2% 3%
Native American/American Indian 1.3% 0.4% ---
Mixed 2.8% 2% 8%
Other/Don’t Identify This Way --- --- 7%
Prior research on solos suggests that many solo and small firm lawyers are immigrants, children of immigrants, or
first generation professionals.31 We therefore asked participant about whether their parents or grandparents were
attorneys and also asked if they, their parents, or grandparents identified as immigrants. Ninety-one percent of all
respondents indicated that they were born in the United States. Twenty-four percent stated that at least one of
their parents were born outside of the United States. Only six percent indicated that a grandparent was an attorney
and only seven percent indicated that one of their parents was an attorney. Data from the American Community
Survey tells us that in 2019, 9 percent of all lawyers in the U.S. were foreign-born.32
When asked about their marital status, 49 percent responded that they were either married or in a domestic
partnership. Forty-three percent were never married, 7 percent were divorced and 1 percent stated they were
widowed. (Fig. 9) That same group of respondents indicated that 57 percent did not have children. From the group
29
Estimates of American Community Survey data for 2019-20, https://www.census.gov/quickfacts/fact/table/US/PST045219,
the Census 2020 data is due to be released no later than April 1, 2021.
30
Legal Profession Profile, p. 34.
31
JEROME E. CARLIN, LAWYERS ON THEIR OWN 17-18 (1962).
32
A special thank you to Alisha Kerchoff and Ethan Michelson who ran data to determine the most recent numbers of
foreign-born attorneys. For data from 2000 to 2012, please see Michelson, Ethan (2015) "Immigrant Lawyers and the
Changing Face of the U.S. Legal Profession," 22 Indiana J. of Global Legal Studies 105, 108 (2015). Available at:
https://www.repository.law.indiana.edu/ijgls/vol22/iss1/6.
12with children, the median and average number of children was 2. Seventeen of the 48 respondents to this question
stated they had one child, and one identified as a parent of 5.
Fig. 9
Marital Status
2% 1%
7%
Married
Never married
Divorced
47%
Domestic partnership
43% Widowed
N=112
B. Law School Experience
The survey also sought to determine how various elements of respondents’ law school experience impacted their
decision to enter a legal incubator program. As such programs often have an extensive pro bono component, the
survey asked about a participant’s engagement with pro bono during law school, their class rank, their employment
status during law school, and their educational debt after completing their JD degree.
Eighty-one respondents cited pro bono programs, clinics, and fellowships as sources of their pro bono engagement
as law students.33 Over half of the respondents who engaged in pro bono while in law school did so in a prop bono
or public interest clinic as a student, and just under half did so in a voluntary pro bono program as a volunteer. The
question permitted respondents to choose all that apply, so some reported that they participated in more than one
activity. The question did not provide an option for those who did not engage in any pro bono, but based on the
reduced number of responses between this question and the next, we conclude that 26 percent of the respondents
did not engage in pro bono activities during law school.34 (Fig. 10)
33
The survey did not provide a “None” or “Other” category. We assume that the total number of respondents would be 110,
based on the number of respondents who answered the previous question.
34
The 2019 Law Student Pro Bono Hours Survey administered by the Association of American Law Schools reported that law
students perform about 221 hours of pro bono work during law school through experiential activities ( including clinics,
externship, pro bono projects, and other experiential classes), 2019 AALS Law Student pro Bono Hours Survey Report,
https://www.aals.org/aals-newsroom/2019-aals-law-student-pro-bono-hours-survey-report/.
13Fig. 10 Pro Bono Participation in Law School N=81
57%
47%
26%
21%
15%
Pro Bono or Public Voluntary Pro Bono None Student-Run Pro Bono Pro Bono or Public
Interest Clinic (as a Program (as a or Public Interest Interest Fellowships (as
student) volunteer) Group (as a member) a recipient)
Furthermore, 84 percent of respondents indicated that
Fig. 11 Worked During Law School
they worked during law school. (Fig. 11) This is significantly
higher than the 57 percent of all law school students who
the ABA indicates worked in 2016.35 Of that those who
16% Yes, in a law-related
indicated they worked, sixty-nine percent of survey position
respondents stated that they worked in a law-related
Yes, unrelated to
position during law school. Only 15 percent of them 10% the law
worked a job that was unrelated to law. While we did not
59% Yes, both
inquire as to the income produced through any of this
employment, many of the positions included in the 15
15%
No
percent were professional jobs including positions in the IT,
medical, insurance, and real estate arenas. Others worked
N=112
in retail and hospitality and at least 1 participant was a first
responder.
35
Legal Profession Profile, p. 27,
https://www.americanbar.org/content/dam/aba/administrative/news/2020/07/potlp2020.pdf.
14Another point of inquiry was class rank.
Fig. 12 Law School Class Rank Twenty-six percent of the responses stated
they ranked in the top 25 percent of their class.
Bottom 25% Another 11 percent responded that they
5% 11%
4% ranked in the bottom 25 percent of the class.
Middle 50% Fifty-four percent responded that they were in
the middle in their class. Sixteen percent did
Top 25% not report their rank citing that either their
26%
“law school did not rank” or they preferred not
My law school did to state their rank. (Fig. 12) These findings
not rank. indicate that the majority of the students who
I prefer not to say. participate in legal incubators are average
54% students, not necessarily the lowest ranked as
some critics of legal incubator programs often
N=109 assume.
The survey also asked about respondents’
Fig. 13 Educational Debt educational debt. A surprising 16 percent
indicated they had no education debt while
6% another 8 percent indicated less than $50,000.
16% None
One quarter of the 111 respondents indicated
Less than debt burdens between $50,000 and $150,000,
8% $50K
and 45 percent indicated educational debt
$50-$150K
between $150,000 and $300,000. Six
45% $150-$300K respondents, or 6 percent of the pool,
disclosed educational debt over $300,000. (Fig.
Over 300K
13) By comparison, the National Center for
25%
Education Statistics at the U.S. Department of
Education reported that the average
N=111 cumulative student debt for lawyers was
36
$145,500. Further, the ABA Reports that in 2016, 29 percent of all law school graduates did not borrow money
for law school.37 However, only six percent of attorneys who participated in that study indicated they had no debt.
36
Legal Profession Profile, p. 27.
37
Legal Profession Profile, p. 28, Only six percent indicated they had no debt.
15The follow up question for those who
Fig. 14 Loan Repayment Plan indicated they had some educational debt
inquired about how they were re-paying it.
2% Income-Based
5%2% Repayment
Only 11 percent of these lawyers indicated
Deferred Repayment they were on standard loan repayment
9% plans. Sixty-seven percent indicated they
Standard Repayment were on some type of income-driven
11% repayment plan – 56 percent on an Income-
Pay As You Earn
Repayment Based Repayment Plan, 9 percent on a Pay
56% Graduated Repayment As You Earn Repayment Plan (PAYE Plan),
and 2 percent on an Income-Contingent
15% Income Contingent
Repayment plan. Five percent of
Repayment
Other respondents indicated they were on a
Graduated Repayment Plan, and 15
N=87
percent had deferred payments. (Fig. 14)
C. Decision to Join the Incubator
Key to understanding who incubators appeal to is the motivations that lawyers have to join them. The majority of
respondents, 73 percent, said they joined an incubator primarily because they were interested in starting or growing
a solo or small law firm. Twelve percent of the respondents indicated they joined because they wanted to assist
low- and moderate-income clients in gaining access to legal services. Only 5 percent cited the primary reason for
joining an incubator as not having any other job offers at the time, and only four percent cited dissatisfaction with
an existing job and wanting to try something new as the primary reason. (Fig. 15)
Fig. 15 Primary Reason for Joining Incubator
2% To establish a new solo or small-firm practice
4%
4%
To grow an existing solo or small-firm
5% practice
To help low and moderate-income clients
gain access to legal services
12%
Because I did not have any other job offers at
52% the time
Because I was dissatisfied with work at the
time and wanted to try something new
To gain skills in order to become more
21% marketable to other employers
Other
N=91
16“I wanted to be in the incubator because I wanted to help people and
have the opportunity to work with the community.” - Cory H. Morris,
Community Justice Center, Touro Law Center
Thirty-eight percent of survey participants
Fig. 16
stated they were already trying to start a solo Job Status upon Application
practice when they joined the incubator. Solo practice
Twenty-four percent indicated that they were 1%
6% 2% Full-time - JD required
in full-time jobs where a law degree was
7%
required, which is distinguished from solo Unemployed
practice for the purposes of this study. 8% 38% Law student
Thirteen percent were employed in a position
which did not require a JD. In stark contrast to Full-time - no JD
required
common tropes, only 14 percent said they 14% Part-Time - no JD
were unemployed when they applied to the required
Part-time - JD required
legal incubator program. Eight percent
applied to the program as law students. (Fig. 24% Other
16) N=90
To give more context to these responses, we
Fig. 17
asked those who were employed full-time JD Required Job upon Application - Work
where a law degree was required to choose Setting
the option that best described their primary
work setting when they applied. Of those who Private firm
were working full-time jobs with a JD 4% 5%
Legal nonprofit
required, 36 percent were working at private 14%
firms and 27 percent were working at legal 36% Corporate/Business
nonprofits. Others indicated that that they Government
were working for a corporation or business or 14%
for a government entity, and to a lesser Contract work
extent, doing contract work for other lawyers Educational institution
or working for an educational institution. (Fig. 27%
17) All who worked in law firms, with one N=22
exception, worked for law firms of less than
100 attorneys. (Fig. 18)
17When asked when they had Fig. 19 Years Out of Law School upon Application N=83
applied to the incubator
program, 75 percent of 52%
respondents indicated that
they applied to the incubator
program within two years of 23%
13%
graduating from law school. 6%
(Fig. 19) 2% 1% 2%
Less than 1 1 to 2 3 to 4 5 to 6 7 to 8 9 to 10 Over 10
The survey also asked
participants whether they had Number of Years. Ranges include 1/2 years, e.g., 1 to 2 includes 2.5
ever tried to establish a law
practice before joining the incubator. One-quarter of the 88 respondents responded affirmatively that they had. Of
the 22 who had tried to establish a practice before joining the incubator, they identified the lack of substantive law
knowledge as the biggest challenge followed by isolation or not having a support system and not being able to make
significant income. The expense of space and other overhead, marketing and getting clients, and lack of business
experience were also cited by some as being challenging. Respondents found collecting fees and administrative
tasks the least challenging among the options provided. (Fig. 20)
Fig. 20
Top 3 Biggest Challenges Trying to Establish a Law Practice
Lack of substantive law knowledge 6 3 1
Isolation/No support system 5 4
Not enough/unstable income 3 4 3
Office space/overhead too expensive 3 3 4
Marketing and getting clients 2 3 5
Lack of business experience 2 2 6
Collecting fees 1
Administrative tasks too time consuming 3 2
Count
Biggest Challenge Second Biggest Challenge Third Biggest Challenge N=22
18D. Income
Considering average educational debt and the cost of living, a common question that arises about the lawyers in
these programs is whether the law practices they build generate sufficient income to make them sustainable. To
begin to shed light on this question, the survey asked respondents to report their gross income from all employment
sources in the most recent fiscal year.
The responses generated an average income of $42,946 with a median of $35,000 for lawyers who were
participating in legal incubator programs. Former incubator program participants indicated an average salary of
$77,206, with a median of $65,000. For both sets of attorneys, the lowest income level reported was $0. The
maximum reported was $350,000 for current participants and $370,000 for former participants. (Fig. 21) Since the
question permitted lawyers that had not completed a fiscal year to project responses, we found that 66 percent of
current and 27 percent of former incubator participants reported income projections. As a point of comparison, the
National Association of Law Placement reported a median salary of $58,000 for attorneys in law firms of ten lawyers
or less.38
Fig. 21 Pre-tax/Gross Income from All Employment Sources
Status Average Median Min Max
Current (n=29) $42,946 $35,000 $0 $350,000
Former (n=55) $77,206 $65,000 $0 $370,000
All (n=84) $65,378 $50,000 $0 $370,000
We asked survey participants to identify the sources of income by assigning an approximate percentage of their
total income to each option that included: “primary law practice,” “other law-related employment,” or “other non-
law job.” The responses indicate that both current and former participants are relying on their primary law practice
as the principal source of their income. Current participants in legal incubator programs indicated that, on average,
75 percent of their income came from their primary law practice and 23 percent came from other law related work,
including contract work. A job that did not require a law degree was the source of only 2 percent of their income.
Former incubator lawyers indicated that, on average, 78 percent of their income came from their primary law
practice and 14 percent came from other law related work, including contract work. For former participants, a job
that did not require a law degree was the source of 8 percent of their income. (Fig. 22)
38
Employment Report & Salary Survey reports/Jobs & JDs reports for the Classes of 1993-2017,
https://www.nalp.org/1018research.
19Fig. 22
Sources of Income
Average Percent 75% 78%
23%
14%
2% 8%
Primary law practice Other law-related employment Other non-law job
(e.g., contract work, coverage)
Current Former N=86 (30 current & 56 former)
While the primary source of income for both current and former participants was from their primary law practice,
neither group collected all of the fees for the work they performed. On average, individuals who had graduated
from these programs had a more successful fee collection rate than current participants. Current incubator
participants reported collecting 71 percent of the fees they billed while former incubator participants reported
collecting 81 percent of the fees they billed. (Fig. 23) Overall, both groups combined reported an average of 77
percent and a median of 85 percent of fees collected when billed.
Fig. 23 Percentage of Fees Collected
Status Average Median Min Max
Current (n=34) 71% 80% 0% 100%
Former (n=55) 81% 90% 0% 100%
All (n=89) 77% 85% 0% 100%
E. Work Life
Some of our questions sought to understand not only the attorneys, but also the practices they built. Their answers
reveal key elements that help us understand these attorneys’ workload, their decision to obtain insurance, and the
amount of time they devote to vacations.
Current incubator participants indicated they worked an average of 46 hours per week. The minimum hours
reported were 20 hours and the maximum were 100 hours. Former incubator participants said they worked on
average 43 hours per week. The minimum number of hours they reported working were 10 and the maximum was
75 per week. (Fig. 24)
Fig. 24 Number of Hours Worked per Week
Status Average Median Min Max
Current (n=34) 46 45 20 100
Former (n=63) 43 40 10 75
All (n=97) 44 40 10 100
20As a further probe to understand these attorneys’ work lives, we asked them to account for the time spent on
various work-related tasks by assigning an approximate percentage of their total time to each task. Participants
reported that they spent the most time on billable work. Former incubator lawyers reported spending an average
of 47 percent of their time on billable work while current incubator participants spent an average of 34 percent of
their time on billable work. After billable work, both sets of attorneys recorded spending the second most time on
administrative work, with an average of 18 percent of their time allocated to those tasks. Marketing received the
least allocation of time with both current and former incubator attorneys allotting only 3 percent of their time, on
average, to that task. Both current and former participants recorded spending a similar amount of time on pro
bono,39 business development, networking, training and education, and marketing. The difference is that current
incubator participants spent an average of 11 percent of their time on consulting or contract work, and that number
is only 4 percent for former incubator lawyers. “Other” responses included allocations for intake calls, waiting for
new business, court-appointments, crypto research, fundraising, contingency client work, government committees,
non-legal work, legal work, and public work. (Fig. 25)
Fig. 25
% Time Spent on Work-Related Tasks
Paying client work 34%
47%
Administrative work 18%
18%
Pro Bono 9%
8%
Business development 10%
8%
Other 3%
6%
Consulting or contract work 11%
4%
Networking 5%
4%
Training/Continuing Education 6%
4%
Marketing 3%
3%
Average Percent
Current Former
N=96 (37 current & 59 former)
39
According to the ABA Standing Committee on Pro Bono & Public Service, solo practitioners are amongst the lawyers who
report providing the most pro bono hours annually (44.7 hours). ABA Standing Committee on Pro Bono & Public Service,
Supporting Justice: A Report on the Pro Bono Work of America’s Lawyers 33 (2018) (“Pro Bono Report”),
https://www.americanbar.org/content/dam/aba/administrative/probono_public_service/ls_pb_supporting_justice_iv_final.a
uthcheckdam.pdf.
21You can also read