Review of Technical Assessment and Role of Off-Cycle Credits
←
→
Page content transcription
If your browser does not render page correctly, please read the page content below
Midterm Evaluation of the 2022-2025 Light Duty GHG Standards
Review of Technical Assessment
and Role of Off-Cycle Credits
Kevin Bolon, Ph.D.
 National Vehicle and Fuel Emissions Laboratory
 Office of Transportation and Air Quality
 U.S. Environmental Protection Agency

ITB Advanced Thermal Management, Novi MI
April 27, 2017

Overview
How the EPA GHG Standards Work
GHG Program Flexibilities
Progress-to-Date and Contribution of Flexibilities
What Might the 2025 Time-Frame Look Like
– EPA assessment (thus far)
U.S. Environmental Protection Agency – OAR-OTAQ 2
How the EPA standards work

                             3
Footprint-based CO2 Target Curves for Trucks – “The Standards”
[separate footprint curve for Cars]

                                                                                              Chevy Silverado

                                                                                                                      Ford F-150

                                                Toyota Sienna

                            Nissan Murano

          Buick Encore

                                                                                                  With a shift from
                                                                                                   cars to SUVs &
                                                                                                 trucks, the OEM’s
                                                                                                 standard becomes
                                                                                                    less stringent

                                            U.S. Environmental Protection Agency – OAR-OTAQ                                   4
So What is the 2025 EPA Standard?
 Projections for Model Year 2025 Fleet CO2 Compliance Target
Fuel Prices/Fleet Mix Affect EPA’s PROJECTION of 2025 Standard
                           2012           Summer 2016                  Fall 2016
                         Projection        Projection                 Projection

       Fuel Price
                           $3.87                $2.95                    $2.97
        ($/gallon)
                                                                                           These are industry
      Car/truck mix       67/33%               52/48%                   53/47%             compliance values.
                                                                                         For consumers, the 2025
      2025 Fleet CO2                                                                    average real-world value is
     Compliance Level       163                   175                      173
       (g/mi, 2-cycle)
                                                                                              ~ 36 MPG

         MPG-e             54.5                  50.8                     51.4
         (2-cycle)

                                      U.S. Environmental Protection Agency – OAR-OTAQ                           5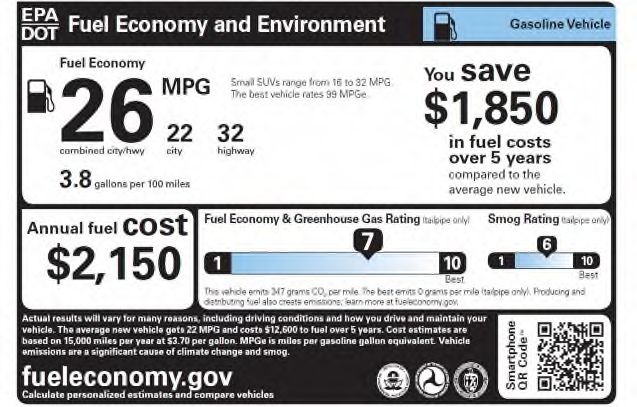
GHG Program Flexibilities

                            6
Compliance Determination with Credit Banking and Trading

•   Assist manufacturer planning and phase-in
    of GHG-reducing technologies, consistent
    with typical redesign cycles

•   Unlimited credit transfer across car and
    truck fleets

•   Unlimited credit trading between
    manufacturers

•   5-year credit carry-forward, with one-time
    early credit carry forward of CO2 credits
     •   MY 2010 and later credits can be carried forward
         to MY 2021

•   3-year credit carry-back
                                     U.S. Environmental Protection Agency – OAR-OTAQ   7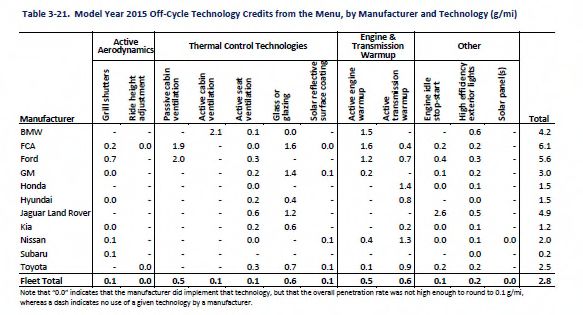
Off-cycle Credits

Overview
    • Technologies that achieve real-world GHG reductions, but are not captured on 2-cycle
       city/highway tests
    • List of a subset of technologies and pre-approved credit levels (e.g., active
       aerodynamics, high efficiency lighting, solar panels) beginning in MY 2014
    • Manufacturers may apply for more credits or other technologies based on sufficient
       data
Three-pathways for obtaining off-cycle credits
    • Defined Technology List
    • 5-cycle test comparison
    • Alternative demonstration method, requiring:
       – modeling, data collection, or other analytical or engineering method
       – verifiable demonstration with strong statistical significance
       – applicability over wide range of driving conditions and number of vehicles

                                     U.S. Environmental Protection Agency – OAR-OTAQ    8
Off-Cycle Credit Defined Technology List

                                  Technology                                                Cars (g/mi)     Trucks (g/mi)
High Efficiency Exterior Lights (at 100 watt savings)                                            1.0               1.0
Waste Heat Recovery (at 100W)                                                                    0.7               0.7
Solar Panels (based on a 75 watt solar panel);
       Battery Charging Only                                                                     3.3               3.3
       Active Cabin Ventilation and Battery Charging                                             2.5               2.5
Active Aerodynamic Improvements (for a 3% aerodynamic drag or Cd reduction)                      0.6               1.0
Engine Idle Start-Stop;
       w/ heater circulation system                                                               2.5               4.4
       w/o heater circulation system                                                              1.5               2.9
Active Transmission Warm-Up                                                                       1.5               3.2
Active Engine Warm-up                                                                             1.5               3.2
Solar/Thermal Control                                                                         Up to 3.0          Up to 4.3
Total Theoretical Credits; Non-Hybrid Vehicles (Ignores synergistic effects)                     10.8              17.8
                           HEVs/PHEVs/EVs (Ignores synergistic effects)                          14.1              21.1
Credit Cap                                                                                  10 (fleet-wide car/truck average)

                                          U.S. Environmental Protection Agency – OAR-OTAQ                                9
Off-Cycle Credit Defined Technology List:
Solar/Thermal Control Technology Credit Values

                                                        Credit for Cars              Credit for Light Trucks
         Technology

                                                               g/mi                           g/mi
                      Glass or Glazing                      Up to 2.9                      Up to 3.9
             Active Seat Ventilation                            1.0                           1.3
               Solar Reflective Paint                           0.4                           0.5
           Passive Cabin Ventilation                            1.7                           2.3
            Active Cabin Ventilation                            2.1                           2.8
           Total Theoretical Credits:                           8.1                           10.8
                          Credit Cap:                       Up to 3.0                      Up to 4.3

                                   U.S. Environmental Protection Agency – OAR-OTAQ                             10
Air Conditioning Improvement Credits
Low-Leak Components (reduce HFCs) Improved System Efficiency (reduce CO2 &
fuel consumption)
Low-permeation,
Seal washers barrier hose
Variable compressor + Improved blower
Alternative Refrigerants (reduce HFCs) reduced reheat motor controls
R-744 (CO2)
R-152a
HFO-1234yf
2005
U.S. Environmental Protection Agency – OAR-OTAQ Audi A4 11Progress-to-Date and
Contribution of Flexibilities
12Vehicle CO2 Emissions at Record Low –
every major vehicle category improving
All values All values
Real world Real world
MY2015: 358 g/mi CO2 (24.8 mpg)
Truck SUVs highest % improvement since 2004, up 33%
MY 2016 Projected : 25.6 mpg
Pickups improved most in past year, up 0.8 mpg to 18.8 mpg
U.S. Environmental Protection Agency – OAR-OTAQ 13Automakers Adopting a Wide Array of Technologies at Rapid Rates
GDI use on nearly half of all
vehicles (up from 3% in MY2008),
with Mazda at 100%, 6 more
OEMs above 75%
~20% fleet use 7+
speed
transmissions, led by
Mercedes, BMW, and Fiat-
Chrysler
>20% fleet use CVTs, led by
Subaru, Nissan, and Honda
U.S. Environmental Protection Agency – OAR-OTAQ 14Early Years of Program Producing Positive Results
Industry Outperforming Standards 7 Years of Sales Increases Thru 2016
First Time in 100 Years
U.S. Environmental Protection Agency – OAR-OTAQ 15What Happens to the Over Compliance?
GHG Program is a Multi-Year Program, multiple layers of flexibility for OEMs
• No single year determines compliance.
• Program includes emissions banking and trading
• Credits last at least 5 model years, and early credits last longer.
• Debits can be carried forward for 3 model years.
• Today, the bank is 280 Million Megagrams CO2
o What’s a Megagram?
o 280M worth about 80 grams CO2/mile for the entire U.S. fleet
o Would allow the MY2015 fleet to comply with EPA standards through 2019, if all firms
participated fully in credit trading
o Through MY2015, 12 OEMs involved in credit trading
U.S. Environmental Protection Agency – OAR-OTAQ 16MY2015 Credits: Off-cycle
Source: US EPA, “Manufacturer Performance Report for the 2015 Model Year” EPA-420-R-16-014, November 2016
U.S. Environmental Protection Agency – OAR-OTAQ 17MY2015 Credits: A/C Leakage and Efficiency
Source: US EPA, “Manufacturer Performance Report for the 2015 Model Year” EPA-420-R-16-014, November 2016
U.S. Environmental Protection Agency – OAR-OTAQ 18What might 2025 look like:
EPA technical assessment
(thus far)
19EPA’s Assessments are Informed by a Wide Range of Information
Technical research performed by EPA
o Benchmarking testing of 30 vehicles across wide range of powertrains & segments (with more to come)
o Published more than 30 peer-reviewed papers and technical reports
o Vehicle simulation modeling, cost teardown studies, mass reduction feasibility/cost studies, manufacturer
“learning by doing” costs, research on consumer issues, economic inputs, others
Extensive reviews of the literature
o 100’s of reports/papers from the literature published since 2012, including major studies such
as the 2015 National Academy of Sciences report
Stakeholder outreach & collaboration
o Hundreds of meetings with automakers, suppliers, NGOs, consumer groups, labor, states/local
governments, others
o Collaboration with NHTSA, CARB, DOE, Transport & Environment Canada
U.S. Environmental Protection Agency – OAR-OTAQ 20EPA’s National Vehicle and
EPA technical information available to Fuel Emissions Laboratory
Ann Arbor, MI
all stakeholders/public
Wide range of peer-
reviewed publications
and presentations:
• Technical papers,
including SAE papers
and EPA reports
• Conference
presentations
• Modeling workshop
Modeling and
Simulation
+ more …
U.S. Environmental Protection Agency – OAR-OTAQ 21EPA Most Recent Assessment of MY2025–
Standards can be Met Mostly with Advanced Gasoline Technologies
Cost estimate of $875/vehicle One possible pathway EPA modeled
Advanced engines and transmissions
Vehicle light-weighting
Improved aerodynamics
More efficient accessories
Low rolling resistance tires
Stop-start technology
Mild hybrid (e.g., 48 volt systems)
Small levels of strong HEV, EV, PHEV
2.7 g/mi Off-cycle Credits
21.4 g/mi A/C Credits
Fuel Savings Offsets Cost increase
Net lifetime savings of $1,650
U.S. Environmental Protection Agency – OAR-OTAQ 22EPA’s Reconsideration of the MTE Final Determination
March 15, 2017 - EPA Administrator Pruitt issued a Notice announcing he will
reconsider the EPA Final Determination published in January 2017:
“ … EPA has concluded that it is appropriate to reconsider its Final
Determination in order to allow additional consultation and coordination with
NHTSA in support of a national harmonized program.”
“In accord with the schedule set forth in EPA’s regulations, the EPA intends to
make a new Final Determination regarding the appropriateness of the MY
2022-2025 GHG standards no later than April 1, 2018.”
U.S. Environmental Protection Agency – OAR-OTAQ 23EPA’s National Vehicle and
EPA Continues its In-depth Evaluation of Fuel Emissions Laboratory
Ann Arbor, MI
Advanced Powertrains
Component benchmarking efficiency maps:
• MY2016 Mazda CX-9 2.5 liter GDI-turbo-charged w/ 6-speed AT
• MY2016 Honda Civic 1.5 liter GDI-turbo-charged 10.6:1 w/ CVT
Vehicle level benchmarking:
• MY2016 Acura ILX w/dual-clutch transmission with torque converter
• MY2017 Ford F150 w/10 speed AT
• MY2016 Chevy Malibu w/1.5 liter GDI-turbo-charged w/ 6-speed AT
Demonstration and Modeling:
• Demonstration of cooled EGR on a modified European Mazda 2.0 liter GDI-naturally
aspirated 14:1 CR engine
• GTPower modeling of a MY2012 PSA 1.6 liter GDI-turbo-charged engine with cooled EGR
and an advanced turbo
• GTPower modeling of a MY2016 Honda Civic 1.5 liter GDI-turbo-charged 10.6:1 CR engine
Modeling and
• ALPHA model comparison of several CVTs Simulation
• ALPHA modeling of all vehicles included in above component and vehicle benchmarking Modeling and Simulation
U.S. Environmental Protection Agency – OAR-OTAQ 24Additional EPA Work Underway in Many Areas
Technology cost teardowns with FEV: modern GDI turbo-downsized engine, advanced diesel engine, CVT
Updates to OMEGA cost-effectiveness optimization model and ALPHA full vehicle simulation model
Ongoing work to evaluate the willingness to pay (WTP) for vehicle attributes (e.g., power, fuel economy, size, etc).
o Our review of 50+ papers from the last 20 years found very wide variation in these WTP values.
Ongoing work evaluates what factors may contribute to this variation.
Ongoing evaluation of automotive reviews of MY2015 vehicle fuel efficient technologies
o Building upon EPA’s study of MY2014 vehicles, we continue to find that positive evaluations for all technologies (70%)
exceed negative evaluations of the technologies (18%)
Ongoing work to evaluate the vehicle miles traveled (VMT) rebound effect
Collaboration with Transport and Environment/Climate Change Canada on mass reduction and aerodynamics
Continued evaluation of the vehicle fleet each year to assess technologies, emissions, and compliance
– supporting EPA’s forth-coming MY2016 Manufacturer GHG Performance Report and
2017 CO2/Fuel Economy Trends Report
U.S. Environmental Protection Agency – OAR-OTAQ 25Appendix
26Global Passenger Car CO2 Standards
Source: International
Council for Clean
Transportation.
http://www.theicct.org/blogs/staf
f/improving-conversions
between-passenger-vehicle
efficiency-standards
U.S. Environmental Protection Agency – OAR-OTAQ 27MY2015 Credits: A/C Leakage and Efficiency
Source: US EPA, “Manufacturer Performance Report for the 2015 Model Year” EPA-420-R-16-014, November 2016
U.S. Environmental Protection Agency – OAR-OTAQ 28MY2015 Incentives: 0 g/mile Upstream Emissions
Source: US EPA, “Manufacturer Performance Report for the 2015 Model Year” EPA-420-R-16-014, November 2016
U.S. Environmental Protection Agency – OAR-OTAQ 292025 CO2 Standard is a Function of
Car & Truck Production Volume and Vehicle Footprint
Passenger Car Target (g/mi) = (3.26 x footprint) – 3.2
• for vehicle footprints >41 and < 56 square feet
Light-Truck Target (g/mi) = (3.58 x footprint) +12.5
• for vehicle footprints >41 and < 74 square feet
For each individual company the Car & Truck standards are a
function of the # vehicles produced & each vehicle’s footprint
U.S. Environmental Protection Agency – OAR-OTAQ 30Advanced Technology Incentives
Incentives for full-size pickup trucks using hybrid or other clean technology
Per-vehicle credit for hybrid full-size pick-up trucks produced at minimum penetration rates
– Mild hybrid: 10 g/mi from 2017-2021 (minimum penetration is 20% of full-size pick-up sales in 2017, increases to
80% by 2021)
– Strong hybrid: 20 g/mi from 2017-2025 (minimum penetration is 10% of full-size pick-up sales)
Performance-based incentive credit for exceeding target by 15-20%
Advanced technology vehicle multipliers
Applies to electric, plug-in hybrid electric, fuel cell, and compressed natural gas vehicles
– EVs/FCVs: 2.0 in MY2017 phasing down to 1.5 in MY2021
– PHEVs/CNGs: 1.6 in MY2017 phasing down to 1.3 in MY2021
Multiplier allows manufacturers to count vehicles more than once in CO2 fleet average calculation
No multipliers for MY2022 and beyond
Upstream emissions for electric vehicles (EVs)
For MYs 2017-2021: EVs/PHEVs/FCVs count as 0 g/mile in compliance calculation with no vehicle sales
limits
For MYs 2022-2025, 0 g/mile treatment allowed up to a per-company cumulative sales cap:
– 600,000 for companies that sell 300,000 EV/PHEV/FCVs in 2019-2021
– 200,000 for other companies
Upstream emissions are fully counted in GHG impacts of the program
U.S. Environmental Protection Agency – OAR-OTAQ 31Advanced Gasoline Vehicles can Take the Industry Much Further …
many vehicles already meet future targets
Vehicle Production that Meets or Exceeds MY2020 CO2 Targets
With fleet averaging,
in any given model
year, only about 50%
In just of vehicles would
4 years need to meet/exceed
their target,
depending on sales
volumes.
U.S. Environmental Protection Agency – OAR-OTAQ 32Case Study: 2017 Honda CRV 1.5 liter AWD
• Best-selling SUV in U.S.
• AWD versions make up 2/3 of sales
• Advanced Gasoline Technology:
o Turbocharged GDI 1.5 liter I4 engine
o Continuously variable transmission
o No electrification
• Could already meet* 2022 target
o 5 years ahead
• Within 4 mpg of 2025 target
*Illustrative example only. EPA estimated real-world fuel economy targets from With 8 years to go
CO2 compliance targets, assuming A/C credits and 5 g/mi off-cycle credits
U.S. Environmental Protection Agency – OAR-OTAQ 33You can also read