2017 FUEL ECONOMY DETROIT - EPA GHG UPDATE FOR March 16, 2017
←
→
Page content transcription
If your browser does not render page correctly, please read the page content below
EPA GHG UPDATE FOR
2017 FUEL ECONOMY DETROIT
Bill Charmley
  National Vehicle and Fuel Emissions Laboratory
  Office of Transportation and Air Quality
  U.S. Environmental Protection Agency

March 16, 2017

Overview
How the EPA GHG Standards Work
Industry Progress To Date
What Might the 2025 Time-Frame Look Like
– EPA assessment (thus far)
What Comes Next
U.S. Environmental Protection Agency – OAR-OTAQ 2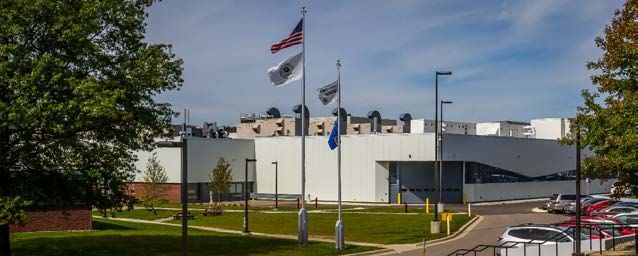
Why does EPA have GHG Standards for Light-Duty Vehicles?

 U.S. Supreme Court in 2007 on the topic of EPA and regulation of GHGs from motor vehicles:
      “But that DOT sets mileage standards in no way licenses EPA to shirk
      its environmental responsibilities. EPA has been charged with
      protecting the public “health” and “welfare”, a statutory obligation
      wholly independent of DOT’s mandate to promote energy efficiency.”

 Clean Air Act directs EPA –
      “The Administrator shall by regulation prescribe … standards applicable to
      the emission of any air pollutant from any class or classes of new
      motor vehicles or new motor vehicle engines, which in his judgement
      cause, or contribute to, air pollution which may reasonably be
      anticipated to endanger public health or welfare.”

                                  U.S. Environmental Protection Agency – OAR-OTAQ             3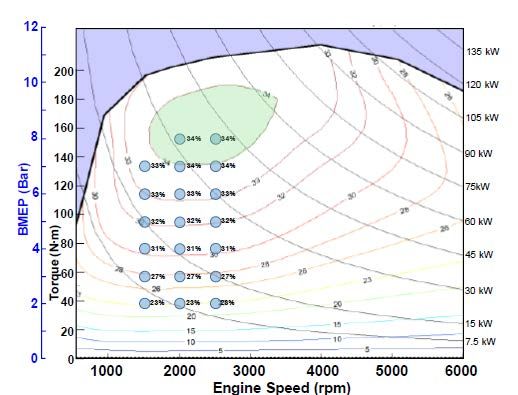
HOW THE EPA STANDARDS
        WORK

                        4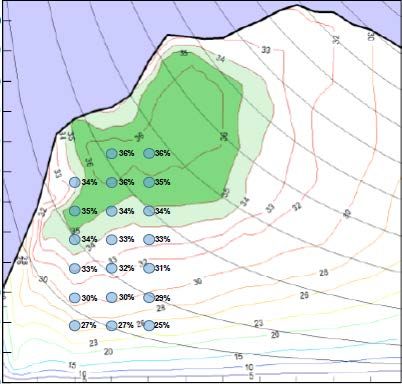
So What is the 2025 EPA Standard?
 Projections for Model Year 2025 Fleet CO2 Compliance Target
Fuel Prices/Fleet Mix Affect EPA’s PROJECTION of 2025 Standard
                           2012           Summer 2016                  Fall 2016
                         Projection        Projection                 Projection

       Fuel Price
                           $3.87                $2.95                    $2.97
        ($/gallon)
                                                                                           These are industry
      Car/truck mix       67/33%               52/48%                   53/47%             compliance values.
                                                                                         For consumers, the 2025
      2025 Fleet CO2                                                                    average real-world value is
     Compliance Level       163                   175                      173
       (g/mi, 2-cycle)
                                                                                              ~ 36 MPG

         MPG-e             54.5                  50.8                     51.4
         (2-cycle)

                                      U.S. Environmental Protection Agency – OAR-OTAQ                           5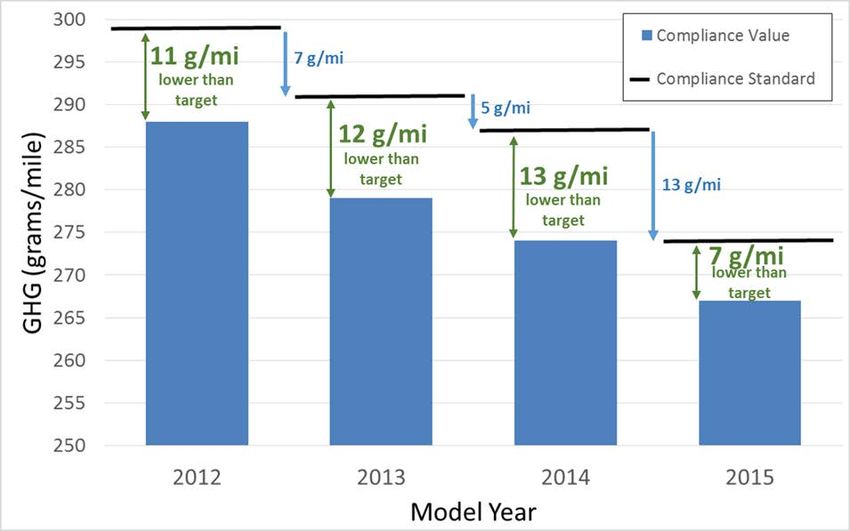
2025 CO2 Standard is a Function of
Car & Truck Production Volume and Vehicle Footprint

Passenger Car Target (g/mi) = (3.26 x footprint) – 3.2
   •   for vehicle footprints >41 and < 56 square feet

Light-Truck Target (g/mi) = (3.58 x footprint) +12.5
   •   for vehicle footprints >41 and < 74 square feet

   For each individual company the Car & Truck standards are a
   function of the # vehicles produced & each vehicle’s footprint

                                U.S. Environmental Protection Agency – OAR-OTAQ   6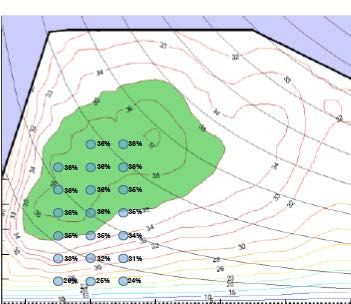
Footprint-based CO2 Target Curves for Trucks – “The Standards”
[separate footprint curve for Cars]

                                                                                              Chevy Silverado

                                                                                                                      Ford F-150

                                                Toyota Sienna

                            Nissan Murano

          Buick Encore

                                                                                                  With a shift from
                                                                                                   cars to SUVs &
                                                                                                 trucks, the OEM’s
                                                                                                 standard becomes
                                                                                                    less stringent

                                            U.S. Environmental Protection Agency – OAR-OTAQ                                   7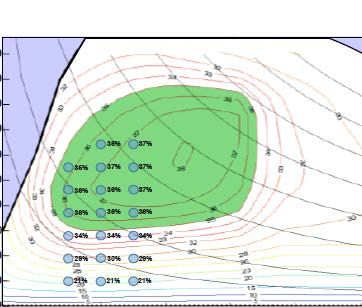
INDUSTRY PROGRESS TO DATE

                            8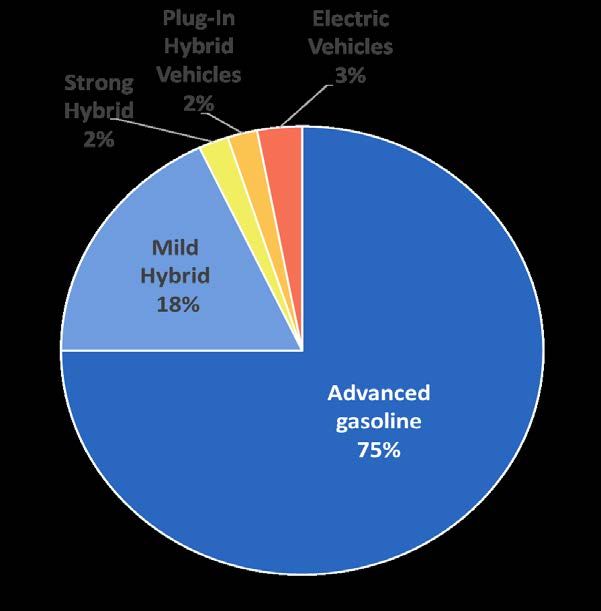
Vehicle CO2 Emissions at Record Low –
                  every major vehicle category improving
                                     All values                                                                         All values
                                     Real world                                                                         Real world

   MY2015: 358 g/mi CO2 (24.8 mpg)
                                                                      Truck SUVs highest % improvement since 2004, up 33%
   MY 2016 Projected : 25.6 mpg
                                                                      Pickups improved most in past year, up 0.8 mpg to 18.8 mpg
                                              U.S. Environmental Protection Agency – OAR-OTAQ                                  9
Automakers Adopting a Wide Array of Technologies at Rapid Rates
GDI use on nearly half of all
vehicles (up from 3% in MY2008),
with Mazda at 100%, 6 more
OEMs above 75%
~20% fleet use 7+
speed
transmissions, led by
Mercedes, BMW, and Fiat-
Chrysler
>20% fleet use CVTs, led by
Subaru, Nissan, and Honda
U.S. Environmental Protection Agency – OAR-OTAQ 10Early Years of Program Producing Positive Results
Industry Outperforming Standards 7 Years of Sales Increases Thru 2016
First Time in 100 Years
U.S. Environmental Protection Agency – OAR-OTAQ 11What Happens to the Over Compliance?
GHG Program is a Multi-Year Program, multiple layers of flexibility for OEMs
• No single year determines compliance.
• Program includes emissions banking and trading
• Credits last at least 5 model years, and early credits last longer.
• Debits can be carried forward for 3 model years.
• Today, the bank is 280 Million Megagrams CO2
o What’s a Megagram?
o 280M worth about 80 grams CO2/mile for the entire U.S. fleet
o Would allow the MY2015 fleet to comply with EPA standards through 2019, if all firms
participated fully in credit trading
o Through MY2015, 12 OEMs involved in credit trading
U.S. Environmental Protection Agency – OAR-OTAQ 12Advanced Gasoline Vehicles can Take the Industry Much Further …
many vehicles already meet future targets
Vehicle Production that Meets or Exceeds MY2020 CO2 Targets
With fleet averaging,
in any given model
year, only about 50%
In just of vehicles would
4 years need to meet/exceed
their target,
depending on sales
volumes.
U.S. Environmental Protection Agency – OAR-OTAQ 13Case Study: 2017 Honda CRV 1.5 liter AWD
• Best-selling SUV in U.S.
• AWD versions make up 2/3 of sales
• Advanced Gasoline Technology:
o Turbocharged GDI 1.5 liter I4 engine
o Continuously variable transmission
o No electrification
• Could already meet* 2022 target
o 5 years ahead
• Within 4 mpg of 2025 target
*Illustrative example only. EPA estimated real-world fuel economy targets from With 8 years to go
CO2 compliance targets, assuming A/C credits and 5 g/mi off-cycle credits
U.S. Environmental Protection Agency – OAR-OTAQ 14WHAT MIGHT 2025 LOOK LIKE –
EPA TECHNICAL ASSESSMENT
(THUS FAR)
15EPA’s Assessments are Informed by a Wide Range of Information
Technical research performed by EPA
o Benchmarking testing of 30 vehicles across wide range of powertrains & segments (with more to come)
o Published more than 30 peer-reviewed papers and technical reports
o Vehicle simulation modeling, cost teardown studies, mass reduction feasibility/cost studies, manufacturer
“learning by doing” costs, research on consumer issues, economic inputs, others
Extensive reviews of the literature
o 100’s of reports/papers from the literature published since 2012, including major studies such
as the 2015 National Academy of Sciences report
Stakeholder outreach & collaboration
o Hundreds of meetings with automakers, suppliers, NGOs, consumer groups, labor, states/local
governments, others
o Collaboration with NHTSA, CARB, DOE, Transport & Environment Canada
U.S. Environmental Protection Agency – OAR-OTAQ 16EPA’s National Vehicle and
EPA technical information available to Fuel Emissions Laboratory
Ann Arbor, MI
all stakeholders/public
Wide range of peer-
reviewed publications
and presentations:
• Technical papers,
including SAE papers
and EPA reports
• Conference
presentations
• Modeling workshop
Modeling and
Simulation
+ more …
U.S. Environmental Protection Agency – OAR-OTAQ 17EPA Most Recent Assessment –
Standards can be Met Mostly with Advanced Gasoline Technologies
One possible pathway EPA modeled
Cost estimate of $875/vehicle
Advanced engines and transmissions
Vehicle light-weighting
Improved aerodynamics
More efficient accessories
Low rolling resistance tires
Stop-start technology
Mild hybrid (e.g., 48 volt systems)
Small levels of strong HEV, EV, PHEV
Fuel Savings Offsets Cost increase
Net lifetime savings of $1,650
U.S. Environmental Protection Agency – OAR-OTAQ 18Progress in Engine Efficiency
MY2008 Actual PFI Engine
• Peak thermal efficiency 34% MY2008 PFI Engine
• Narrow efficiency region
U.S. Environmental Protection Agency – OAR-OTAQ 19Progress in Engine Efficiency
MY2008 Actual PFI Engine MY2014 GDI Engine
• Peak thermal efficiency 34%
• Narrow efficiency region
MY2014 Actual GDI Engine
• Peak thermal efficiency 36%
• Broader efficiency region
U.S. Environmental Protection Agency – OAR-OTAQ 20Progress in Engine Efficiency
MY2008 Actual PFI Engine MY2016 Turbo downsized Engine
• Peak thermal efficiency 34%
• Narrow efficiency region
MY2014 Actual GDI Engine
• Peak thermal efficiency 36%
• Broader efficiency region
MY2016 Actual Turbo downsized Engine
• Peak thermal efficiency 38%
• Very broad efficiency region
• Large overlap with 2-cycle test operation
U.S. Environmental Protection Agency – OAR-OTAQ 21Progress in Engine Efficiency
MY2008 Actual PFI Engine MY2025 EPA Projected TDS engine
• Peak thermal efficiency 34%
• Narrow efficiency region
MY2014 Actual GDI Engine
• Peak thermal efficiency 36%
• Broader efficiency region
MY2016 Actual Turbo downsized Engine
• Peak thermal efficiency 38%
• Very broad efficiency region
• Large overlap with 2-cycle test operation
MY2025 EPA projected turbo downsized engine
• Peak thermal efficiency 38%
• Similar efficiency region as MY2016 actual
engine
• Hardware improvements provide some
improved low-load efficiency
U.S. Environmental Protection Agency – OAR-OTAQ 22Current vs. Future Gasoline Powertrain Efficiencies
In 10 model years,
powertrain efficiency
average can increase from
21.5% to 26.8%
U.S. Environmental Protection Agency – OAR-OTAQ 23Powertrain Efficiency:
Current Levels and Projected Improvement Needed
MY2017 Honda Fit
MY2017 Hyundai Tucson
MY2017 Nissan Juke AWD
26.8% Fleet Average to Meet
Powertrain Efficiency (%)
MY2017 Honda Civic
MY2025 GHG Standards
MY2017 Audi A4
MY2015 Gasoline Vehicles
OEM1
MY2017 BMW 440i xDrive OEM2
OEM3
OEM4
OEM5
MY2017 F150 (2.7L, 6spd)
Etc…
MY2017 Gasoline Vehicles
MY2017 Porsche 911 Carrera 4S
Best Powertrain Efficiencies
Higher
Performance Lower
(Tractive Energy/Rated Power)
U.S. Environmental Protection Agency – OAR-OTAQ 24National Academies of Science 2015 Study
In 2015 an NAS Committee published a comprehensive
assessment of the light-duty CAFE & GHG technologies
NAS included a detailed review of the 2012 EPA/NHTSA
Assessment:
“The committee found the analysis conducted by NHTSA and EPA in
their development of the 2017-2025 standards to be thorough and of
high caliber on the whole.”
The NAS also concluded that the 2025 standards could largely
be met with advanced gasoline vehicle technology:
“Spark ignition engines are dominant in light-duty vehicles today and are
expected to remain dominant, with further reductions in fuel consumption
beyond 2025.” [Finding 2.1]
U.S. Environmental Protection Agency – OAR-OTAQ 25Can GHG standards be good for the U.S. auto industry, and the
overall U.S. job market?
• Sept. 2016 – Center for Auto Research issued EPA assessment of CAR study, using $1,324 (2015$)
a sales & employment assessment technology cost to go from 2016 to 2025 standards
• CAR’s report showed potentially large negative
impacts on employment and vehicle sales
Sales change +234,000 more
assumes range of high vehicle costs all higher vehicles sold
than EPA estimate ($2,000-$6,000)
assumes vehicle buy considers only first 3 years of
fuel savings in buying decision Employment change in +9,300 more auto
auto production jobs
• Though EPA has concerns with the
methodology used in this report, if we use the
CAR approach but with EPA’s cost Employment change +84,700 more total
estimates, the CAR model projects positive nationally U.S. jobs
sales and employment with $3/gal gasoline
prices
• If we assume that consumers consider 5-years of fuel savings (instead of CAR’s assumption of 3-years),
the vehicle sales change grows to +585,000 and national employment change grows to +206,000
U.S. Environmental Protection Agency – OAR-OTAQ
26WHAT COMES NEXT?
27EPA’s Reconsideration of the MTE Final Determination
March 15, 2017 - EPA Administrator Pruitt issued a Notice announcing he will
reconsider the EPA Final Determination published in January 2017:
“ … EPA has concluded that it is appropriate to reconsider its Final
Determination in order to allow additional consultation and coordination with
NHTSA in support of a national harmonized program.”
“In accord with the schedule set forth in EPA’s regulations, the EPA intends to
make a new Final Determination regarding the appropriateness of the MY
2022-2025 GHG standards no later than April 1, 2018.”
U.S. Environmental Protection Agency – OAR-OTAQ 28EPA’s National Vehicle and
EPA Continues its In-depth Evaluation of Fuel Emissions Laboratory
Ann Arbor, MI
Advanced Powertrains
Component benchmarking efficiency maps:
• MY2016 Mazda CX-9 2.5 liter GDI-turbo-charged w/ 6-speed AT
• MY2016 Honda Civic 1.5 liter GDI-turbo-charged 10.6:1 w/ CVT
Vehicle level benchmarking:
• MY2016 Acura ILX w/dual-clutch transmission with torque converter
• MY2017 Ford F150 w/10 speed AT
• MY2016 Chevy Malibu w/1.5 liter GDI-turbo-charged w/ 6-speed AT
Demonstration and Modeling:
• Demonstration of cooled EGR on a modified European Mazda 2.0 liter GDI-naturally-
aspirated 14:1 CR engine
• GTPower modeling of a MY2012 PSA 1.6 liter GDI-turbo-charged engine with cooled EGR
and an advanced turbo
• GTPower modeling of a MY2016 Honda Civic 1.5 liter GDI-turbo-charged 10.6:1 CR engine
Modeling and
• ALPHA model comparison of several CVTs Simulation
• ALPHA modeling of all vehicles included in above component and vehicle benchmarking Modeling and Simulation
U.S. Environmental Protection Agency – OAR-OTAQ 29Additional EPA Work Underway in Many Areas
Technology cost teardowns with FEV : modern GDI turbo-downsized engine, advanced diesel engine, CVT
Updates to OMEGA cost-effectiveness optimization model and ALPHA full vehicle simulation model
Ongoing work to evaluate the willingness to pay (WTP) for vehicle attributes (e.g., power, fuel economy, size, etc).
o Our review of 50+ papers from the last 20 years found very wide variation in these WTP values.
Ongoing work evaluates what factors may contribute to this variation.
Ongoing evaluation of automotive reviews of MY2015 vehicle fuel efficient technologies
o Building upon EPA’s study of MY2014 vehicles, we continue to find that positive evaluations for all technologies (70%)
exceed negative evaluations of the technologies (18%)
Ongoing work to evaluate the vehicle miles traveled (VMT) rebound effect
Collaboration with Transport and Environment/Climate Change Canada on mass reduction and aerodynamics
Continued evaluation of the vehicle fleet each year to assess technologies, emissions, and compliance
– supporting EPA’s forth-coming MY2016 Manufacturer GHG Performance Report and
2017 CO2/Fuel Economy Trends Report
U.S. Environmental Protection Agency – OAR-OTAQ 30Global Passenger Car CO2 Standards
Source: International
Council for Clean
Transportation.
http://www.theicct.org/blogs/staf
f/improving-conversions-
between-passenger-vehicle-
efficiency-standards
U.S. Environmental Protection Agency – OAR-OTAQ 31You can also read