SAMOA PENINSULA ENHANCED INFRASTRUCTURE FINANCING DISTRICT - Infrastructure Financing Plan
←
→
Page content transcription
If your browser does not render page correctly, please read the page content below
SAMOA PENINSULA ENHANCED
INFRASTRUCTURE FINANCING DISTRICT

Infrastructure Financing Plan

                                                Prepared by:
                                         The Humboldt County
                                Economic Development Division

                                With assistance from Kosmont Companies
Table of Contents
SECTION

1.0 Introduction.......................................................................................................................2

2.0 Description of the Proposed District..................................................................................6

3.0 Description of Proposed Facilities and Development........................................................7

4.0 Finding of Communitywide Significance............................................................................12

5.0 Financing Section...............................................................................................................13

6.0 Removal of Dwelling Units and Replacement Housing Plan .............................................17

7.0 Goals of the District...........................................................................................................18

Index of Appendices

          Appendix A: Map of Boundaries of the Samoa Peninsula EIFD (Not yet Available)
          Appendix B: Legal Description of the Samoa Peninsula EIFD (Not yet Available)
          Appendix C: Projected Tax Increment Revenue Analysis
          Appendix D: Fiscal Impact Analysis
          Appendix E: General Plan Master Environmental Impact Report

1|Page
1.0             Introduction

1.1     Background & Purpose

Developing and maintaining public infrastructure on the Samoa Peninsula is central to promoting economic prosperity,
meeting energy goals, creating jobs, and enhancing quality of place and life in Humboldt County. Multiple proposed
projects on the Samoa Peninsula will require functional infrastructure to succeed. Beginning in May of 2019, staff
presented a report on the lack of modern and working infrastructure on the Samoa Peninsula, and Humboldt County
Board of Supervisors directed staff to establish a taskforce whose purpose was to engage in intradepartmental
communication concerning Responsible Engagement for the Development of Infrastructure (REDI) (Agenda item 19-642
from May 21, 2019).

In September 2019 staff provided an overview of partnership & financing options for infrastructure
development on the Samoa Peninsula, based on findings of the REDI task force initiative. The Board of Supervisors
directed staff to explore financing vehicles for infrastructure development, and to work with
stakeholders sharing a vested interest in infrastructure development on the Samoa Peninsula.

In March of 2020, the County formed the Samoa Peninsula Infrastructure Workgroup (Workgroup), with the purpose to,
“explore potential funding opportunities to create and/or improve existing infrastructure on the Samoa Peninsula which
may include the possibility of creating an entity that can seek resources for the infrastructure needs of the Samoa
Peninsula for economic development improvements and the betterment of the community members who live there and
the economy of Humboldt County.” Through the Workgroup and communication with state partners, staff identified the
Enhanced Infrastructure Financing District (EIFD) as the preferred infrastructure improvement investment vehicle.

An EIFD is a special financing district, a governmental entity comprised of both public and private partners distinct from
the entity which establishes it. EIFDs can aid communities in funding a wide and diverse variety of public capital
improvement projects and other projects of communitywide significance set forth in state law, by capturing and
leveraging property tax increment (PTI) generated within the EIFD area. The EIFD does not impose a new tax. Added
improvements gained through EIFD funding supports future development and results in increased property values. This
generates increased property tax revenues from the “base year” which can then be leveraged for additional
improvements.

The proposed Samoa Peninsula Enhanced Infrastructure Financing District (the “District”) will use PTI to fund
infrastructure projects which have a direct connection to the District and which have lasting positive impacts for the
District and the surrounding community. These projects will be approved by an advisory committee, to be formed
following adoption of this Infrastructure Financing Plan (the IFP), before being brought to the Public Financing Authority
(the PFA) for final approval. The IFP is intended to illustrate anticipated EIFD revenues, the type of infrastructure which
will be financed, and the impacts to The County.

2|Page
1.2        Content and Overview

Pursuant to Government Code Sections 53398.59 through 53398.74, this IFP comprises the following information:

      a)   A map and legal description of the District, included herein as Appendix A and Appendix B, respectively.

      b)    A description of the public facilities and other forms of development or financial assistance that is proposed in
           the area of the district, including those to be provided by the private sector, those to be provided by
           governmental entities without assistance under this chapter, those public improvements and facilities to be
           financed with assistance from the proposed district, and those to be provided jointly. The description shall
           include the proposed location, timing, and costs of the development and financial assistance. This information is
           included in Section 3 of this IFP.

      c)    If funding from affected taxing entities is incorporated into the financing plan, a finding that the development
           and financial assistance are of communitywide significance and provide significant benefits to an area larger
           than the area of the district. This information is included in Section 4 of this IFP.

      d)   A financing section (included in Section 5 of this IFP), which shall contain all of the following information:

               a. A specification of the maximum portion of the incremental tax revenue of the county and of each
                  affected taxing entity proposed to be committed to the district for each year during which the district
                  will receive incremental tax revenue. The portion need not be the same for all affected taxing entities.
                  The portion may change over time. The maximum portion of the County’s property tax increment to be
                  committed to the District will be 75% throughout the duration of the District lifetime, which is projected
                  to be forty five (45) years from the date on which the first issuance of bonds or acquisition of a loan is
                  approved by the Public Financing Authority (“PFA”).

               b. A projection of the amount of tax revenues expected to be received by the district in each year during
                  which the district will receive tax revenues, including an estimate of the amount of tax revenues
                  attributable to each affected taxing entity for each year. Section 5.3 of this IFP includes a projection of
                  tax revenues to be received by the District by year over the course of forty five (45) years from the date
                  on which the first issuance of bonds or acquisition of a loan is approved by the PFA. These projections
                  are based on research and analysis of available data at the time of IFP preparation for purposes of
                  illustration. Actual results may differ from those expressed in this document. Appendix C provides
                  additional detail for the projected revenue analysis.

               c. A plan for financing the public facilities to be assisted by the district, including a detailed description of
                  any intention to incur debt. Section 5.3 of this IFP includes a plan for financing the public facilities to be
                  assisted by the District. The PFA governing the District intends to incur debt only when it is financially
                  prudent to do so. It is estimated at this time that 53.5 million (in present value dollars) will be
                  contributed by the EIFD to public improvements through a combination of tax increment bond or loan

3|Page
proceeds (multiple issuances may be necessary) and pay-as-you-go tax increment funding over the
District lifetime.
d. A limit on the total number of dollars of taxes that may be allocated to the district pursuant to the plan.
The total number of dollars or taxes that may be allocated to the District shall not exceed $200,000,000.
e. A date on which the district will cease to exist, by which time all tax allocation to the district will end.
The date shall not be more than 45 years from the date on which the issuance of bonds is approved
pursuant to subdivision (a) of Section 53398.81, or the issuance of a loan is approved by the governing
board of a local agency pursuant to Section 53398.87. The District will cease to exist the earlier of: (i)
forty five (45) years from the date on which the first issuance of bonds or acquisition of a loan is
approved by the PFA, or (ii) June 30, 2072. This IFP assumes that the District will be formed in Fiscal Year
2021-2022 and will begin receiving tax revenues in Fiscal Year 2022-2023.
f. An analysis of the costs to the county of providing facilities and services to the area of the district while
the area is being developed and after the area is developed. The plan shall also include an analysis of the
tax, fee, charge, and other revenues expected to be received by the county as a result of expected
development in the area of the district. Appendix D to this IFP includes, as part of the Fiscal Impact
Analysis, an analysis of the costs to the County for providing facilities and services to the area of the
District. It is estimated that, at Year 10 of the District lifetime, annual costs to the County will be
approximately $3.7 million.
g. An analysis of the projected fiscal impact of the district and the associated development upon each
affected taxing entity. Appendix D to this IFP includes an analysis of the projected fiscal impact of the
District and the associated development upon the County, as the only affected taxing entity that is
contributing tax increment revenues to the District at this time. It is estimated that, at Year 10 of the
District lifetime, the District will generate an annual net fiscal surplus of approximately $1.72 million to
the County.
e) If any dwelling units within the territory of the district are proposed to be removed or destroyed in the course
of public works construction within the area of the district or private development within the area of the district
that is subject to a written agreement with the district or that is financed in whole or in part by the district, a
plan providing for replacement of those units and relocation of those persons or families consistent with the
requirements of Section 53398.56. The PFA does not anticipate that any housing units will be removed as a
result of any project identified in this IFP. However, if any relocation of dwelling units is deemed to be required
in the future for a project financed by the District, the PFA will comply with the requirements of Government
Code Section 53398.56.
f) The goals the district proposes to achieve for each project financed pursuant to Section 53398.52. Section 7 of
this IFP summarizes the goals of each project to be financed by the District.
4|Page2.0 Description of the Proposed District
The EIFD encompasses approximately 2,243 acres along the Samoa Peninsula Southwest of the 255 bridge which
includes a variety of land use designations including residential, Industrial/coastal industrial, commercial, and
recreational. There are three communities (Samoa, Fairhaven, & Finntown), 19.84 miles of public roads, 1 public
elementary school, a volunteer fire department, no city police, and roughly 450 residents within the district. The
Peninsula lies on the deep-water port of Humboldt Bay, California’s second largest natural bay, which has plans for
sustainable development in energy, aquaculture, and international communication. The Town of Samoa, the largest
community on the peninsula, is in the process of being redeveloped to include more; residential, commercial, industrial,
and recreational development. Once dedicated to the timber industry, much of the Peninsula’s industrial park is moving
toward more sustainable industries. The Samoa Peninsula is also a popular recreational destination, allowing visitors
boat access, motorized beach and dune access, multiple point for pedestrian beach access, and sport fishing.
EXHIBIT A: REFERENCE MAP
Appendix A includes a Survey Map of the proposed District, and Appendix B is a legal description of the
District.
5|Page3.0 Description of the Proposed Facilities and
Development
3.1 Anticipate Future Private Development
Anticipated future private development within the EIFD is summarized in Table 1 below, with greater detail provided in
Appendix C. Buildout and absorption of these land uses are forecasted in the first 10 years of the District lifetime.
Table 1: Anticipated Future Private Development
Estimated
Net Taxable
Number Assessed
Development Type Sub Area Value Per
of Units Value at
Unit ($)
Buildout ($)
Aquaculture Project Marine Park 1 350,000,000 350,000,000
Home Rehabilitation Samoa 99 units 75,000 7,425,000
Hostel Samoa 30 rooms 50,000 1,500,000
Residential Buildings Samoa 198 units 350,000 69,300,000
Coastal Industrial Samoa 609,840 sq ft 33 20,000,000
Mixed Commercial Samoa 117,612 sq ft 234 27,500,000
Commercial Recreational Samoa 63,707 sq ft 275 17,500,000
Multipurpose Dock HD/ North Terminal 1 182,000,000 182,000,000
Terminal Improvements HD/ South Terminals 1 25,000,000 25,000,000
Terminal Support facilities HD/ South Terminals 1 10,000,000 10,000,000
Total $ 724,725,000
Notes:
Net Taxable Value Per Unit is based on estimated total build out value and development timeline and is for illustrative purposes only
*HD - Harbor District
Marine Park & Sustainable Aquaculture Farm
(Exhibit A; Sub Area 2)
There are plans and permits being process to develop a large scale sustainable fish farm on the Samoa Peninsula. The
future assessed value of this buildout is estimated at $350,000,000.
There is also a conceptual plan that was developed by Humboldt Bay Harbor Recreation and Conservation District in
partnership with Humboldt State University in 2013 outlining what they call, The National Marine Research and
Innovation Park. The plan is based around the development of a large-scale aquaculture firm, such as the one
mentioned above. Though the plan includes the development of energy infrastructure, a marine research lab, and
additional aquaculture manufactures, only aquaculture production has been accounted for in the Projected Tax
6|PageIncrement Revenue Analysis (APPENDIX C). This plan, and other future development, can be supported by the creation and proper implementation of the EIFD. Town of Samoa (Exhibit A; Sub Area 1) Development projects within the Samoa Township were acquired via the Samoa Town Master Plan, permit data from the county, and agency correspondence with the project developer Dan Co. Research concluded the development of; 198 new single family homes (requiring the development of 189 new residential lots), the rehabilitation of 99 existing homes, a 30 room hostel, 35 acres of coastal industrial, 9 acres of mixed commercial, and 9.75 acres of commercial recreational. Property tax exempt development in the Samoa Town Master Plan also has the potential to increase surrounding land values. Trail and park development, a new wastewater treatment plant, utility lines, and other recreational and public infrastructure projects all enhance the welfare and viability of district residents. Multipurpose Dock (Exhibit A; Terminal 1) The planned multipurpose dock, could potentially to be utilized by the Offshore Wind Industry for storage, staging, and assembly. According to the Port Infrastructure Assessment Report, the project is estimated to cost anywhere from $130 -310 million. This assessment estimates $182,000,000 in total taxable value. $140 million to build the wharf and an additional $42 million in yard ground improvements. The Redwood Coast Energy Association is preparing to submit a lease bid to be the first offshore wind energy project on the west coast, which could lead to project development within 5-7 years. development of such a project would benefit the entirety of the Humboldt Bay area via jobs and economic input and will be a large step towards a sustainable future. Terminal Improvements (Exhibit A; Harbor District, South Terminals) According to the Harbor District, there are currently plans for large scale improvements at docking sites along the Samoa Peninsula Harbor. These improvements will allow for public cargo storage and shipping, as well as support the tenants and their various aquaculture ventures. According to the Humboldt Bay Harbor District, these improvements are estimated to cost $25,000,000, as well as the need for $10,000,000 in support structures. The Harbor District is also currently pre-permitting 21 acres for subtidal and land-based aquaculture along the peninsula that they are marketing for lease. With multiple leases already in progress, they estimate $1,500,000 in improvements. Fairhaven Business Park (Not accounted for) (Exhibit A; Sub Area 3) The Fairhaven Business park is approximately 340 acres of industrial land and facilities, including two ocean outfall pipes, giving it high potential for development. The land currently has several large tenants, but space for additional developments Town of Fairhaven (Not accounted for) (Exhibit A; Sub Area 4) Fairhaven has a population of 177 on approximately 37 acres. New development in Fairhaven is restricted due to the presence of environmentally sensitive habitat and cost of constructing new septic systems that comply with county requirements. According to the Environmental Impact Report for the Samoa Peninsula Wastewater Project, the town of Fairhaven has the potential develop 62 of there 75 vacant residential lots. 7|Page
Other Potential Development (Not accounted for)
The Samoa Peninsula is also the planned landing site for 4 Transpacific fiber optic lines that will promote high-quality
advanced communication services from California directly to Australia, Japan, Singapore, and Taiwan. This massive
infrastructure project is likely to bring more jobs, development, and economic activity to the Humboldt Bay area and the
Samoa Peninsula.

3.2       Public Facilities to be Financed with Assistance from the Samoa Peninsula EIFD

Feedback from stakeholder interviews conducted by CCRP highlighted that property owners in the proposed EIFD area
are interested in infrastructure development which supports both private and public partnerships. Feedback gleaned
from these stakeholder interviews and through discussions with other stakeholders illustrated a demand for
infrastructure development which supports, among others:

      •   Coastal dependent industries and aquaculture projects to aid in the development of existing and growing
          industries on the Samoa Peninsula. Green energy projects which align with local and state goals for energy
          resiliency, innovation, and independence, and which align with climate change mitigation strategies, including
          sea level rise and tsunami mitigation as well as earthquake and fire mitigation.
      •   Renewable energy opportunities such as solar projects and emerging value-added forest product industries,
          such as torrefied pellet and mass timber manufacturers, that increase the demand for and market value of small
          diameter timber and biomass in order to fuel forest thinning, reduce risks to communities from overstocked
          forests, and combat climate change by sequestering carbon.
      •   Planning, building, zoning, and permitting activities for ongoing and new development projects.

The EIFD will delegate a portion of its revenue to meet these needs as well as support the Board of Supervisors Strategic
Framework of providing for and maintaining infrastructure, and by supporting business, workforce development and
creation of private-sector jobs (Outlined in Table 2). Additionally, infrastructure funded with property tax revenues
derived from the Samoa Peninsula Enhanced Infrastructure Financing District (EIFD) shall not be improvements of
primary or predominant use to, or for direct benefit to, the port or harbor, but rather shall be used for some other
primary or predominant use for a public purpose (as identified in Section 7.0) such as sustainability, quality of life, and
economic development improvements for the local community and current and future residents on the Peninsula.

8|Page
Table 2: Publicly Financed Development Projects
Estimated Time Examples
Development Type Location Estimated Cost Description
Horizon (not limited to)
Energy Infrastructure District-wide Near-term $2.5 - $5 million Projects which align with local and state goals for energy Green energy opportunities. Infrastructure
resiliency, innovation, and independence which helps expand access to utilities.
Facilities for the transfer and disposal of solid
waste.
Climate Infrastructure District-wide & Near-term / $2,5 - $5 million / Projects and which align with climate change mitigation Emerging value-added forest product
Beyond Long-term $10 - $25 million strategies, including sea level rise and tsunami mitigation industries, such as torrefied pellet and mass
as well as earthquake and fire mitigation timber manufacturers, that increase the
demand for and market value of small
diameter timber and biomass in order to fuel
forest thinning, reduce risks to communities
from overstocked forests, and combat climate
change by sequestering carbon
Community Infrastructure Samoa, Fairhaven, Long-term $10 - $25 million Projects which enhance quality of life for district residents Affordable Housing, Libraries, Child Care
Finntown and visitors Facilities, facilities for nonprofit organizations,
broadband internet access service
Business Infrastructure District-wide & Near-term $2.5 - $5 million Projects which enhance coastal dependent industries and Acquisition, construction, repair of industrial
Beyond aquaculture projects or which will aid in the development of structures for private use. Brownfield
existing and growing industries on the Samoa Peninsula. restoration and other environmental
mititgation. COVID relief for small businesses
Entitlement Infrastructure District-wide Near-term $2.5 - $5 million Projects which support planning, building, zoning, and Pre-permitting and coastal development
permitting activities for ongoing and new development plans, development agreements,
projects.
Note:
Time horizon priority based on project's ability to foster economic growth
Estimated cost based on increment revenue analysis determination cummulative funds in year 15 (Near-term, estimated $20 million) and year 30 (long-term estimated $55 million)
Estimated cost subject to change based on actual fund revenues
The District also plans on forming an advisory committee to the PFA, which will evaluate projects based on their ability
to meet these goals before bringing them to the PFA for final adoption. This will ensure a continued conversation with
the public and the development of infrastructure which support the goals of the community
Additional expenditures by the EIFD will be subject to consideration by the PFA. Eligible
expenditures in accordance with Government code sections 53398.52, 53398.56 and 53398.57
include the purchase, construction, expansion, improvement, seismic retrofit, or rehabilitation of any real or other
tangible property with an estimated useful life of 15 years or longer. The EIFD may finance planning and design activities
that are directly related to the purchase, construction, expansion, or rehabilitation of these projects. Example projects
may include, but not be limited to, the following:
a) Highways, interchanges, ramps and bridges, arterial streets, parking facilities, and transit facilities\
b) Sewage treatment and water reclamation plants and interceptor pipes
c) Facilities for the collection and treatment of water for urban uses
d) Flood control levees and dams, retention basins, and drainage channels
e) Child care facilities
f) Libraries
g) Parks, recreational facilities, and open space
9|Pageh) Facilities for the transfer and disposal of solid waste, including transfer stations and vehicles
i) Brownfield restoration and other environmental mitigation
j) The acquisition, construction, or rehabilitation of housing for persons of very low, low, and moderate income, as
defined in Sections 50105 and 50093 of the Health and Safety Code, for rent or purchase
k) Projects that enable communities to adapt to the impacts of climate change, including, but not limited to, higher
average temperatures, decreased air and water quality, the spread of infectious and vector-borne diseases,
other public health impacts, extreme weather events, sea level rise, flooding, heat waves, wildfires, and drought
l) Acquisition, construction, or repair of industrial structures for private use.
m) The acquisition, construction, or improvement of broadband Internet access service.
n) Acquisition, construction, or repair of commercial structures by the small business occupant of such structures,
if such acquisition, construction, or repair is for purposes of fostering economic recovery from the COVID-19
pandemic and of ensuring the long-term economic sustainability of small businesses.
o) Facilities in which nonprofit community organizations provide health, youth, homeless, and social services.
Targeted improvements would conform to established guidelines in existing, adopted planning documentation. The PFA
intends to continue to identify, evaluate, and pursue additional funding sources and financing mechanisms aside from
District tax increment to implement the improvements identified above, potentially including grant sources (e.g. Infill
Infrastructure Grant Program, RAISE grants, Community Development Block Grants (CBDG), HOME Investment
Partnerships Program, Economic Adjustment Assistance Program)
Private sector developers will be responsible for funding project-specific / fair-share / in-tract
infrastructure. Some public facilities included in the EIFD area are anticipated to be provided by
governmental entities without assistance from the District. There are no public facilities anticipated to be provided
jointly by the private sector and governmental entities, however it is possible that private sector developers may
advance funding for improvements, with anticipation to be partially reimbursed with EIFD proceeds. Such case-specific
agreements would come before the PFA for approval at the appropriate time.
In accordance with Government Code Section 53398.69, the EIFD may expend up to 10 percent of any accrued tax
increment in the first two years of the effective date of the EIFD on planning and dissemination of information to the
residents within the EIFD boundaries about the IFP and planned activities to be funded by the EIFD, including
reimbursement of the County’s advanced funding of such eligible costs.
In addition, in accordance with Government Code Section 53398.76, costs incurred by the County of Humboldt in
connection with the division of taxes for the EIFD are eligible to be paid by the EIFD. This IFP estimates administrative
costs at approximately $35,000 annually.
10 | P a g e4.0 Finding of Communitywide Significance
Implementation of the District promotes economic prosperity, achievement of energy goals, promotion of
environmental sustainability, creation of jobs, and enhancement of quality of place and life in Humboldt County.
The District additionally supports the Board of Supervisors Strategic Framework of providing for and maintaining
infrastructure, and by supporting business, workforce development and creation of private-sector jobs.
Specific communitywide and regional benefits anticipated to be generated by the District include:
• $52.8 million in net fiscal impact to County over 50 years (on a present-value basis)
• 198 housing units within the District
• 7,088 direct, indirect, and induced temporary, construction job years over the construction period
• 805 direct, permanent jobs in the County
• 987 additional indirect and induced permanent jobs in the County (total of 1792 direct, indirect, and induced jobs)
• $989.1 million in economic output from construction in the County
• $261.1 in annual ongoing economic output in the County.
11 | P a g e5.0 Financing Section Projections included in this IFP are based on research and analysis of available data at the time of IFP for purposes of planning and illustration. Actual results may differ from those expressed in this document. Aside from the County, no other taxing entity is contributing property tax increment to the District. It is anticipated that property tax increment will be utilized on both a “pay-as-you-go” basis as well as security for tax increment bond issuance or loan acquisition, including utilization as a reimbursement funding source for eligible improvements advanced by private sector entities. The analysis and projections herein reflect the County’s intention to dedicate incremental property tax revenue allocated to the County in lieu of motor vehicle license fees to the District pursuant to Government Code Section 53398.75(e)(1) in addition and in proportion to the more typical incremental AB8 property tax. 5.1 Maximum Portion of Incremental Tax Revenue Dedicated to the District The maximum portion of the County’s property tax increment to be committed to the District will be 75% throughout the District lifetime. 5.2 Projection of District Tax Revenues by Year Table 3 provides an overview of the projected growth of assessed value, property tax increment, and County contributions to the District over the District lifetime. It is expected that a total of approximately $125,000,000 of incremental tax revenues will be allocated to the District by the County 12 | P a g e
Table 2: Projection of District Revenues by Year
County AB8 Contribution County MVLF Contribution
Approx.
Property Tax Weighted County County County MVLF City MVLF
Increm ental County Share Equivalent County MVLF Total Taxes
Fiscal Year Increm ent 1% Average County Increm ent Increm ent Increm ent Increm ent
Assessed Value Allocated County MVLF Share Allocated Allocated to EIFD
General Levy Share Available Available Allocated Available Allocated
Share Available
0 2020 / 2021 $ - $ - 17% $ - 75% $ - 14% $ - 75% $ - $ -
1 2021 / 2022 7,805,258 $ 78,053 17% $ 13,422 75% $ 10,066 14% $ 11,006 75% $ 8,254 $ 18,321
2 2022 / 2023 68,016,621 $ 680,166 17% $ 116,961 75% $ 87,721 14% $ 95,908 75% $ 71,931 $ 159,652
3 2023 / 2024 129,432,211 $ 1,294,322 17% $ 222,571 75% $ 166,928 14% $ 182,508 75% $ 136,881 $ 303,809
4 2024 / 2025 242,751,113 $ 2,427,511 17% $ 417,434 75% $ 313,075 14% $ 342,296 75% $ 256,722 $ 569,797
5 2025 / 2026 406,911,393 $ 4,069,114 17% $ 699,723 75% $ 524,792 14% $ 573,773 75% $ 430,330 $ 955,122
6 2026 / 2027 436,354,879 $ 4,363,549 17% $ 750,354 75% $ 562,765 14% $ 615,290 75% $ 461,468 $ 1,024,233
7 2027 / 2028 591,887,234 $ 5,918,872 17% $ 1,017,806 75% $ 763,355 14% $ 834,601 75% $ 625,951 $ 1,389,306
8 2028 / 2029 625,030,237 $ 6,250,302 17% $ 1,074,799 75% $ 806,099 14% $ 881,335 75% $ 661,001 $ 1,467,101
9 2029 / 2030 749,336,099 $ 7,493,361 17% $ 1,288,555 75% $ 966,416 14% $ 1,056,615 75% $ 792,461 $ 1,758,877
10 2030 / 2031 784,928,079 $ 7,849,281 17% $ 1,349,759 75% $ 1,012,319 14% $ 1,106,802 75% $ 830,102 $ 1,842,420
11 2031 / 2032 801,431,899 $ 8,014,319 17% $ 1,378,138 75% $ 1,033,604 14% $ 1,130,074 75% $ 847,555 $ 1,881,159
12 2032 / 2033 818,265,794 $ 8,182,658 17% $ 1,407,086 75% $ 1,055,314 14% $ 1,153,810 75% $ 865,358 $ 1,920,672
13 2033 / 2034 835,436,368 $ 8,354,364 17% $ 1,436,612 75% $ 1,077,459 14% $ 1,178,022 75% $ 883,517 $ 1,960,976
14 2034 / 2035 852,950,353 $ 8,529,504 17% $ 1,466,729 75% $ 1,100,047 14% $ 1,202,718 75% $ 902,039 $ 2,002,086
15 2035 / 2036 870,814,618 $ 8,708,146 17% $ 1,497,449 75% $ 1,123,086 14% $ 1,227,908 75% $ 920,931 $ 2,044,017
16 2036 / 2037 889,036,168 $ 8,890,362 17% $ 1,528,782 75% $ 1,146,587 14% $ 1,253,602 75% $ 940,201 $ 2,086,788
17 2037 / 2038 907,622,149 $ 9,076,221 17% $ 1,560,743 75% $ 1,170,557 14% $ 1,279,809 75% $ 959,857 $ 2,130,414
18 2038 / 2039 926,579,850 $ 9,265,799 17% $ 1,593,342 75% $ 1,195,007 14% $ 1,306,541 75% $ 979,905 $ 2,174,912
19 2039 / 2040 945,916,705 $ 9,459,167 17% $ 1,626,594 75% $ 1,219,945 14% $ 1,333,807 75% $ 1,000,355 $ 2,220,301
20 2040 / 2041 965,640,297 $ 9,656,403 17% $ 1,660,510 75% $ 1,245,383 14% $ 1,361,619 75% $ 1,021,214 $ 2,266,597
21 2041 / 2042 985,758,361 $ 9,857,584 17% $ 1,695,105 75% $ 1,271,329 14% $ 1,389,986 75% $ 1,042,490 $ 2,313,819
22 2042 / 2043 1,006,278,786 $ 10,062,788 17% $ 1,730,392 75% $ 1,297,794 14% $ 1,418,922 75% $ 1,064,191 $ 2,361,985
23 2043 / 2044 1,027,209,619 $ 10,272,096 17% $ 1,766,385 75% $ 1,324,789 14% $ 1,448,435 75% $ 1,086,327 $ 2,411,115
24 2044 / 2045 1,048,559,070 $ 10,485,591 17% $ 1,803,097 75% $ 1,352,323 14% $ 1,478,540 75% $ 1,108,905 $ 2,461,228
25 2045 / 2046 1,070,335,509 $ 10,703,355 17% $ 1,840,544 75% $ 1,380,408 14% $ 1,509,246 75% $ 1,131,934 $ 2,512,342
26 2046 / 2047 1,092,547,477 $ 10,925,475 17% $ 1,878,739 75% $ 1,409,055 14% $ 1,540,566 75% $ 1,155,425 $ 2,564,479
27 2047 / 2048 1,115,203,684 $ 11,152,037 17% $ 1,917,699 75% $ 1,438,274 14% $ 1,572,513 75% $ 1,179,385 $ 2,617,659
28 2048 / 2049 1,138,313,016 $ 11,383,130 17% $ 1,957,438 75% $ 1,468,078 14% $ 1,605,099 75% $ 1,203,824 $ 2,671,902
29 2049 / 2050 1,161,884,534 $ 11,618,845 17% $ 1,997,971 75% $ 1,498,478 14% $ 1,638,336 75% $ 1,228,752 $ 2,727,231
30 2050 / 2051 1,185,927,482 $ 11,859,275 17% $ 2,039,315 75% $ 1,529,486 14% $ 1,672,238 75% $ 1,254,179 $ 2,783,665
31 2051 / 2052 1,210,451,290 $ 12,104,513 17% $ 2,081,486 75% $ 1,561,115 14% $ 1,706,819 75% $ 1,280,114 $ 2,841,229
32 2052 / 2053 1,235,465,573 $ 12,354,656 17% $ 2,124,501 75% $ 1,593,376 14% $ 1,742,091 75% $ 1,306,568 $ 2,899,943
33 2053 / 2054 1,260,980,143 $ 12,609,801 17% $ 2,168,375 75% $ 1,626,282 14% $ 1,778,068 75% $ 1,333,551 $ 2,959,832
34 2054 / 2055 1,287,005,003 $ 12,870,050 17% $ 2,213,128 75% $ 1,659,846 14% $ 1,814,765 75% $ 1,361,073 $ 3,020,919
35 2055 / 2056 1,313,550,361 $ 13,135,504 17% $ 2,258,775 75% $ 1,694,081 14% $ 1,852,195 75% $ 1,389,147 $ 3,083,228
36 2056 / 2057 1,340,626,626 $ 13,406,266 17% $ 2,305,335 75% $ 1,729,001 14% $ 1,890,375 75% $ 1,417,781 $ 3,146,782
37 2057 / 2058 1,368,244,417 $ 13,682,444 17% $ 2,352,827 75% $ 1,764,620 14% $ 1,929,318 75% $ 1,446,988 $ 3,211,608
38 2058 / 2059 1,396,414,563 $ 13,964,146 17% $ 2,401,268 75% $ 1,800,951 14% $ 1,969,040 75% $ 1,476,780 $ 3,277,731
39 2059 / 2060 1,425,148,112 $ 14,251,481 17% $ 2,450,678 75% $ 1,838,008 14% $ 2,009,556 75% $ 1,507,167 $ 3,345,175
40 2060 / 2062 1,454,456,332 $ 14,544,563 17% $ 2,501,076 75% $ 1,875,807 14% $ 2,050,882 75% $ 1,538,162 $ 3,413,969
41 2061 / 2062 1,484,350,716 $ 14,843,507 17% $ 2,552,482 75% $ 1,914,362 14% $ 2,093,036 75% $ 1,569,777 $ 3,484,138
42 2062 / 2063 1,514,842,988 $ 15,148,430 17% $ 2,604,917 75% $ 1,953,688 14% $ 2,136,032 75% $ 1,602,024 $ 3,555,711
43 2063 / 2064 1,545,945,106 $ 15,459,451 17% $ 2,658,400 75% $ 1,993,800 14% $ 2,179,888 75% $ 1,634,916 $ 3,628,716
44 2064 / 2065 1,577,669,266 $ 15,776,693 17% $ 2,712,952 75% $ 2,034,714 14% $ 2,224,621 75% $ 1,668,466 $ 3,703,180
45 2065 / 2066 1,610,027,909 $ 16,100,279 17% $ 2,768,596 75% $ 2,076,447 14% $ 2,270,249 75% $ 1,702,687 $ 3,779,134
46 2066 / 2067 1,643,033,725 $ 16,430,337 17% $ 2,825,353 75% $ 2,119,015 14% $ 2,316,789 75% $ 1,737,592 $ 3,856,607
47 2067 / 2068 1,676,699,657 $ 16,766,997 17% $ 2,883,245 75% $ 2,162,434 14% $ 2,364,261 75% $ 1,773,195 $ 3,935,629
48 2068 / 2069 1,711,038,908 $ 17,110,389 17% $ 2,942,294 75% $ 2,206,721 14% $ 2,412,681 75% $ 1,809,511 $ 4,016,232
49 2069 / 2070 1,746,064,944 $ 17,460,649 17% $ 3,002,525 75% $ 2,251,894 14% $ 2,462,070 75% $ 1,846,553 $ 4,098,446
50 2070 / 2071 1,781,791,501 $ 17,817,915 17% $ 3,063,960 75% $ 2,297,970 14% $ 2,512,447 75% $ 1,884,335 $ 4,182,306
Total $ 532,719,720 $ 91,606,227 $ 68,704,671 $ 75,117,106 $ 56,337,830 $ 125,042,500
Present Value 3% $ 227,991,883 $ 39,205,375 $ 29,404,031 $ 32,148,407 $ 24,111,305 $ 53,515,336
These projections are based on research and analysis of available data at the time of IFP preparation for purposes of
illustration. Actual results may differ from those expressed in this document. Appendix C provides additional detail for the
projected revenue analysis.
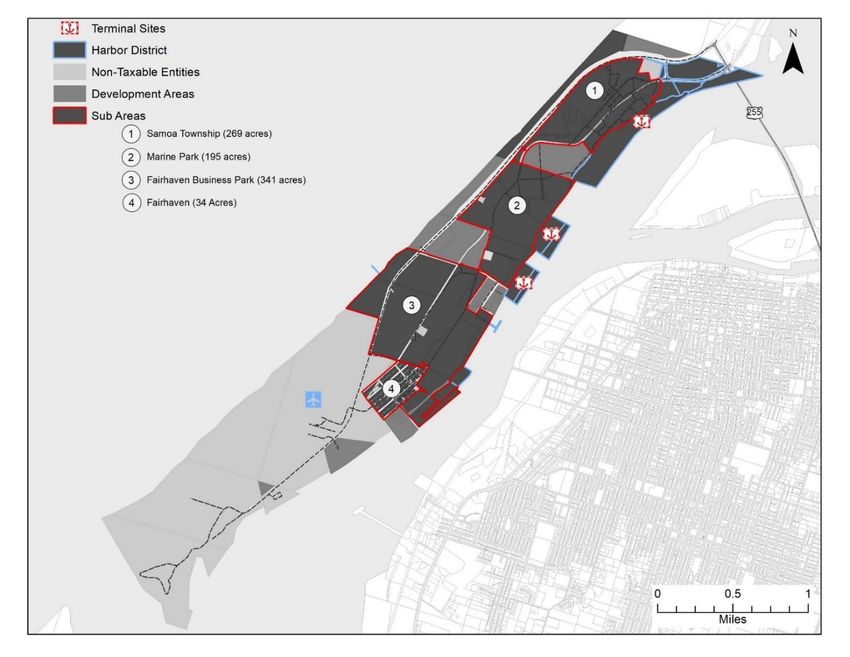
13 | P a g e5.3 Plan for Financing Public Facilities The PFA may utilize numerous funding sources and financing mechanisms to implement the improvements identified in Section 3.2, potentially including District tax increment, grant sources (e.g. Infill Infrastructure Grant Program, RAISE grants, Community Development Block Grants (CBDG), HOME Investment Partnerships Program, Economic Adjustment Assistance Program), complementary district formation (e.g. Community Facilities District, Property-Based Improvement District), impact fees, private sector investment incentivized by the formation of the EIFD itself and its federal Opportunity Zone designation, and/or other sources. As it pertains to the use of District tax increment, the PFA may incur debt when it is financially prudent to do so. It is estimated at this time that approximately $53.5 million (in present value dollars) of EIFD funding will be contributed to public improvements from a combination of tax increment bond or loan proceeds (multiple issuances may be necessary) and; pay-as-you-go tax increment funding, including utilization as a reimbursement funding source for eligible improvements advanced by private sector entities over the District lifetime. 5.4 Limit on Total Dollars Allocated to the District The total number of dollars or taxes that may be allocated to the District shall not exceed $200,000,000 over the District lifetime. 5.5 District Termination Date The District will cease to exist the earlier of: (i) forty five (45) years from the date on which the first issuance of bonds or acquisition of a loan is approved by the PFA, or (ii) June 30, 2071. This IFP assumes that the District will be formed in Fiscal Year 2021-2022 and will begin receiving tax revenues in Fiscal Year 2022-2023 5.6 Analysis of Costs to Provide Facilities and Services Appendix D to this IFP includes, as part of the Fiscal Impact Analysis, an analysis of the costs to the County for providing facilities and services to the area of the District. It is estimated that, at Year 10 of the District lifetime, annual costs to the County will be approximately $3.7 million to service the area of the District. 5.7 Fiscal Impact Analysis Appendix D to this IFP includes an analysis of the projected fiscal impact of the District and the associated development upon the County, as the only affected taxing entity that is contributing tax increment revenues to the District. Table 4 presents an overview of fiscal impacts to the County. 14 | P a g e
Table 3: Overview of Fiscal Impacts to County

                                                                     Annual                            Year 0-50
                                                            (Stablized Year         Year 0-50     Present Value
               County of Humboldt                                        10)    Nominal Total            @ 3.0%
                Estimated Fiscal Revenues                          5,424,033      436,898,798        176,600,407
                Estimated Fiscal Expenditures                      3,700,966      308,666,066        123,767,806
                Estimated Net Fiscal Impact to County              1,723,067       128,232,732        52,832,601

It is estimated that, at Year 10 of the District lifetime, the District area will generate an annual net fiscal surplus of
approximately $1.72 million to the County. Over 50 years, District activity will generate a positive net fiscal impact of
approximately $52.83 million for the County on a present-value basis. This is in addition to the Community economic
benefits outlined in Section 4 of this IFP (e.g. housing, jobs, mobility and connectivity, quality of life, environmental
sustainability).

15 | P a g e
6.0 Removal of Dwelling Units and
Replacement Housing Plan
The PFA does not anticipated that any housing units will be removed as a result of any project identified in this IFP.
However, if any relocation of dwelling units is deemed to be required in the future for a project financed by the District,
the PFA will comply with the requirements of Government Code Section 53398.56.
16 | P a g e7.0 Goals of The District The goals of the District’s implementation of the public facilities outlined in Section 3.2 are to support the County’s General Plan and Community Wide goals which aim to preserve and enhance the diverse character of Humboldt while fostering growth which aligns with needs and wants of the public. This would include providing the infrastructure foundation for the development of affordable housing in the community, energy efficient utility services, living-wage job opportunities, and industries which both support our agriculture and timber industry while preserving our natural resources. In order to ensure that the needs of the public are met, the District will support and encourage public participation throughout the formation process and beyond. The District also plans on forming an advisory committee to the PFA, which will evaluate projects based on their ability to meet these goals before bringing them to the PFA for final adoption. This will ensure a continued conversation with the public and the development of infrastructure which support the goals of the community. Additional objectives include economic development in the form of fiscal revenue generation for the County and other taxing entities, job creation, improvement of quality of life, and promotion of environmental sustainability. The District will be utilized to contribute approximately $53.5 million (in present value dollars) to address infrastructure funding needs that are critical to catalyze private sector investment and development 17 | P a g e
You can also read