SEASONAL OUTLOOK FOR ROSS SEA AND MCMURDO SOUND 2020-2021
←
→
Page content transcription
If your browser does not render page correctly, please read the page content below
Seasonal Outlook for Ross Sea and McMurdo Sound 2020-2021
                                         Christopher Readinger
                                         U.S. National Ice Center
                                             4231 Suitland Rd.
                                            Suitland, MD 20746
                                     E-mail to: nic_analyst@noaa.gov

INTRODUCTION

The U.S. National Ice Center (USNIC) provides planning and real time operational support for the efforts
of the United States Antarctic Program (USAP) through collaboration with National Science Foundation
(NSF) and the U.S. Coast Guard (USCG). Specifically, this outlook is provided as environmental awareness
to safely plan icebreaker operations in the McMurdo/Ross Sea channel and escort ice-strengthened
tanker and ice-strengthened cargo ships to the pier at McMurdo Station, located at 77°51’S, 166°40’E.

In this specific outlook, the term “ice edge” is used to delineate the boundary between areas with
greater than or equal to 4/10ths sea ice and areas with less than 4/10ths sea ice.

METHODOLOGY

Climatology: The rates of recession for the Ross Sea ice edge are predominantly derived using an analog
forecasting technique that relates historical observations of pre-season ice extent and thickness to the
predicted severity of austral summer ice conditions. This analog data from climatological conditions is
adjusted to reflect the expected impact of current meteorological and oceanographic conditions in the
Ross Sea.

Current Conditions: Based on the USNIC ice analysis for 05 November 2020 (Figure 1), the position of the
northern ice edge was very close to the climatological maximum extent for this time of year. There is
more ice now than last year when the edge was situated evenly between the climatological max and
min. As is typical, the Ross Sea is primarily covered with first year thick sea ice (>47” or >120cm) but the
extent of old ice (second year/multi-year ice) is higher than last year including an east-west bridge of old
ice across the Ross Sea around 65oS. The bulk of the old ice is concentrated east of 180 longitude and
north-northwest of Cape Adare, and can be seen as the red color in the graphic.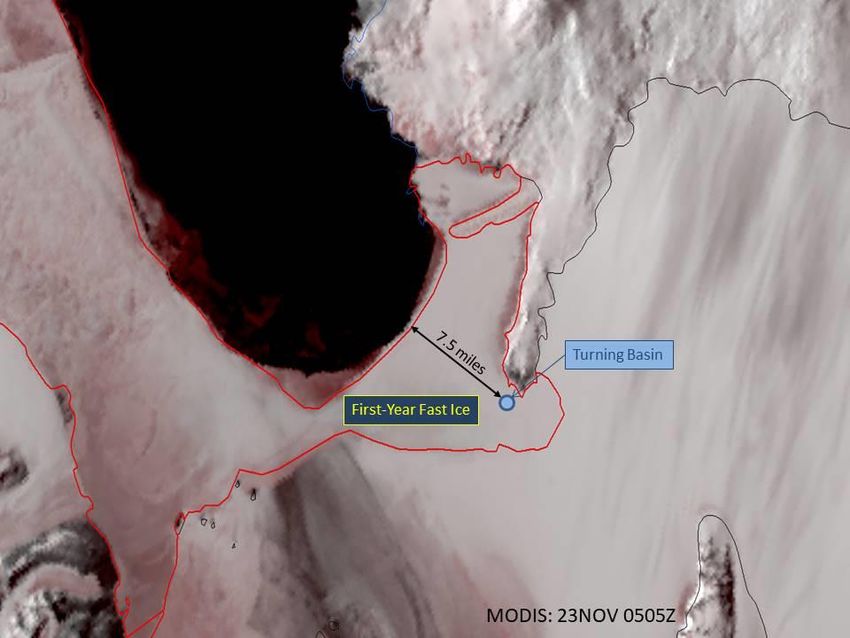
Figure 1. USNIC Weekly Analysis, Stage of Development valid: 05 November 2020.

As of November 14th the sea ice survey by McMurdo Station ice experts[1] found the fast ice in
McMurdo Sound averages 91.3” (232cm), which is well beyond typical first year thick stage of
development. The extent however is minimal, extending only 7.5 miles from the station to the fast ice
edge (Figure 2).
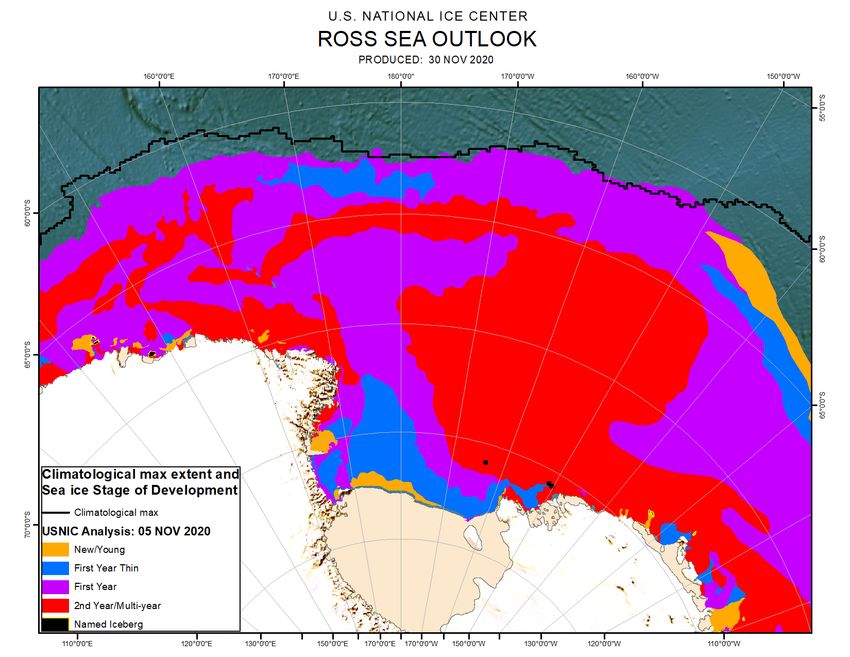
Figure 2. Fast Ice situation in McMurdo Sound as of 23 November 2020. MODIS Image.

Average surface air temperatures for the Austral autumn and winter were 0.5-2 oC above normal for the
entire Ross Sea basin (Figure 3) [2] but was slightly cooler than previous years, potentially enabling
marginally thicker ice growth. Katabatic winds off the Ross Ice Shelf help to produce prodigious amounts
of sea ice during the winter. Variations in the wind could influence sea ice extent and potentially
thickness. To investigate this potential driver we look at meridional wind anomalies for the autumn-
winter season. Excessive southerly winds can create a lot of new and young ice, but may not allow it to
grow in thickness before pushing it north toward the ice edge. Weak winds could result in less overall ice
extent, but coupled with cold temperatures the ice could be thicker than average. For 2020, the
meridional wind anomaly along the western Ross Ice Shelf near Ross Island was up to 2m/s weaker than
normal (Figure 3). Toward the east side of the Ross Ice Shelf, over Edward VII Peninsula and extending
north into the Ross Sea basin was a stronger positive anomaly where southerly winds were up to 4m/s
stronger than normal. This forcing was evident through the winter where a large anticyclonic rotation in
the sea ice set up. However, instead of creating prodigious amounts of thinner new/young ice, this
circulation enabled more old ice to drift in from the Amundsen Sea.
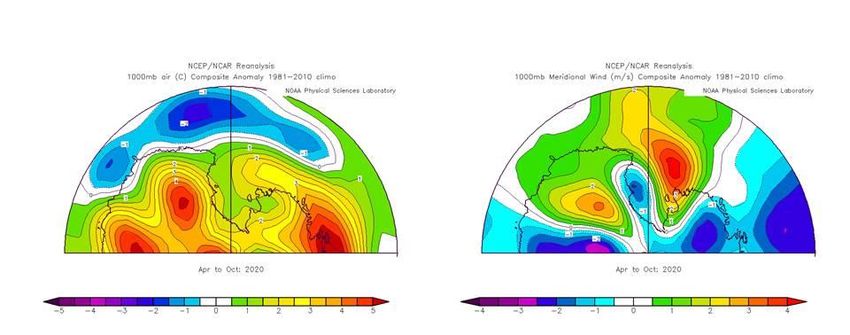
Figure 3. NCEP/NCAR Reanalysis of surface temperature anomaly from Apr-Oct 2020 (left) and meridional wind anomaly from
Apr-Oct 2020 (right).
Large-scale Atmospheric Circulation: The extreme southern high latitudes are dominated by a westerly
circumpolar vortex that extends from the surface to the stratosphere. The long-term variability in this
vortex is called the Antarctic Oscillation (AAO) [4] or Southern Annular Mode (SAM). For much of the
winter of 2020, the AAO index varied between positive and negative phases but has trended positive
over the last 30 days. Positive phase AAO means westerly winds across the southern ocean are stronger,
which acts to isolate Antarctica from warmer mid-latitude air, and keep the extreme cold bottled up.
However, the variability from earlier in the season makes any influence from the winter AAO
questionable at this time.
http://www.cpc.ncep.noaa.gov/products/precip/CWlink/daily_ao_index/aao/aao.shtml
Input considered for this outlook includes:
(a) Surface air temperature
(b) Sea surface temperatures along the ice edge
(c) Fast ice extent in McMurdo Sound
(d) Current location of ice edge compared to previous years
(e) Location and concentration of first-year and multi-year ice
(f) Meridional wind anomaly in the Ross Sea
(g) Navy ESPC 45 day model sea ice thickness and concentration forecast
OUTLOOK
As of early November 2020, the distribution of old ice in the Ross Sea resembles the distribution of old
ice from 3 prior seasons – 2012-13, 2013-14 and 2016-17. The distribution of first year ice and the sea
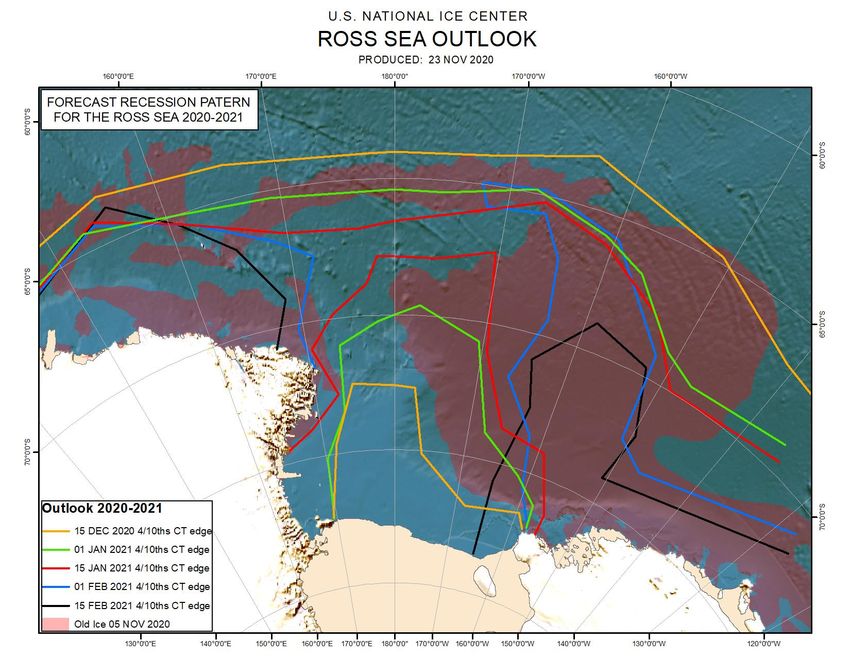
ice extent helps to rule out 2016-17 because it was very different to current conditions. 2012-13happened to be the season when the channel opened the latest on record – the first week of March, and was only open for a short time. 2013-14 was a more typical late-January opening and the distribution of ice matches best with current conditions so the recession pattern from 2013-14 will be used as the analog to 2020-21. We don’t know what caused the opening to happen so late in 2013 but if the sea ice behaves as it did in 2012-13 the ESPC [3] long-range model may help to foresee an event like that happening this year. In 2013 the melt-out was well underway by late November with the Ross Sea polynya extending more than 100km out from the shelf. This year, the polynya finally began opening the third week of November and at this early stage the melt patterns and ice distributions between 2013 and 2020 are quite similar. Incorporating some of the other seasonal and atmospheric influences like wind and temperature we think the center of Ross Sea should melt out, allowing the navigable channel to open between 170E-180 longitude, while large areas of residual sea ice remain to the east and west. Looking ahead with ESPC long-range model which has shown it can pick up on influences that we do not always see, at the first period of interest, 15 December 2020 the model closely agrees with the pace of the melt-out from the 2013 season. Putting all of these factors together and applying them to the 2013-14 analog year, we are projecting that vessels in the Ross Sea will require icebreaker escort until approximately 20 January 2021 and navigable ice conditions for unescorted vessels (≤4/10) are expected after this date. As with recent years, USNIC will publish bi-weekly updates to this outlook beginning after 15 December comparing how the meltout corrresponds to our recession dates shown in Figure 4 below. In addition we will use the ESPC model to look ahead at how the meltout progresses.
Figure 4. 2020-2021 Ross Sea Ice Edge Recession Outlook (lines indicate 4/10 sea ice concentration).

As always, there are numerous small icebergs scattered throughout the Ross Sea which can pose a
hazard to navigation. Contrary to last year there are no drifting named icebergs in the region.

Sea ice analyses for the Ross Sea can be obtained via the USNIC website at:
https://usicecenter.gov/Products/AntarcRossOutlook

REFERENCES

[1] Brechtel, N. (2020), McMurdo Sea Ice Report November 16, 2020.

[2] Kalnay, E. and Coauthors, (1996), The NCEP/NCAR Reanalysis 40-year Project. Bull. Amer. Meteor.
Soc., 77, 437-471.
[3] Metzger, E. J. et al., (2014), Operational Implementation Design for the Earth System Prediction
Capability (ESPC): A First Look, Naval Research Laboratory, NRL/MR/7320—14-9498.

[4] Thompson, D. W., and J. M. Wallace (2000), Annular modes in extratropical circulation, Part II:
Trends, J. Clim., 13, 1018– 1036.
You can also read