Sector Study | Pharmaceutical April 20 - The Pakistan Credit Rating Agency Limited - PACRA
←
→
Page content transcription
If your browser does not render page correctly, please read the page content below
Sector Study | Pharmaceutical        April 20

    The Pakistan Credit Rating Agency Limited
Table of contents
▪ Global Market
   • Healthcare Dynamics
   • World Prescriptions Sales forecast
▪ Coronavirus disease (COVID-19)
   • Change in Consumer Behavior

▪ Pakistan Pharma Industry
   •   Highlights
   •   Major Industry Players’ Mix
   •   Production
   •   Financial Performance
▪ Industry Outlook

                       May 15, 2020       2
Global Health Care Dynamics

➢ With global health care spending expected to rise at
  an accelerated growth rate, it will likely present
  many opportunities for the sector. While there will
  be uncertainties, stakeholders can navigate them by
  factoring in historic and current drivers of change
  when strategizing for 2020 and beyond.
➢ Among these drivers are a growing and aging
  population, rising prevalence of chronic diseases,
  infrastructure       investments,     technological
  advancements, evolving care models, higher labor
  costs amidst workforce shortages, and the
  expansion of health care systems in developing
  markets.
                  May 15, 2020                           3
Worldwide (Prescription drug sales forecast, 2020–2024 (US$ bln)
2021 2022 2023 2024
Prescription 955 1,027 1,100 1,181
Growth per year 7.0% 7.5% 7.1% 7.4 %
Change vs. June 2018 (US$B) -43 -43 -34 -23
Generics 88 92 96 100
Generics as % of prescription 9.2% 9.0% 8.7% 8.4 %
Prescription excluding generics 867 935 1,004 1,081
Growth per year 7.1% 7.8% 7.4% 7.7 %
Orphan 169 191 216 239
Prescription excluding generics & orphan 698 743 788 842
May 15, 2020 4What is COVID-19?
▪ Coronavirus disease 2019 (COVID-19) is defined as illness
caused by a novel coronavirus, which was first identified amid
an outbreak of respiratory illness cases in Wuhan City, Hubei
Province, China. It was initially reported to the WHO on
December 31, 2019. On January 30, 2020, the WHO declared
the COVID-19 outbreak a global health emergency. On March 11, 2020, the WHO declared
COVID-19 a global pandemic, its first such designation since declaring H1N1 influenza a pandemic
in 2009.
▪ Multiple efforts are underway to develop a vaccine to augment immune system against this virus.
The patients are being treated with available medicines, suited otherwise for various human
ailments.
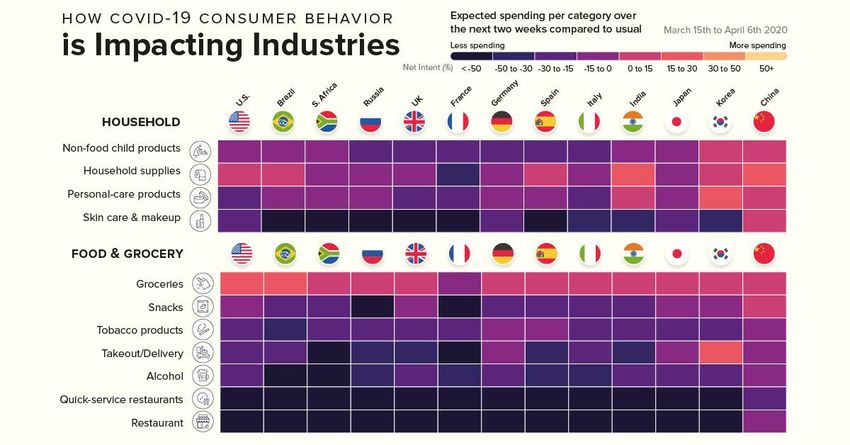
May 15, 2020 5Consumer Behavior-Worldwide
May 15, 2020 6Pakistan Industry | Highlights
Total revenue
PKR – 423 Billion
Revenue Concentration
MNCs Share Top 25 companies above:
Annual Growth Rate
Pakistan Pharma Industry: 60%
13.23% (as per IMS)
31% Top 50 claim : 80%Pakistan | Industry Players’ Mix
There are approximately 650 companies operating in the Pakistani
pharmaceutical market, out of which less than 31 are multinational Market Composition | Sale Value
companies. The pharmaceutical industry contributes approximately ~1% to
the GDP of Pakistan annually. 31%
There are around 9,000 actively marketed drugs in Pakistan sold at licensed
pharmacies on prescription. In addition, there is a large segment of Over the
Counter (OTC) products e.g., multivitamins, pain, cold and flu relief.
69%
National Listing
Name of Pharma Company Ranking
/ MNC Status MNC National
GlaxoSmithKline Pakistan Limited 1 MNC Listed
Market Composition | No. of
Gets Pharma (Privtae) Limited 2 National Unlisted Companies
Sami Pharmaceutical (Private) Limited 3 National Unlisted 3%
Abbott Laboratories (Pakistan) Limited 4 MNC Listed
High Q Pharmaceuticals 5 MNC Listed
The Searle Company Limited 6 National Listed
Sanofi-Aventis Pakistan Limited 7 MNC Listed
Hilton Pharma (Private) Limited 8 National Unlisted
97%
MNC NationalMajor Industry Players
✓ Top 50 companies collectively have a ~80% share of the industry’s revenues.
✓ 69% of the market share is with local companies and 31% with MNCs.
✓ Top 25 corporates, in terms of revenue and growth rate, are shown below in the bar diagrams. They
contribute around 62.6% of the total market share
Source: IMS Q2-2019
• Revenue at trade price includes ex-distributor sales only and excludes institutional sales and
exports
• GSK equates to 28blnPakistan | Production
Pharmaceutical Production | Growth Trend
60%
Capsules and injections have been
50%
taking double digit growth due to
40%
changing medical practices and
30%
disease patterns – mostly related to
20%
new breed of injections curing
10%
Hepatitis in Pakistan. However,
0%
Devaluation of Rupee and Rising
-10%
Interest rates have adversely affected
-20%
the production trend.
-30%
-40%
Tablets Syrups Capsules Injections Ointments
FY15 FY16 FY17 FY18 FY19*
Product
Units FY14 FY15 FY16 FY17 FY18 FY19*
Category
Tablets 000 Nos 25,363,352 26,535,885 23,238,358 29,014,742 27,802,617 27,899,018
Syrups 000 Ltrs 91,139 98,996 108,342 117,084 112,637 104,916
Capsules 000 Nos 2,644,465 3,098,139 3,398,609 3,497,716 5,149,828 3,397,565
Injections 000 Nos 783,611 885,732 999,207 1,212,658 1,622,228 1,205,529
Ointments 000 Kgs 2,575 2,788 3,106 3,970 3,786 3,312
Galenicals 000 Ltrs 64 75 46 343 371 44
Source: Pakistan Bureau of StatisticsFINANCIAL PERFORMANCE OF MAJOR
INDUSTRY PLAYERS
Gross Margins 2013 2014 2015 2016 2017 2018 2019
Glaxo 25% 26% 27% 27% 26% 25% 20%
Abbott 38% 38% 39% 40% 39% 33% 28%
Searle 45% 45% 49% 52% 53% 51% 48%
Sanofi 30% 25% 26% 34% 36% 30% 25%
Highnoon 41% 45% 48% 47% 48% 47% 46%
Ferozsons 48% 48% 45% 41% 38% 32% 35%
Industry Average 38% 38% 39% 40% 40% 36% 34%
AGP 58% 58% 58% 58% 61% 56% 58%
Net Margins 2013 2014 2015 2016 2017 2018 2019
Glaxo 4% 6% 11% 10% 8% 10% 5%
Abbott 16% 14% 16% 19% 14% 9% 3%
Searle 12% 11% 16% 18% 19% 18% 13%
Sanofi 4% 2% 1% 8% 8% 4% -1%
Highnoon 13% 7% 10% 10% 10% 10% 11%
Ferozsons 16% 14% 17% 20% 8% -0.3% 3%
Industry Average 11% 9% 12% 14% 11% 8% 6%
AGP 26% 12% 17% 26% 26% 22% 23%
✓ Consolidated financial statements of the respective companies have been used.
✓ For 2019, 6-months ratios are presented except Ferozsons & Searle whose year end is June.Pakistan Industry | Outlook Pharma Industry operates in a heavily regulated environment, monitored and administered by Drug Regulatory Authority of Pakistan (DRAP). New molecules can take up to 12-18 months to register and generics take up to 3 years. It is a very sensitive field that requires a lot of time for new product launches. Pricing matters have seen attention through a revised pricing policy. Due to concentrated nature of the industry, the leading players are financially and business wise are much resilient. Internal capital generation is good. Given the sustainability of demand side, owing to the customer’s needs, business risk is considered low and in crisis period, it takes further support especially for large business houses. Covid-19 has harnessed the integration of the pharmaceutical sector to the sustenance of the society at large. The industry and especially the rightly placed institutions are taking advantage of branding and extra revenue streams. The temporary suspension of outdoor medical facilities including private clinics is a challenge, though. The future is expected to be carved around health matrix. Fundamental changes are expected in how governments have approached health infrastructure and well being of the citizens. Although Pharma companies are contributing 1% of their PBT to government for conducting R&D, a lot can be desired on the front of research and development. Counterfeit menace is a much spoken challenge
Bibliography
1. Pakistan Pharmaceutical Industry | IMS Health
2. Pakistan Bureau of Statistics, Government of Pakistan | Industry | Quantum Index of Large Scale Manufacturing
   Industries (QIM)
3. Deloitte Insights | Global Life sciences outlook 2020
4. PACRA’s in-house research and database – A sample of players representing approx. 33% of the market share

                              Jhangeer Hanif               Senior Financial           Kanwal Ejaz
   Unit Head                Jhangeer@pacra.com                 Analyst            Kanwal.ejaz@pacra.com

Contact Number: +92 42 3586 9504
You can also read