Self-Sufficiency Programs - Committed to Long-Term Success Presentation to the Human Services Subcommittee - Oregon.gov
←
→
Page content transcription
If your browser does not render page correctly, please read the page content below
Presentation to the
                            Human Services Subcommittee

     Self-Sufficiency Programs
            Committed to Long-Term Success
               Kim Fredlund, Self-Sufficiency Programs Director
             Dan Haun, Self-Sufficiency Programs Deputy Director

                                 February 19, 2019

SELF-SUFFICIENCY PROGRAMS

1
Presentation Overview
    • Who we are
    • Poverty and Employment
    • Moving Oregonians toward self sufficiency
    • Goals
    • Who we serve
    • Successes/What’s Next/Your Help Needed
    • Key Performance Measures
    • Budget and Forecasting

SELF-SUFFICIENCY PROGRAMS

2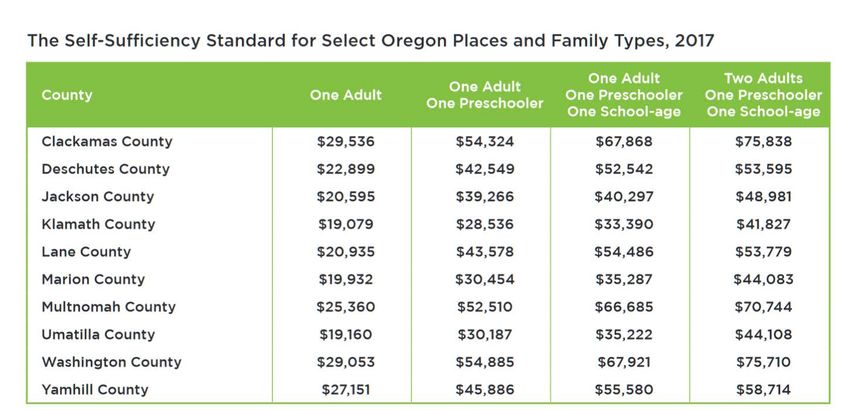
Self-Sufficiency Programs serve Oregonians
    of all ages through a variety of programs and
    partnerships.
    Benefits and services offered provide a safety
    net of services, family stability and a
    connection to careers aimed at reducing
    poverty in Oregon and stopping the cycle of
    poverty for the next generation.

SELF-SUFFICIENCY PROGRAMS

3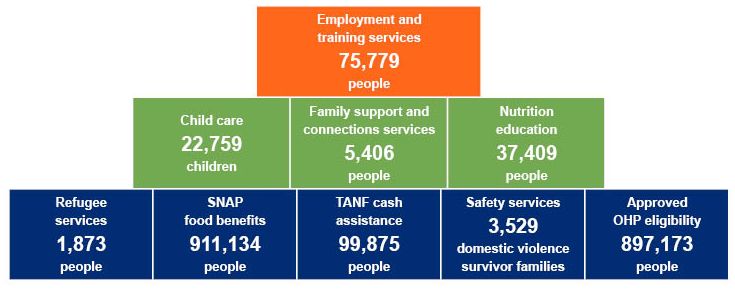
What is Poverty?
The World Bank Organization describes poverty in this way:
  “Poverty is hunger. Poverty is lack of shelter. Poverty is being
  sick and not being able to see a doctor. Poverty is not having
  access to school and not knowing how to read. Poverty is not
  having a job, is fear for the future, living one day at a time.
    Poverty has many faces, changing from place to place and
    across time, and has been described in many ways. Most
    often, poverty is a situation people want to escape. So poverty
    is a call to action -- for the poor and the wealthy alike -- a call
    to change … so that many more may have enough to eat,
    adequate shelter, access to education and health, protection
    from violence, and a voice in what happens in their
    communities.”
SELF-SUFFICIENCY PROGRAMS

4
Self-Sufficiency Standard
The Self-Sufficiency Standard defines the
minimum income needed to realistically
support a family, meeting basic needs
without aid from government, community or
personal aid.
The Self-Sufficiency Standard was created by Dr. Diana Pearce from the University of Washington

SELF-SUFFICIENCY PROGRAMS

5

Oregon’s Self-Sufficiency Standard

 The standard for all counties and family types can be found at http://selfsufficiencystandard.org/node/76

SELF-SUFFICIENCY PROGRAMS

6
185% FPL vs the Self-Sufficiency Standard
Amounts shown are for a 3 person household
                                             Self-Sufficiency
                              185% FPL          Standard        Difference

             Clackamas
                 Annual        $38,448          $67,868         -$29,420
                Monthly        $3,204            $5,656          -$2,452
                 Hourly        $18.20            $32.13          -$13.93
             Lane
                 Annual        $38,448          $54,486         -$16,038
                Monthly        $3,204            $4,541          -$1,337
                 Hourly        $18.20            $25.80           -$7.60
             Jackson
                 Annual        $38,448          $40,297         -$1,849
                Monthly        $3,204            $3,358          -$154
                 Hourly        $18.20            $19.08          -$.88
SELF-SUFFICIENCY PROGRAMS

7
185% FPL vs the Self-Sufficiency Standard for
a three person household
$80,000

$70,000

                                                                                            $66,685     $67,868     $67,921

$60,000

                                                                  $54,486    $55,580
$50,000                                                $52,542

$40,000
                                           $40,297

                    $35,222    $35,287
$30,000   $33,390

$20,000

$10,000

     $0
          Klamath   Umatilla   Marion      Jackson    Deschutes    Lane      Yamhill       Multnomah   Clackamas   Washington

                                    Self-Sufficiency Standard      185% of FPL - $38,448

SELF-SUFFICIENCY PROGRAMS

 8
What Self-Sufficiency Means to Me
“Basically, to me it means being
independent. Being able to do
everything on my own. It means a
good paying job that lets me live and
take care of my kids. Not just living
check to check, not enjoying
anything. I want better for my family.
I want to show my kids that there is
more to life than just living check to
check and struggling. I want a job
that lets me show my kids that they
can have some fun, invest, travel,       Pictured above: Nicie Hawkins (30), Larry James (10) and Jordan James (6)
shop, and help others out – that they
can do something with their money,
not just work to survive.”
Nicie Hawkins

SELF-SUFFICIENCY PROGRAMS

9

What is Self-Sufficiency?
For Muntaha, self-sufficiency is about having access to skill
building so that he can gain employment.

TANF recipient Alison told us it means being able to provide for her
child. To afford housing, medical and food for her family without
state assistance. To be able to provide a happy healthy life.

Gina stated that she won’t be self-sufficient until she can provide a
stable home for her loving family. A chance to start to do things by
herself.

SELF-SUFFICIENCY PROGRAMS

10
How Oregon Ranks with Other States
                                                                            Percentage       Rank

 Poverty                                             Children under 18         15.9%         23rd
 People with incomes below $24,860 for a family of
                                                     Women ages 18-64          14.7%         30th
 four in 2017
                                                     Men ages 18-64            12.0%         39th

 Hunger and Food Insecurity
 Households who were food insecure on average                                  12.9%         31st
 from 2015-2017

 Affordable Housing
 Affordable housing units available for every 100                            42.0 units      47th
 renter households with very low incomes in 2016

                                                         Data from the Center for American Progress

SELF-SUFFICIENCY PROGRAMS

11
Work and income are essential to
people’s sense of worth and wellbeing.
As technology reshapes entire
industries, education and training must
adapt to offer more secure footholds in a
changing economy.
Raj Chetty, professor, Stanford University
SELF-SUFFICIENCY PROGRAMS
12Mean Rates of Absolute Mobility by Cohort
100
Pct. of Children Earning more than their Parents
90
80
70
60
50
1940 1950 1960 1970 1980
Child's Birth Cohort
SELF-SUFFICIENCY PROGRAMSPoverty and Unemployment in Oregon
18%
15.4% 15.6% 15.5%
16% 15.2% 14.9% 15.1%
14.3% 14.4% 14.6%
14% 13.2%
12%
10%
8%
6%
4%
2%
0%
Jan-08 Jan-09 Jan-10 Jan-11 Jan-12 Jan-13 Jan-14 Jan-15 Jan-16 Jan-17
Poverty Unemployment
SELF-SUFFICIENCY PROGRAMS
14Employment in Oregon 2018
20% of all people working in Oregon
are working at or below $12 an hour
Dishwashers, Cashiers, Counter Attendants, Waiters/Waitresses, Cooks, Bartenders,
Child Care Workers, Maids/Housekeeping, Food Preparation Workers, Personal Care
Aides, Packers/Packagers, Janitorial, Stock Clerks, Laborers, Stock Movers, Teacher
Assistants, Office Clerks, Customer Service Representatives
At least 40% of these workers are
employed part-time, defined as under
30 hours a week or only working no
more than 40 weeks a year
SELF-SUFFICIENCY PROGRAMS
15SSP Moves Oregonians
Toward Self Sufficiency
Connection
to Careers
Family
Stability
Safety
Net
SELF-SUFFICIENCY PROGRAMS
16Areas of Focus
Safety Net – housing, food security, income,
transportation, childcare, clothing
Family Stability – medical access, physical health,
emotional health, substance use, school
engagement, social support, safety, parent
education
Connection to Careers – training and education,
learning environment, communication,
workplace skills, work experience
SELF-SUFFICIENCY PROGRAMS
17SSP’s Key Goals • Person-centered opportunities for long lasting well-being for children and adults • Reliable, equitable, accessible service delivery • Strong and effective workforce • Joined with communities to reduce poverty • Operational excellence SELF-SUFFICIENCY PROGRAMS 18
Benefits and Services
Benefits help families cover basic costs, for example:
• Child care assistance
• Food benefits
• Housing assistance
• Earned Income Tax Credit
Services help families gain skills, for example:
• Employment and training
• Family coaching
• Nutrition assistance

SELF-SUFFICIENCY PROGRAMS

19
Oregonians served in 2017

SELF-SUFFICIENCY PROGRAMS

20
Successes
Agency and Community Partnerships
External partnerships foster stakeholder and community engagement. They
promote and encourage forward thinking and innovative solutions. The
collective impact of our efforts continues to have a positive effect on poverty in
Oregon.

SELF-SUFFICIENCY PROGRAMS

21
Successes
Family Assessment
The Family Assessment tool engages participants through a trauma informed
approach. The tool helps families easily identify goals and lays the groundwork
for relevant, meaningful, and productive plans. Tracking scores over time gives
families and staff something tangible to see successes and progress. When
families gain confidence about their current circumstances they are more
hopeful about their future.

Family Coaching Model
The Family Coaching model creates rapport/trust and aids in developing
relationships with families by shifting focus from participation in the JOBS
program to meeting the family’s needs. This shift has resulted in creative
thinking to meet our families where they are and create meaningful plans to
assist them in meeting their goals.

SELF-SUFFICIENCY PROGRAMS

22
Successes
SNAP Training and Employment
The SNAP Training and Employment Program (STEP) helps SNAP participants gain the
skills and experience needed to succeed in a fulfilling, sustainable career. We began
providing STEP services in FFY 2013 and have continued to expand the program.

                  Participants Contracted Providers* Budget - federal/local
 FFY 2013              1,069                        2                          $237,985
 FFY 2014              1,863                        3                         $3,951,588
 FFY 2015              3,790                        9                         $4,595,791
 FFY 2016              6,088                        6                         $8,916,066
 FFY 2017              8,974                       12                        $18,488,654
 FFY 2018             61,990                       18                        $23,723,807

  * Some providers offer services at multiple locations. For example, the Oregon Employment
    Department is one contractor, but they provide services in every county.

SELF-SUFFICIENCY PROGRAMS

23
Successes
Rural Jobs Initiative
This initiative is a partnership with the Governor’s Office to enhance job
opportunities and economic development by opening eligibility centers across
the state. These eligibility centers, or processing centers that make
determinations on Medicaid, Oregon Health Plan (OHP) and Supplemental
Nutrition Assistance Program (SNAP) eligibility, will allow us to get one step
closer to the Same Day/Next Day service model; a model that gets Oregonians
the services and benefits they need faster.
Today, 10 processing centers are open – there will be 11 by the end of summer
2019 - and we will have moved 164 vacant positions to the following locations:
Astoria Klamath Falls Ontario
Baker City La Grande Tillamook
Enterprise Milton-Freewater White City
Hermiston North Bend
SELF-SUFFICIENCY PROGRAMS
24What’s Next • Updating Key Performance Measures • Eligibility Transformation • Preparing for Integrated Eligibility • Housing Expansion • Research Agenda SELF-SUFFICIENCY PROGRAMS 25
We Need Your Help
• Access to high quality affordable child care
  providers
• Employment/training services and
  opportunities for families with children
• Housing

SELF-SUFFICIENCY PROGRAMS

26
Policy Option Packages
POP 122 (Adjusted) – Emergency Housing Assistance
This POP addresses the housing need by expanding SSP’s
ability to provide emergency housing services and supports
to homeless families and families at risk of homelessness in
areas where assistance is not available.

POP 127 – Vocational Training and Education Expansion
This POP expands targeted vocational training and
education opportunities for families receiving TANF in rural
locations and provides access to underserved TANF
populations statewide.
SELF-SUFFICIENCY PROGRAMS

27
Policy Option Packages
POP 111 – Limited Duration Positions
This POP requests position authority and federal fund
limitation for up to 7 grant-funded limited duration positions.

SELF-SUFFICIENCY PROGRAMS

28
Legislative Concepts
HB 2032
• Suspends provisions that have been suspended since
  2008. Fiscal impact if not passed.

• Removes statutory assessment language to allow for
  more family-centered, targeted assessment, aligning with
  practice.

• Preserves some suspended language around employment
  that would be helpful for current program functioning.

SELF-SUFFICIENCY PROGRAMS

29
ERDC Funding
• $10.7 transferred from the Early Learning
  Division for the Employment Related Day Care
  Program
• Result of increased federal funding
• Worked with unions, new rates were bargained
  and effective January 1, 2019

SELF-SUFFICIENCY PROGRAMS

30
SELF-SUFFICIENCY PROGRAMS

31
SSP is proposing four new Key Performance Measures (KPM).
The new KPMs align to our mission of poverty reduction and are
more outcome-oriented. These new measure were created in
partnership with:

•    Representative Piluso       • Mid-Willamette Community
•    Representative Olson          Action
•    Children First of Oregon    • Oregon Housing and
•    Central City Concern          Community Services
•    Oregon Dept of Education    • Early Learning Division
•    Oregon Food Bank and        • Oregon Employment Dept
     TANF Alliance               • SSP central office and field
                                   staff

SELF-SUFFICIENCY PROGRAMS

32
Proposed KPM Households at or Above Living Wage The median percentage of households who are at, or above, a living wage four quarters out after exiting all Self-Sufficiency Programs benefits. Rationale The SSP mission is to help people out of poverty and one of the ways they can do that is by earning living wages through a career path. SELF-SUFFICIENCY PROGRAMS 33
Proposed KPM

Housing Stability
The percentage of Self-Sufficiency Programs participants who
report their housing needs are met.

Rationale
Housing instability and homelessness negatively impact family
well-being and employment stability. This measure will tell us
whether more people are obtaining stable housing.

SELF-SUFFICIENCY PROGRAMS

34
Proposed KPM

Food Security
The percentage of Self-Sufficiency Programs participants who
report they never run out of food or money to buy food.

Rationale
Oregon is one of the most food-insecure states in the nation.
This measure will tell us whether more people become food
secure.

SELF-SUFFICIENCY PROGRAMS

35
Proposed KPM

Self Efficacy and Hope
The percentage of Self-Sufficiency Programs participants who
report their involvement with and the services provided by SSP
connected them to helped them feel more:
• confident about improving their current circumstances; and
• hopeful about their future.

Rationale
The goal is that families have a sense of influence over events
that affect them and can act on them. Self efficacy often
generates hope and hope can inspire a person to feel more able
to achieve a goal.

SELF-SUFFICIENCY PROGRAMS

36
Proposed KPM Deletions
KPM #2 – TANF Family Stability
KPM #3 – TANF Re-entry
KPM #4 – SNAP Utilization
KPM #5 – SNAP Accuracy
KPM #6 – Enhanced Child Care
KPM #20 – TANF JOBS Placements

Rationale
SSP is proposing four new KPMs that more closely align to the mission of
poverty reduction, which will be more outcome-oriented, rather than process or
program specific.

SELF-SUFFICIENCY PROGRAMS

37
Key Performance Measures
The next few slides show the current
measures, which are based strictly on
numbers and do not demonstrate success
over time.

SELF-SUFFICIENCY PROGRAMS

38
KPM #2 TANF Family Stability
The percentage of children receiving TANF who entered foster care or in home care.
Time Period: July 2017 – June 2018 | *Measure proposed for deletion*
 5.0%

 4.5%

 4.0%

 3.5%

 3.0%

 2.5%

 2.0%

 1.5%

 1.0%

 0.5%

 0.0%
              2015                2016                 2017                2018
Actual       3.40%               3.70%                4.30%               3.40%

SELF-SUFFICIENCY PROGRAMS

39
KPM #3 TANF Re-entry
The percentage of TANF cases who have not returned within 18 months after exit
due to employment. Time Period: Jan – Dec 2018 | *Measure proposed for deletion*
70% 68.1%
64.2% 65.1%
63.5% 62.5%
62.0% 61.4%
60%
50%
40%
30%
20%
10%
0%
2012 2013 2014 2015 2016 2017 2018
Actual 64.2% 62.0% 61.4% 68.1% 65.1% 63.5% 62.5%
Target 72% 65% 65% 65% 65% 65% 66%
SELF-SUFFICIENCY PROGRAMS
40KPM #4 SNAP Utilization
The ratio of Oregonians served by SNAP to the number of low-income Oregonians.
Time Period: Jan – Dec 2018 | *Measure proposed for deletion*
100% 96.4% 96.4% 98.0%
92.5% 93.2% 94.2%
90%
80%
70%
60%
50%
40%
30%
20%
10%
0%
2012 2013 2014 2015 2016 2017
Actual 92.5% 96.4% 96.4% 93.2% 94.2% 98.0%
Target 71.0% 80.0% 90% 90% 85% 85%
SELF-SUFFICIENCY PROGRAMS
41KPM #5 SNAP Accuracy
The percentage of accurate SNAP payments
Time Period: Oct 2017 – Sept 2018 | *Measure proposed for deletion*
100% 96.4% 96.4% 98.0%
92.5% 93.2% 94.2%
90%
80%
70%
60%
50%
40%
30%
20%
10%
0%
2012 2013 2014 2015 2016 2017
Actual 92.5% 96.4% 96.4% 93.2% 94.2% 98.0%
Target 71.0% 80.0% 90% 90% 85% 85%
SELF-SUFFICIENCY PROGRAMS
42KPM #6 Enhanced Child Care
The percentage of children receiving care from providers who are receiving the enhanced
or licensed rate for child care subsidized by DHS. Time Period: Oct 2018 | *Measure
proposed for deletion*
90%
80% 77.6%
70.9%
70%
64.7% 63.7%
61.8%
60% 57.7%
54.4%
50%
40%
30%
20%
10%
0%
2012 2013 2014 2015 2016 2017 2018
Actual 54.4% 57.7% 61.8% 64.7% 63.7% 70.9% 77.6%
Target 63% 60% 60% 60% 65% 65% 65%
SELF-SUFFICIENCY PROGRAMS
43KPM #20 TANF Jobs Placements
The percentage of clients who achieve job placement each month compared to
those anticipated to achieve placement. Time Period: Jan - Dec 2018 | *Measure
proposed for deletion*
140%
126.5%
122.4% 122.7%
120%
110.4%
100%
80%
60%
40%
20%
0%
2015 2016 2017 2018
Actual 126.5% 122.4% 122.7% 110.4%
Target 100% 100% 100% 100%
SELF-SUFFICIENCY PROGRAMS
44Department of Human Services
2019-21 Governor's Budget
Total Fund by Program Area
$ 12,550.7 million
Aging and People
VR Basic Rehabilitative
with Disabilities
Services
$3,900.5 - 31%
$122.3 - 1%
Child Welfare
$1,327.1 - 11%
Intellectual &
Developmental
Disabilities
$2,916.1 - 23%
Self-Sufficiency
Programs
$3,349.7 - 27%
Central & Shared Services, State
Assessments & Enterprise-wide Costs
$935.0 - 7%
SELF-SUFFICIENCY PROGRAMS
45Self-Sufficiency Programs
Total by Program
$ 3,349.7 million
Employment Related Daycare
$170.5 - 5%
TA Domestic Violence
Services & Refugee Program
Supplemental Nutrition Asst $25.8 - 1%
Program
$2,241.6 - 71% Family Support & Connections
$4.5 - 0%
Teen Parent & SUD Child
Care & TA-DVS Advocates
$7.6 - 0%
Program Delivery & Design
$391.1 - 13%
Cash Assistance
$216.9 - 7%
JOBS Program
$87.0 - 3%
SELF-SUFFICIENCY PROGRAMS
46Self-Sufficiency Programs
Total by Fund Type
$ 3,349.7 million
General Fund
$445.9 - 13%
Federal Fund NL
$2,214.3 - 66%
Other Fund
$102.2 - 3%
Federal Fund
$587.3 - 18%
SELF-SUFFICIENCY PROGRAMS
47DHS SSP Direct Payments and Services
2017-19 GB
3,000,000,000
2,500,000,000
2,000,000,000
1,500,000,000
1,000,000,000
500,000,000
0
Direct Payments to
Direct Payments to Clients Design Delivery
Providers
GF 132,504,659 63,896,742 23,906,914 225,633,122
OF 99,082,296 2,047,112 451,847 620,513
FF 91,222,653 2,365,350,775 28,961,218 316,117,643
TF 322,809,608 2,431,294,629 53,319,979 542,371,278
% of Total 9.64% 72.58% 1.59% 16.19%
Note: 98.41% of budget is direct services (Delivery) or direct payments to clients or providers
SELF-SUFFICIENCY PROGRAMS
48SNAP Caseload Actual and Forecast
SNAP Caseload Fall 2018
500,000
450,000
400,000
350,000
History
300,000
Fall 2018 Forecast
250,000
Jul-11
Jul-12
Jul-13
Jul-14
Jul-15
Jul-16
Jul-17
Jul-18
Jul-19
Jul-20
Jul-21
SELF-SUFFICIENCY PROGRAMS
49TANF Caseload Actual and Forecast
TANF Caseload Fall 2018
40,000
35,000
30,000
25,000
20,000
History
15,000
Fall 2018 Forecast
10,000
Jul-11
Jul-12
Jul-13
Jul-14
Jul-15
Jul-16
Jul-17
Jul-18
Jul-19
Jul-20
Jul-21
SELF-SUFFICIENCY PROGRAMS
50Coming up next:
• Child Welfare
oregon.gov/dhs
SELF-SUFFICIENCY PROGRAMS
51You can also read