Senior Report 2022 - America's Health Rankings
←
→
Page content transcription
If your browser does not render page correctly, please read the page content below

Senior Report 2022
Contents
Introduction                         2

10-Year National Highlights         6

Findings
    Mortality                        7
    Behavioral Health               10
    Physical Health                 15
    Immunizations                   20
    Smoking and Tobacco Use         22
    Social Support and Engagement   23

State Rankings                      25

National Summary                    27

References                          28
Introduction
The 10th edition of the America’s Health Rankings® Senior Report
reviews decade-long trends and provides insight into the preliminary
effects of the COVID-19 pandemic on seniors’ health and well-being.
The majority of measures included in this report feature data from
2020 or later.

The United Health Foundation is proud to release                and improve the health of older Americans. As the
the 10th edition of the America’s Health Rankings               demographic makeup of the nation’s older adult
Senior Report, which provides a portrait of the health          population continues to change, the United Health
and well-being of older adults in the United States.            Foundation is committed to providing actionable data
The report features long-term trends and disparities            and insights on the health needs of older Americans.
across demographic subpopulations in order to spark
meaningful dialogue and action to improve senior health         While the older adult population is growing across
across the nation and on a state-by-state basis.                the nation, they comprise a much larger share of the
                                                                population in some states than in others. In 2020,
The 2022 Senior Report highlights 10 years of                   Maine had the highest proportion of adults ages 65
successes and challenges in the health and well-being           and older (21.8%) and Utah had the lowest (11.7%). No
of older adults. While self-reported health status and          matter the size of the senior population, strengths,
use of preventive services such as flu vaccinations             challenges and disparities are present in every state,
improved over the past decade, behavioral health                demonstrated by the findings in this report. It is
measures such as drug deaths, excessive drinking,               important to consider the measures collectively, as
frequent mental distress, depression and suicide have           each measure influences and is influenced by other
worsened. Further, a decade of progress in reducing             measures of health as well as factors that affect
early mortality stopped with the COVID-19 pandemic —            seniors’ everyday lives.
disproportionately impacting older Americans of color.
                                                                This year’s Senior Report includes overall state
In 2020, there were more than 55.6 million adults               rankings once again; rankings were excluded in 2020
ages 65 and older in the United States, making up               and 2021 out of the shared understanding that the
approximately 16.9% of the population. This number is           country is facing significant and unprecedented
expected to rise to 73.1 million, or 21% of the population,     health challenges due to the COVID-19 pandemic.
by 2030 when the last of the baby boomer generation             Community leaders and advocates can use this year’s
ages into older adulthood.1 At that point, more than 1 in       report to tailor and target public health efforts in
5 people in the U.S. will be of retirement age. Thus, it        their states to address issues caused or exacerbated
is essential that policymakers, community leaders and           by the pandemic and, ultimately, build healthier
public health officials consider how to best safeguard          communities.

2                                      SENIOR REPORT 2022 AmericasHealthRankings.org
INTRODUCTION
Maine, Florida and West Virginia had the highest percentage
of older adults in 2020.
Percentage of
adults ages 65
and older
≤16.3%
DC
DC
DC
DC 16.4% to 16.9%
17.0% to 17.8%
DE
DE
17.9% to 18.6%
RI
≥18.7%
RI
Source: CDC WONDER,
Single-Race Population
Estimates, 2020.
Objective
While the older
America’s Health Rankings aims to inform and drive
action to build healthier communities by offering
credible, trusted data that can guide efforts to improve
adult population
health and health care. To achieve this, a comprehensive
set of measures were analyzed to assess the health of
is growing across
older adults across the nation. The report is based on:
the nation, they
comprise a much
• Sixty-two measures. These include 37 ranking, 14 non-
ranking and 11 subcomponent measures.
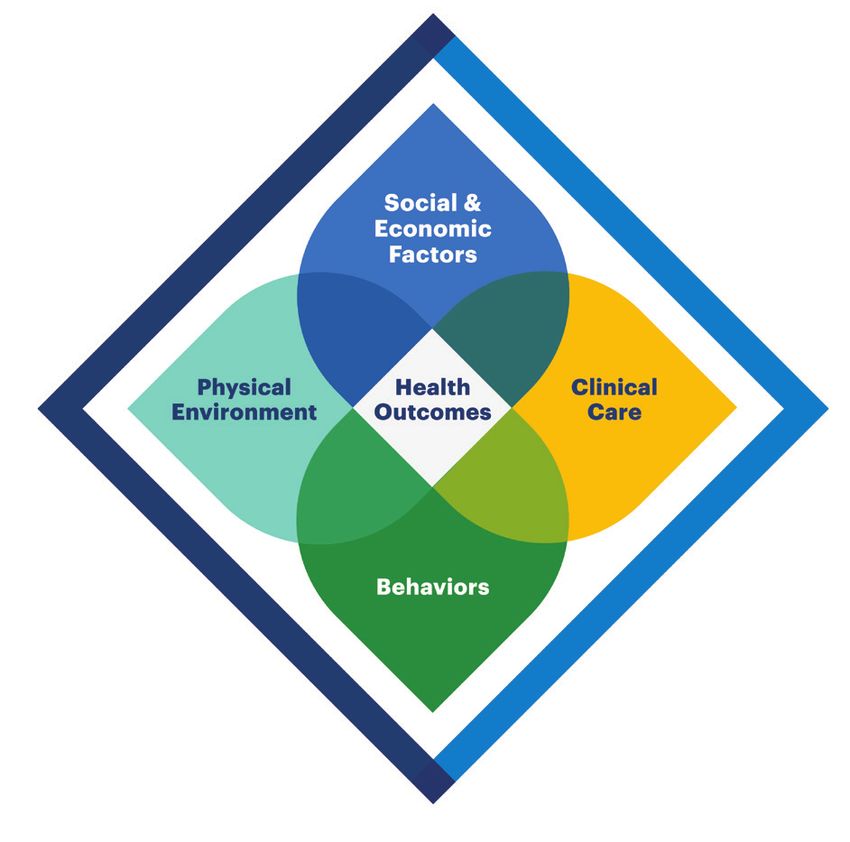
• Five categories of health. These include health
outcomes and four categories that are determinants
larger share of
of health: social and economic factors, physical
environment, behaviors and clinical care.
the population in
• Twenty-one data sources. The data included in this some states than
report are from many different sources, including the
Centers for Disease Control and Prevention’s (CDC)
Behavioral Risk Factor Surveillance System and the
in others.
Centers for Medicare & Medicaid Services’ (CMS)
Mapping Medicare Disparities Tool.
SENIOR REPORT 2022 AmericasHealthRankings.org 3
INTRODUCTION

                                  Improving All Seniors’
                                  Connectedness Helps Us Thrive
                                  Lisa Marsh Ryerson, President AARP Foundation

     As someone who works with older adults, I believe
     it is good news that 10,000 Americans turn 65 each
     day. Older adults are living longer, healthier and more
                                                                Our communities are healthiest when
     productive lives. They are a wonderful resource,           everyone is a full member, with the
     contributing talent, wisdom and enormous economic          voice, power and opportunity to
     value to our society.
                                                                contribute to their fullest potential.
     As this report shows, we have made significant
     progress over the past decade towards improving
     senior health. However, over the past two years,
     older adults have lost some ground as the COVID-19         connects them to resources and support in their
     pandemic laid bare significant health inequities and       own communities, both increasing awareness of
     the growing public health crisis of social isolation.      social isolation and lifting up possible solutions at the
                                                                individual and community levels.
     In many ways, the Senior Report reminds us of what
     we all already know: that who gets care, who gets          Social isolation has been a longstanding public health
     sick and who dies is rooted in where we are born and       issue for older adults but with the advent of the
     raised, where we go to school, where we work and           COVID-19 pandemic, awareness of the problem has
     live, our race, ethnicity, gender and socioeconomic        skyrocketed. We know that community engagement
     status. This is especially true during a pandemic in       and digital access can increase older adults’ well-
     which longstanding inequities caused by systemic           being. The Senior Report reminds us that we should
     racism and discrimination are important determinants       focus our talents, expertise and investments on
     of health. Meanwhile, necessary interventions aimed        solutions that address barriers to social connection.
     at slowing the virus’s spread have highlighted the
     importance of social connection among older adults         To make progress in improving senior health, we
     and others and the growing public health crisis of         must recognize that older adults are a resource to be
     social isolation.                                          tapped, not a problem to be solved. Our communities
                                                                are healthiest when everyone is a full member, with
     Unsurprisingly, a 2020 survey by AARP Foundation and       the voice, power and opportunity to contribute to
     the United Health Foundation found sharp increases         their fullest potential. With the data in the Senior
     across age cohorts in feelings of social isolation and     Report, and the solutions that AARP Foundation and
     anxiety. It confirmed the importance of person centric     countless other organizations are working towards,
     approach to health that includes increasing awareness      we can strengthen the connections between older
     of social isolation and the solutions to combat it. AARP   adults and their communities. By learning from their
     Foundation’s Connect2Affect, a consumer facing             experiences and drawing on their wisdom, we will
     assessment tool can help by allowing older adults,         create a healthier America. Because, when older
     their caregivers and loved ones to assess if an older      adults thrive, we all do.
     adult is socially isolated. If they are, Connect2Affect

4                                   SENIOR REPORT 2022 AmericasHealthRankings.org
INTRODUCTION

The report is intended to drive change
and improve health by promoting data-
driven discussions among individuals,
community leaders, public health workers,
policymakers and the media.

The America’s Health Rankings Senior Report aims to                    Model for Measuring
improve population health by:                                          America’s Health
• Presenting a holistic view of health. This report                    America’s Health Rankings is built
  goes beyond measures of clinical care and health                     upon the World Health Organization’s
  behaviors by considering social, economic and                        definition of health: “Health is a state
  physical environment measures. This reflects a growing               of complete physical, mental, and
  understanding of the impact of social determinants on                social well-being and not merely the
  health.                                                              absence of disease or infirmity.”

• Providing a benchmark for states. Each year the report
  presents trends, strengths, challenges and highlights
  for every state. Using the 10 years of data analyzed in
  the America’s Health Rankings Senior Report, public
  health advocates can monitor health trends over time
  and compare their state with neighboring states and the
  nation. This year, state summaries are available on the
  website as a separate download.

• Stimulating action. The report is intended to drive
  change and improve health by promoting data-driven
  discussions among individuals, community leaders,
  public health workers, policymakers and the media.
  States can incorporate the report into their annual
  review of programs, and many organizations use the
  report as a reference when assigning goals for health
  improvement plans.

• Highlighting disparities. The report shows differences
  in health between states and among population groups
  at the state and national level, with groupings based
  on geography, education level, income level, gender,
  age, and race and ethnicity. These analyses often
  reveal differences among groups that national or state
  aggregate data may mask.

                                     SENIOR REPORT 2022 AmericasHealthRankings.org                                           5
10-YEAR NATIONAL HIGHLIGHTS
10-Year National Highlights
Successes
PHYSICAL HEALTH PHYSICAL HEALTH IMMUNIZATIONS
High health status Teeth extractions Flu vaccination
13% 17% 11%
from 38.4% to 43.5% of from 16.1% to 13.4% of from 60.6% to 67.3% of
adults ages 65 and older adults ages 65 and older adults ages 65 and older
between 2011 and 2020. between 2012 and 2020. between 2011 and 2020.
Source: CDC, Behavioral Risk Factor Source: CDC, Behavioral Risk Factor Source: CDC, Behavioral Risk Factor
Surveillance System, 2011, 2020. Surveillance System, 2012, 2020. Surveillance System, 2011, 2020.
Challenges
MORTALITY BEHAVIORAL HEALTH BEHAVIORAL HEALTH
Early death Drug deaths Frequent mental distress
17% 100% 8%
from 1,765 to 2,072 deaths per from 4.2 to 8.4 deaths per from 7.5% to 8.1% of
100,000 adults ages 65-74 between 100,000 adults ages 65 and adults ages 65 and older
2019 and 2020 following a 4% older between 2008-2010 between 2011 and 2020.
decrease between 2011 and 2019. and 2018-2020.
Source: CDC WONDER, Multiple Cause Source: CDC WONDER, Multiple Cause Source: CDC, Behavioral Risk Factor
of Death Files, 2011, 2019, 2020. of Death Files, 2008-2010, 2018-2020. Surveillance System, 2011, 2020.
BEHAVIORAL HEALTH BEHAVIORAL HEALTH BEHAVIORAL HEALTH
Depression Excessive drinking Suicide
9% 16% 13%
from 13.0% to 14.2% of adults from 6.4% to 7.4% of from 15.0 to 16.9 deaths per
ages 65 and older between adults ages 65 and older 100,000 adults ages 65 and older
2011 and 2020. between 2011 and 2020. between 2009-2011 and 2018-2020.
Source: CDC, Behavioral Risk Factor Source: CDC, Behavioral Risk Factor Source: CDC WONDER, Multiple Cause
Surveillance System, 2011, 2020. Surveillance System, 2011, 2020. of Death Files, 2009-2011, 2018-2020.
PHYSICAL HEALTH SMOKING AND TOBACCO USE
Obesity Smoking
16% unchanged
from 25.3% to 29.3% of adults 8.9% of adults ages 65 and
ages 65 and older between older reported smoking in
2011 and 2020. 2011 and in 2020.
Source: CDC, Behavioral Risk Factor Source: CDC, Behavioral Risk Factor
Surveillance System, 2011, 2020. Surveillance System, 2011, 2020.
6 SENIOR REPORT 2022 AmericasHealthRankings.orgFINDINGS | MORTALITY
Findings
MORTALITY
After almost a decade of improvement, the early death rate among adults
ages 65-74 increased dramatically during the first year of the COVID-19
pandemic, disproportionately affecting older Americans of color.
Early Death
Those who are 65 should expect to live another 18.5 10-YEAR HIGHLIGHT
years, down 1.1 years from 2019, according to 2020
life expectancy estimates.2 Yet while the death rate Early deaths increased sharply from 2019
among adults ages 65-74 — considered an early death
to 2020, after decreasing since 2011.
— decreased steadily over the last decade, there was a
sudden, significant increase between 2019 and 2020,
and much of this increase was attributed to the COVID- 2,072
Deaths per 100,000 adults ages 65-74
19 pandemic. COVID-19 became a new top-10 cause 2,000
of death in 2020 and the third-leading cause of
17% increase
death among older adults, causing 76,277 deaths.3
There were also more deaths from cancer, heart
disease, diabetes, stroke, unintentional injury, liver 1,800
disease, kidney disease and influenza/pneumonia 1,765
in this age group in 2020 compared with 2019.3
The early death rate may continue to grow, as
1,600
provisional death data revealed that more deaths
due to COVID-19 occurred in 2021 than in 2020.4 2011 2013 2015 2017 2019 2020
Data Years
Between 2019 and 2020
Nationally, the number of deaths per 100,000 adults Source: CDC WONDER, Multiple Cause of Death Files, 2011-2020.
ages 65-74 significantly increased 17% from 1,765 to
2,072, corresponding to an increase of 118,948 deaths
over this time. This followed a 4% decrease between
2011 and 2019. The early death rate significantly
increased in 45 states and the District of Columbia, Indian/Alaska Native (1,925 to 2,548), 31% among
led by: 34% in the District of Columbia (1,932 to 2,593 Asian (832 to 1,094), 29% among Black (2,477 to
deaths per 100,000 adults ages 65-74), 33% in New 3,184) and 19% among multiracial (848 to 1,005)
York (1,528 to 2,026), 30% in New Jersey (1,562 to adults, as well as 18% among males (2,179 to 2,582).
2,036) and 23% in both Arizona (1,591 to 1,962) and
Louisiana (2,184 to 2,691). Disparities in 2020
All racial/ethnic and gender subpopulations The COVID-19 pandemic disproportionately affected
experienced significant increases in the early death some people of color, with American Indian/Alaska
rate. Increases greater than the national change Native and Black populations experiencing much
included: 48% among Hispanic (1,323 to 1,955 deaths higher COVID-19 mortality rates compared with non-
per 100,000 adults ages 65-74), 32% among American Hispanic white and Asian populations.5 According
SENIOR REPORT 2022 AmericasHealthRankings.org 7FINDINGS | MORTALITY
To Combat Health Disparities for Older
Adults and Communities of Color, We
Must Start with Data
Sue Peschin, MHS, President & CEO, Alliance for Aging Research
Addressing health disparities across race, ethnicity,
and age has long been central to our work at the
Alliance for Aging Research. The COVID-19 pandemic
Especially in a time when misinformation
disproportionately impacted older adults and communities and disinformation of science are
of color and has further highlighted the urgency of rampant, our policymakers need access
advancing health equity. As the data in the Senior Report
show, the toll of the pandemic significantly increased
to trusted, reliable data sources that are
mortality and drove down life expectancy for older adults, consistent over time.
particularly in communities of color. While early death
increased 17% nationally between 2019 and 2020, rates
rose much more significantly among populations of color, federal COVID-19 vaccination recommendations
including 48% among Hispanic, 32% among American prioritized adults ages 75 and older, while the average
Indian/Alaska Native, 31% among Asian and 29% among age of COVID-19 deaths and cases in communities
Black adults ages 65-74. Meanwhile, many other challenges of color was several years younger — leaving those
including “deaths of despair” (i.e., drug overdoses, suicide, communities to wait longer to get access to limited
and alcoholic liver disease) were aggravated by the vaccine supplies and underscoring that demographics
pandemic, underscoring the trade-offs inherent to policies beyond older age were critically missed in data
that have an isolating effect on older adults. analyses. Data sources provided early in the pandemic
did not consistently provide cross-tabulations studying
As we seek to understand and address these longstanding the intersection of COVID-19 with both age and race/
challenges and disparities, it is critical to examine ethnicity. While this lack of information created blinders
negative social determinants of health and their impact at a vital time, we know now how valuable it is to have
on health challenges in communities of color. Experiences comprehensive subpopulation-level data over time to
with aging are shaped by many social factors such as drive equitable public health efforts.
structural racism, safety of living conditions, access
to quality health care and education, and our level of The pandemic revealed stark inequities in health
financial resources. The life-changing outcomes of these outcomes that should be studied to inform what
social determinants of health have been thrown into sharp actions our nation’s public health system prioritizes
focus by the pandemic. moving forward. When collected and analyzed
through an equity lens, data can better guide
We clearly have a lot of work to do, but data collection will effective solutions for all. Especially in a time when
help with understanding just how far we need to go and misinformation and disinformation of science are
where to target our efforts. That is where comprehensive, rampant, our policymakers need access to trusted,
evidence-based resources like America’s Health Rankings reliable data sources that are consistent over time. I
have an important role to play. urge public health officials, community leaders and
health advocates to explore, and make use of, the data
The COVID-19 pandemic taught us lessons about how
available in the Senior Report as we work toward a
the absence of timely access to detailed, reliable data
healthier future for older adults across all communities.
can exacerbate health inequity. For example, initial
8 SENIOR REPORT 2022 AmericasHealthRankings.orgFINDINGS | MORTALITY
to the CDC, inequities in the social determinants All racial and ethnic subpopulations
of health are driven by the negative effects of experienced significant increases
interpersonal and structural racism, placing in the early death rate.
communities of color at risk for poor health
outcomes.6
29% Black
The early death rate was lowest in Hawaii (1,527 3,000
deaths per 100,000 adults ages 65-74), Vermont
(1,611) and New Hampshire (1,637); it was highest 32%
American Indian/
Deaths per 100,000 adults ages 65-74
in Mississippi (3,024), Oklahoma (2,781) and Alaska Native
2,500
Alabama (2,767). 14%
Hawaiian/Pacific
Islander
The early death rate significantly varied by
race/ethnicity and gender. The rate was 3.2 12% White
2,000
times higher among Black adults (3,184 deaths 48% Hispanic
per 100,000 adults ages 65-74) than among
multiracial adults (1,005) and 1.6 times higher
among males (2,582) than among females (1,627). 1,500
Early Death Racial Disparity 31% Asian
1,000 19% Multiracial
Between 2019 and 2020
Nationally, the ratio of the early death rate among
2019 2020
Black adults (3,184 deaths per 100,000 adults Data Years
ages 65-74) compared with the rate among
white adults (1,999) increased 14% from 1.4 to 1.6
Source: CDC WONDER, Multiple Cause of Death Files, 2019, 2020.
between 2019 and 2020.
Disparities in 2020
Arkansas had the largest early death racial
disparity ratio at 4.4, followed by the District of
Columbia (3.8), South Dakota (3.6) and North Early death was higher in Mississippi
Dakota (3.5). In Arkansas, Hawaiian/Pacific than in Hawaii in 2020.
Islander adults had the highest early death rate
Deaths per 100,000 adults ages 65-74
at 11,504 deaths per 100,000 adults ages 65-74,
compared with 2,630 among white adults. New
Hampshire had the smallest early death racial
disparity ratio at 1.0, followed by Kentucky and
3,024 2.0x
Rhode Island (both 1.2). In New Hampshire, there Mississippi
was no relative difference in the early death rate
between white (1,664) and Hispanic (1,109) adults. 1,527
In Kentucky and Rhode Island, Black adults (3,229
and 2,228, respectively) had similar early death Hawaii
rates compared with white adults (2,622 and
1,845, respectively). Source: CDC WONDER, Multiple Cause of Death Files, 2020.
SENIOR REPORT 2022 AmericasHealthRankings.org 9FINDINGS | BEHAVIORAL HEALTH
BEHAVIORAL HEALTH
Behavioral health measures among older adults have worsened
over the past decade.
Drug Deaths
There are a variety of reasons why older adults are Among adults ages 65-74, drug deaths increased
particularly at risk for drug overdoses. They may 147% from 4.7 to 11.6 deaths per 100,000 — the largest
unintentionally misuse prescription medications like increase compared with all other age groups 15 and
opioids, are more likely to be taking prescription older. Both males and females experienced significant
medications than other populations and face other increases in the drug death rate: 172% for males (4.3 to
risk factors including social isolation.7,8,9 Drug abuse is 11.7 deaths per 100,000 adults ages 65 and older) and
particularly dangerous for this population: Older adults 38% for females (4.2 to 5.8).
face a reduced ability to metabolize medications due to
age-related changes in the liver.10 Disparities in 2018-2020
Between 2008-2010 and 2018-2020 The drug death rate was lowest in Nebraska (3.3 deaths
per 100,000 adults ages 65 and older), Iowa (4.5) and
Nationally, the number of deaths due to drug injury Mississippi (4.8); it was highest in the District of Columbia
(unintentional, suicide, homicide or undetermined) (49.5), Nevada (15.5), Maryland (14.8) and Rhode Island
per 100,000 adults ages 65 and older significantly (11.7).
increased 100% from 4.2 to 8.4, corresponding to an
increase of 8,620 deaths over this period. The drug The drug death rate significantly varied by race/ethnicity
death rate significantly increased in 35 states, led by: and gender. The rate was 10.4 times higher among Black
352% in Connecticut (2.3 to 10.4 deaths per 100,000 adults (19.8 deaths per 100,000 adults ages 65 and
adults ages 65 and older), 323% in Maryland (3.5 to older) than among Asian adults (1.9) and 2.0 times higher
14.8) and 222% in New Jersey (2.7 to 8.7). among males (11.7) than among females (5.8).
The rate of drug deaths doubled, The rate of drug deaths among older
resulting in 8,620 more deaths. Black adults was higher than among
older Asian adults in 2018-2020.
10-YEAR HIGHLIGHT
Drug Deaths
10.4x
100% 19.8
deaths per 100,000 Black
adults ages 65 and older
deaths per 100,000 adults
ages 65 and older between 1.9
2008-2010 and 2018-2020. deaths per 100,000 Asian
adults ages 65 and older
Source: CDC WONDER, Multiple Cause of Death Files, Source: CDC WONDER, Multiple Cause of Death Files, 2018-2020.
2008-2010, 2018-2020.
10 SENIOR REPORT 2022 AmericasHealthRankings.orgFINDINGS | BEHAVIORAL HEALTH
Frequent Mental Distress 10-YEAR HIGHLIGHT
Frequent mental distress is an indicator of health- Frequent
related quality of life and the burden of mental
Mental Distress
8%
illness in a population. Frequent mental distress is
characterized by 14 or more days of self-reported
poor mental health in the past month and is
associated with risk factors for poor health.11,12 between 2011 and 2020.
Between 2011 and 2020
Source: CDC, Behavioral Risk Factor Surveillance
Nationally, the percentage of adults ages 65 System, 2011, 2020.
and older who reported their mental health was
not good 14 or more days in the past 30 days
significantly increased 8% from 7.5% to 8.1%.
Frequent mental distress among older adults
significantly increased 81% in Hawaii (4.2% to 10-YEAR HIGHLIGHT
7.6%), 61% in Michigan (6.6% to 10.6%) and 57% in
Washington (5.3% to 8.3%). Frequent mental distress
significantly increased across all
Some income, education, gender and racial/ethnic
subpopulations experienced significant increases income groups.
in frequent mental distress. Among adults ages
65 and older, increases greater than the national 15%
12% Less than $25,000
change included:
• 47% among those with an annual household
Percentage of adults ages 65 and older
income of $50,000 to $74,999 (4.3% to 6.3%),
41% among those with an income of $75,000 or
more (3.7% to 5.2%), 24% among those with an 9%
24%
income of $25,000 to $49,999 (6.7% to 8.3%) and
$25,000 to $49,999
15% among those with an income below $25,000
(10.9% to 12.5%).
47%
• 27% among those with some post-high school 6% $50,000 to $74,999
education (7.0% to 8.9%) and 23% among college 41%
graduates (4.4% to 5.4%). $75,000 or more
• 16% among females (8.1% to 9.4%).
3%
• 15% among white adults (6.8% to 7.8%).
2011 2020
Data Years
Source: CDC, Behavioral Risk Factor Surveillance System, 2011, 2020.
SENIOR REPORT 2022 AmericasHealthRankings.org 11FINDINGS | BEHAVIORAL HEALTH
Frequent mental distress was Depression
higher in Michigan than in North
Between 2011 and 2020
Dakota in 2020.
Percentage of adults ages 65 and older Nationally, the percentage of adults ages 65
and older who reported being told by a health
2.2x
professional that they have a depressive disorder
10.6% significantly increased 9% from 13.0% to 14.2%.
Depression significantly increased in seven states,
Michigan
led by Washington (12.6% to 20.0%), Hawaii (7.1% to
10.9%) and West Virginia (12.4% to 19.0%). During the
4.8%
same period, depression significantly decreased in
North Dakota Alaska (19.2% to 10.4%) and Illinois (13.4% to 8.2%).
All income and some education, racial/ethnic and
gender subpopulations experienced significant
Source: CDC, Behavioral Risk Factor Surveillance System, 2020.
increases in depression.
Disparities in 2020
Disparities in 2020
Depression among older adults was lowest in Illinois
Frequent mental distress among older adults was (8.2%) and highest in Washington (20.0%). The
lowest in North Dakota (4.8%), South Dakota (5.1%) prevalence significantly varied by race/ethnicity,
and Wisconsin (5.8%); it was highest in Michigan gender, income and education; differences by
(10.6%), the District of Columbia, Kentucky and metropolitan status were not notable.
Nevada (all 10.3%) and West Virginia (10.2%).
Frequent mental distress significantly varied by
Excessive Drinking
race/ethnicity, income, education and gender; Between 2011 and 2020
differences by metropolitan status were not notable.
The prevalence among adults ages 65 and older was Nationally, the percentage of adults ages 65 and
higher among: older who reported binge drinking (four or more
drinks for females or five or more drinks for males on
• American Indian/Alaska Native adults (15.6%), 4.0 one occasion in the past 30 days) or heavy drinking
times higher than among Asian adults (3.9%). The (eight or more drinks for females or 15 or more drinks
prevalence was also significantly higher among for males per week) significantly increased 16% from
American Indian/Alaska Native adults than among 6.4% to 7.4%, affecting 3.8 million older adults in
Black (6.8%) and white (7.8%) adults. 2020.
• Those with an annual household income below Some racial/ethnic, gender and education
$25,000 (12.5%), 2.4 times higher than among those subpopulations experienced significant increases
with an income of $75,000 or more (5.2%); the in excessive drinking; changes by income were not
prevalence was significantly lower among those notable. Excessive drinking significantly increased in
with incomes of $75,000 or more and $50,000 to Kansas (4.0% to 5.9%), Nebraska (5.4% to 7.2%), North
$74,999 (6.3%) compared with all other income Carolina (4.0% to 6.4%), Ohio (4.6% to 7.8%) and West
levels. Virginia (2.1% to 4.3%).
• Those with less than a high school education Disparities in 2020
(12.0%), 2.2 times higher than among college
graduates (5.4%). Excessive drinking among older adults was lowest
in Utah (2.7%) and highest in Wisconsin (11.8%). The
• Females (9.4%) than among males (6.5%). prevalence significantly varied by income, education,
race/ethnicity, gender and metropolitan status.
12 SENIOR REPORT 2022 AmericasHealthRankings.orgFINDINGS | BEHAVIORAL HEALTH
Improving Primary and Mental
Health Care for Seniors Lifts Us All
Dr. Jennifer Kim, President-Elect, Gerontological Advanced
Practice Nurses Association (GAPNA)
The wisdom I gain from caring for seniors is what has
always driven my passion for promoting the health of
To close gaps in senior health, we
older adults. When I first started working as a nursing
assistant in 1991, it was easy to see the gaps in health must address language barriers,
services for older adults. Over thirty years later, these teach cultural competency and
challenges persist — and have only gotten worse.
prioritize equity and inclusion in both
Seniors and their caregivers are the salt of the earth; access to and provision of care.
they work incredibly hard, yet the challenges they
face are underappreciated by so many — a reality
underscored by the effects of the pandemic on this
population. At the Gerontological Advanced Practice older adults, especially low-income individuals,
Nurses Association, we believe that community people of color and those with chronic diseases.
advocates can use data to draw attention to the For example, while digital literacy has gone from a
problems facing older adults to drive the public privilege to a necessity, many poorer older adults
health conversation. Platforms like America’s Health don’t have the means to purchase a smartphone
Rankings provide valuable insights that guide our or reliable internet access, putting them at risk for
work and help us engage with students, lawmakers, experiencing isolation and losing access to essential
advocates and others. services. Even when they can access in-person
care, the lack of diversity in the health workforce
The pandemic has highlighted the importance of
serves as a barrier for patients of color who are
primary care and mental health services among older
often more comfortable working with providers who
adults; the Senior Report finds increases in mortality
come from their own communities. To close gaps in
from chronic conditions like cancer and heart
senior health, we must address language barriers,
disease, which may have potentially been prevented
teach cultural competency and prioritize equity and
earlier through primary care, as well as rising rates of
inclusion in both access to and provision of care.
depression and frequent mental distress. Many older
adults avoided providers’ offices in-person because As the nation’s older adult population continues to
of the fear of infection from COVID-19, and some may grow, the Senior Report reminds us how important it
have had a difficult time navigating telehealth visits — is to be thoughtful and passionate about addressing
especially those with cognitive deficits. This resulted the needs of this population. Improving access to and
in delays in screenings and preventive care and quality of preventive care and mental health services
missed opportunities for treating chronic conditions, are just two of the many issues that policymakers
contributing to the significant toll the pandemic took should prioritize, guided by data from the Senior
on many seniors’ emotional health and cognition. Report, to help advance health equity and improve
the lives of seniors everywhere. The healthier our
Like the coronavirus itself, these challenges
seniors are, the more we can learn from their wisdom
disproportionately impacted the most vulnerable
and the healthier we all will be as we age.
SENIOR REPORT 2022 AmericasHealthRankings.org 13FINDINGS | BEHAVIORAL HEALTH
Suicide 10-YEAR HIGHLIGHT
Suicide is a tragic public health issue that Suicide
leaves a lasting impact on families and
communities. Recorded suicide attempts
among older adults are usually more lethal 13%
than those among younger age groups.13 Older deaths per 100,000 adults ages 65 and
adults may also exhibit passive self-harm older between 2009-2011 and 2018-2020.
behaviors that can result in death, such as
refusing food, medications or liquids; these are
Source: CDC WONDER, Multiple Cause of Death Files,
rarely recorded as suicide attempts or deaths 2009-2011, 2018-2020.
by suicide.14
Between 2009-2011 and 2018-2020
Nationally, the number of deaths due to
intentional self-harm per 100,000 adults ages Suicide was higher in Wyoming than
65 and older significantly increased 13% from in New Jersey in 2018-2020.
15.0 to 16.9, corresponding to an increase of
Deaths per 100,000 adults ages 65 and older
9,239 deaths over this period. In 2018-2020,
27,412 older adults died by suicide. The suicide
rate significantly increased in nine states, led
by: 40% in Connecticut (9.6 to 13.4 deaths per
35.5 3.8x
100,000 adults ages 65 and older), 37% in Ohio Wyoming
(11.9 to 16.3) and 34% in Oklahoma (16.3 to 21.8).
9.4
Disparities in 2018-2020
New Jersey
The suicide rate was lowest in the District of
Columbia (8.8 deaths per 100,000 adults ages
Source: CDC WONDER, Multiple Cause of Death Files, 2018-2020.
65 and older), New Jersey (9.4), New York (9.7)
and Massachusetts (9.8); it was highest in
Wyoming (35.5), Montana (30.7) and Nevada
(30.4).
The suicide rate varied by gender, race/ Suicide was higher in males than in
ethnicity and age. The rate was higher among: females in 2018-2020.
• Males (31.6 deaths per 100,000 adults ages
65 and older), 6.2 times higher than among
females (5.1).
• White adults (20.2), 4.7 times higher than
6.2x 31.6
deaths per
100,000 males
among Black adults (4.3). The rate was ages 65 and older
significantly higher among white adults
compared with all other racial/ethnic groups. 5.1
deaths per
100,000 females
• Adults ages 85 and older (20.0) than among
ages 65 and older
adults ages 65-74 (15.4). The rate was
significantly higher with each increase in age
group. Source: CDC WONDER, Multiple Cause of Death Files, 2018-2020.
14 SENIOR REPORT 2022 AmericasHealthRankings.orgFINDINGS | PHYSICAL HEALTH
PHYSICAL HEALTH
Self-reported high health status has improved since the inaugural Senior
Report, and teeth extractions have decreased. However, obesity has
worsened, and nearly half of older adults have multiple chronic conditions.
High Health Status 10-YEAR HIGHLIGHT
Self-reported health status is a measure of how
individuals perceive their health, rating it as High health status increased sharply
excellent, very good, good, fair or poor.15 Among from 2019 to 2020, after decreasing
adults ages 65 and older, self-reported health since 2016, reaching its highest point
status is a good predictor of short- and long-term in Senior Report history.
mortality.16 It is also a good predictor of future health
care use.17,18 45
Percentage of adults ages 65 and older
6% increase 43.5%
Between 2011 and 2020
Nationally, the percentage of adults ages 65 and 40
41.0%
older who reported their health was very good or
excellent significantly increased 13% from 38.4% to
43.5%. High health status has generally increased 35
since 2011, with a large part of this change occurring
in the past year, increasing 6% from 41.0% in 2019
and reaching its highest point in 2020. More than 30
24.5 million older adults reported that their health 2011 2013 2015 2017 2019 2020
was very good or excellent in 2020, an increase of Data Years
approximately 2.6 million older adults between 2019
and 2020. High health status among older adults
significantly increased in 33 states and the District of Source: CDC, Behavioral Risk Factor Surveillance System, 2011-2020.
Columbia, led by: 33% in Wisconsin (39.0% to 52.0%),
32% in Rhode Island (36.9% to 48.8%) and 30% in
New York (35.0% to 45.5%).
Some racial/ethnic, gender and education
subpopulations experienced significant increases
in high health status; changes by income were not
notable. Among adults ages 65 and older, increases
greater than the national change included: 28%
among Black (24.1% to 30.9%) and 14% among white
(41.5% to 47.4%) adults, as well as 14% among females
(38.8% to 44.3%).
SENIOR REPORT 2022 AmericasHealthRankings.org 15FINDINGS | PHYSICAL HEALTH
Disparities in 2020 High health status was higher in
High health status among older adults was highest New Hampshire than in Alabama
in New Hampshire (55.8%), Colorado (53.5%) and in 2020.
Vermont (53.1%); it was lowest in Alabama (32.5%), Percentage of adults ages 65 and older
Mississippi (32.6%) and West Virginia (33.2%).
High health status significantly varied by
education, income, race/ethnicity and metropolitan
55.8% 1.7x
status; differences by gender were not notable. The New Hampshire
prevalence among adults ages 65 and older was
higher among: 32.5%
• College graduates (58.7%), 2.7 times higher Alabama
than among those with less than a high
school education (21.5%). The prevalence Source: CDC, Behavioral Risk Factor Surveillance System, 2020.
was significantly higher with each increase in
education level.
• Those with an annual household income of
$75,000 or more (61.3%), 2.2 times higher than
among those with an income below $25,000
(27.5%). The prevalence was significantly higher High health status was higher
with each increase in income level. among college graduates than
among those with less than a high
• White adults (47.4%), 1.8 times higher than among
school education in 2020.
Hispanic adults (25.7%). The prevalence was also
significantly higher among white adults than
among multiracial (38.4%), American Indian/
2.7x
Alaska Native (31.6%) and Black (30.9%) adults. 58.7%
adults ages 65
• Those living in metropolitan (44.4%) than among and older who
those living in non-metropolitan (39.7%) areas. graduated college
21.5%
adults ages 65 and
older with less
than a high school
education
Source: CDC, Behavioral Risk Factor Surveillance
System, 2020.
16 SENIOR REPORT 2022 AmericasHealthRankings.orgFINDINGS | PHYSICAL HEALTH
Teeth Extractions
Having all or some permanent teeth missing is associated Disparities in 2020
with increased risk of disability, mortality and decreased
daily function and quality of life.19,20 Missing teeth or The percentage of teeth extractions among older
having dentures can also impair one’s ability to eat and adults was lowest in Hawaii (5.6%), Minnesota (8.8%),
speak, and is associated with poor nutrition.20 Severe oral and California and Maryland (both 9.0%); it was highest
health issues that impact daily life are also associated with in Kentucky (22.4%), West Virginia (22.2%) and Arkansas
loneliness.21,22 (21.5%).
Between 2012 and 2020 Teeth extractions significantly varied by education,
income, race/ethnicity and metropolitan status;
Nationally, the percentage of adults ages 65 and older differences by gender were not notable. The
who reported having all their teeth removed due to prevalence among adults ages 65 and older was higher
decay or gum disease significantly decreased 17% from among:
16.1% to 13.4%. Teeth extraction prevalence has generally
decreased continuously since 2012, reaching its lowest • Those with less than a high school education (29.8%),
point in 2020. Still, 7.1 million older adults reported 8.1 times higher than among college graduates (3.7%).
in 2020 that they had all their teeth removed. Teeth The prevalence was significantly higher with each
extractions among older adults significantly decreased in decrease in education level.
20 states, led by: 40% in Louisiana (28.7% to 17.2%), 38% in
• Those with an annual household income below
Maryland (14.5% to 9.0%) and 34% in both Kansas (18.8%
$25,000 (25.3%), 7.0 times higher than among
to 12.4%) and West Virginia (33.7% to 22.2%).
those with an income of $75,000 or more (3.6%).
Some education, racial/ethnic and gender subpopulations The prevalence was significantly higher with each
experienced significant decreases in teeth extractions; decrease in income level.
changes by income were not notable. Among adults ages
• American Indian/Alaska Native adults (23.7%), 5.0
65 and older, decreases greater than the national change
times higher than among Asian adults (4.7%). The
included:
prevalence was significantly lower among Asian
• 21% among college graduates (4.7% to 3.7%). adults compared with all other racial/ethnic groups.
• 19% among Black (24.7% to 20.1%) and 18% among white • Those living in non-metropolitan (18.3%) than among
(15.4% to 12.6%) adults. those living in metropolitan (12.3%) areas.
• 18% among females (16.3% to 13.4%).
Teeth extractions have Teeth 29.8%
8.1x Less Than High School
decreased since 2012, reaching extractions
its lowest prevalence in 2020. among 17.7%
4.8x High School Grad/GED
older adults
10-YEAR HIGHLIGHT significantly 10.7%
varied by 2.9x Some Post-High School
Teeth Extractions education
17% in 2020. 3.7%
College Graduate
between 2012 and 2020.
Source: CDC, Behavioral Risk Factor Surveillance Source: CDC, Behavioral Risk Factor Surveillance System, 2020.
System, 2012, 2020.
SENIOR REPORT 2022 AmericasHealthRankings.org 17FINDINGS | PHYSICAL HEALTH
Obesity 10-YEAR HIGHLIGHT
Adults with obesity have an increased risk of Obesity
16%
developing serious health conditions such as
hypertension, Type 2 diabetes, stroke, sleep apnea
and breathing problems, osteoarthritis and certain
cancers, as well as mental illnesses like depression between 2011 and 2020.
and anxiety.23 Some research suggests that the
strength of the association between obesity and
Source: CDC, Behavioral Risk Factor Surveillance
mortality risk increases with age, making obesity System, 2011, 2020.
among older adults of particular concern.24
Between 2011 and 2020
Nationally, the percentage of adults ages 65 and older
with a body mass index of 30.0 or higher based on 10-YEAR HIGHLIGHT
reported height and weight significantly increased
16% from 25.3% to 29.3%. Obesity among older adults Obesity significantly increased
significantly increased in 19 states, led by 60% in across all income groups.
Nevada (18.1% to 28.9%), 45% in Wyoming (20.4% to
29.5%) and 36% in South Dakota (23.8% to 32.4%). 16%
Less than $25,000
All income and some education, racial/ethnic and
20%
gender subpopulations experienced significant
$25,000 to $49,999
increases in obesity. Among adults ages 65 and older,
Percentage of adults ages 65 and older
increases greater than the national change included: 30% 16%
$50,000 to $74,999
• 28% among those with an annual household income
of $75,000 or more (20.3% to 26.0%) and 20%
among those with an income of $25,000 to $49,999
(26.1% to 31.4%). 28%
$75,000 or more
• 24% among both those with some post-high school 25%
education (25.1% to 31.0%) and college graduates
(18.9% to 23.5%) and 19% among those with a high
school degree or GED diploma (26.0% to 30.9%).
• 18% among white adults (24.1% to 28.4%).
20%
Disparities in 2020
Obesity among older adults was lowest in Hawaii 2011 2020
(18.7%), New York (23.6%) and Colorado (23.9%); it was Data Years
highest in Delaware (37.6%), Louisiana (36.2%) and
Michigan (35.6%). Source: CDC, Behavioral Risk Factor Surveillance System, 2011, 2020.
18 SENIOR REPORT 2022 AmericasHealthRankings.orgFINDINGS | PHYSICAL HEALTH
Obesity significantly varied by race/ethnicity, Obesity was higher among older
education, income and metropolitan status; differences Hispanic adults than among
by gender were not notable. The prevalence among older Asian adults in 2020.
adults ages 65 and older was higher among:
• Hispanic (36.2%), Black (36.1%) and American Indian/
Alaska Native (35.7%) adults than among Asian adults
5.7x
(6.4%). The prevalence was significantly lower among
Asian adults compared with all other racial/ethnic 36.2%
Hispanic adults
groups. ages 65 and older
• Those with less than a high school education 6.4%
(33.7%) than among college graduates (23.5%). The Asian adults ages
65 and older
prevalence was significantly lower among college
graduates compared with all other education levels.
• Those with an annual household income below
Source: CDC, Behavioral Risk Factor Surveillance
$25,000 (33.1%) than among those with an income System, 2020.
of $75,000 or more (26.0%). The prevalence was
significantly lower among those with an income of
$75,000 or more compared with all other income
groups.
• Those living in non-metropolitan (31.6%) than among
those living in metropolitan (28.7%) areas. Nearly half of Medicare beneficiaries
ages 65-74 had multiple chronic
conditions in 2020.
Multiple Chronic Conditions
2020
Nationally, 46% of Medicare beneficiaries ages 65-74
enrolled in the fee-for-service program had three or
46%
more of 21 chronic conditions identified by the Chronic
Conditions Warehouse. The prevalence of multiple
chronic conditions was lowest in Alaska and Wyoming
(both 28%) as well as Montana and Vermont (both
30%); it was highest in Alabama (58%), West Virginia Source: U.S. HHS, Centers for Medicare & Medicaid
(55%) and Louisiana and Delaware (both 54%). Multiple Services, Office of Minority Health, Mapping Medicare
Disparities Tool, 2020.
chronic conditions varied by race/ethnicity; differences
by gender were not notable. The prevalence was higher
among Black (53%) than among Asian/Pacific Islander
(40%) adults.
SENIOR REPORT 2022 AmericasHealthRankings.org 19FINDINGS | IMMUNIZATIONS
Flu vaccination reached its Flu vaccination was higher in Massachusetts
highest level in 2020. than in Alaska in 2020.
Percentage of adults ages 65 and older
10-YEAR HIGHLIGHT
Flu Vaccination
75.6% 1.3x
11%
Massachusetts
56.1%
between 2011 and 2020.
Alaska
Source: CDC, Behavioral Risk Factor Surveillance Source: CDC, Behavioral Risk Factor Surveillance System, 2020.
System, 2011, 2020.
IMMUNIZATIONS
In the last decade, the percentage of older adults who have received flu
vaccinations has improved. More recently, older adults have been receiving
COVID-19 vaccinations and boosters.
Flu Vaccination
The flu vaccine helps protect individuals against All income and some racial/ethnic, education and
seasonal flu viruses and reduces the severity of illness gender subpopulations experienced significant
for those who get sick.25 As immune defense systems increases in flu vaccination. Among adults ages
weaken with age, older adults are at increased risk of 65 and older, increases greater than the national
contracting influenza viruses and having serious health change included:
complications as a result of infection.26
• 26% among Asian (59.9% to 75.5%), 17% among
Between 2011 and 2020 Black (49.3% to 57.8%) and 12% among white
(62.2% to 69.6%) adults.
Nationally, the percentage of adults ages 65 and older
who reported receiving a seasonal flu vaccine in the • 18% among those with an annual household
past 12 months significantly increased 11% from 60.6% income of $75,000 or more (63.1% to 74.2%) and
to 67.3%, equaling about 35 million older adults in 2020. 13% among those with an income of $50,000 to
The percentage significantly increased 5% from 63.8% in $74,999 (62.9% to 71.3%).
2019, reaching its highest value in 2020. Flu vaccination
among older adults significantly increased in 26 states • 16% among college graduates (64.3% to 74.4%).
and the District of Columbia, led by: 32% in Illinois
• 12% among males (60.0% to 66.9%).
(54.7% to 72.1%), 28% in Rhode Island (56.6% to 72.7%)
and 24% in both Michigan (58.0% to 71.7%) and New Disparities in 2020
Hampshire (57.4% to 70.9%). During the same period,
flu vaccination significantly decreased 8% in Louisiana Flu vaccination among older adults was highest in
(70.2% to 64.4%). Massachusetts (75.6%), North Carolina (74.6%) and
Connecticut (74.0%); it was lowest in Alaska (56.1%),
Wyoming (59.4%) and Florida (61.6%).
20 SENIOR REPORT 2022 AmericasHealthRankings.orgFINDINGS | IMMUNIZATIONS
Flu vaccination significantly varied by race/ Flu vaccination was higher among older
ethnicity, education, income and metropolitan Asian adults than among older adults
status; differences by gender were not notable. The
who identify as other race in 2020.
prevalence among adults ages 65 and older was
higher among:
75.5%
Asian adults ages
• Asian adults (75.5%), 1.5 times higher than among 65 and older
adults who identify as other race (51.6%). White
adults (69.6%) also had a high prevalence, 51.6%
significantly higher than among multiracial (61.8%), Other race adults
ages 65 and older
Hispanic (58.6%), Black (57.8%) and American Indian/
Alaska Native (55.5%) adults.
• College graduates (74.4%) than among those with
Source: CDC, Behavioral Risk Factor Surveillance System, 2020.
less than a high school education (58.4%). The
prevalence was significantly higher with each
increase in education level.
• Those with an annual household income of $75,000
or more (74.2%) than among those with an income Nearly 9 in 10 adults ages 65 and
below $25,000 (60.6%). The prevalence was older were fully vaccinated against
significantly higher among the top two income COVID-19 as of March 17, 2022.
levels compared with the bottom two income levels.
• Those living in metropolitan (68.1%) than among
those living in non-metropolitan (63.6%) areas.
COVID-19 Vaccination 88.9%
As of March 17, 2022, 88.9% of adults ages 65 and
older were fully vaccinated, defined as having
received the second dose in a two-dose COVID-19
vaccine series or one dose of the single-shot Johnson Source: CDC, COVID Data Tracker, March 17, 2022.
& Johnson/Janssen COVID-19 vaccine. The prevalence
of COVID-19 vaccination was highest in Vermont,
Rhode Island, Minnesota, Maine and Connecticut (all
95.0%); it was lowest in Arkansas (79.6%), Alabama
(81.2%) and Georgia (82.4%). About 2 in 3 fully vaccinated
adults ages 65 and older received
Additionally, 66.8% of fully vaccinated adults ages
65 and older later received a booster dose of any a booster dose of any COVID-19
COVID-19 vaccine. The prevalence of older adults vaccine as of March 17, 2022.
with a COVID-19 vaccination and a booster dose was
highest in Minnesota (81.5%), Wisconsin (79.9%) and
Vermont (78.9%); it was lowest in New Hampshire
(35.6%), North Carolina (39.5%) and Georgia (55.1%).
Additional COVID-19 data are available on the website. 66.8%
Source: CDC, COVID Data Tracker, March 17, 2022.
SENIOR REPORT 2022 AmericasHealthRankings.org 21FINDINGS | SMOKING AND TOBACCO USE
Smoking was higher in Tennessee Smoking was
than in Utah in 2020. higher among
3.2x
13.1%
Percentage of adults ages 65 and older those with adults ages 65 and
older with less
less than a than a high school
14.0% 4.1x high school
education
education
4.1%
Tennessee than among adults ages 65
and older who
college graduates graduated college
3.4%
in 2020.
Utah
Source: CDC, Behavioral Risk Factor Surveillance Source: CDC, Behavioral Risk Factor Surveillance System, 2020.
System, 2020.
SMOKING AND TOBACCO USE
Despite national prevention efforts, smoking prevalence has not
changed since 2011.
Smoking
Smoking cigarettes is the leading cause of preventable Disparities in 2020
death in the United States.27 Even among older adults
Smoking among older adults was lowest in Utah (3.4%),
and long-term smokers, smoking cessation has been
California (5.4%) and New Jersey (6.7%); it was highest
shown to improve health outcomes.28
in Tennessee (14.0%), Nevada (13.4%) and Kentucky
Between 2011 and 2020 (13.0%).
Nationally, the percentage of adults ages 65 and older Smoking varied the most by education, income and
who reported smoking at least 100 cigarettes in their race/ethnicity, but also significantly varied by gender
lifetime and currently smoke daily or some days did and metropolitan status. The prevalence in adults ages
not change; the prevalence was 8.9% in both 2011 and 65 and older was higher among:
2020. This is in contrast with a significant decrease
• Those with less than a high school education (13.1%),
in smoking prevalence among adults ages 18–44 and
3.2 times higher than among college graduates (4.1%).
45–64 during the past decade. Smoking among older
adults did not notably change in any states during this • Those with an annual household income below
time. $25,000 (14.7%), 3.1 times higher than among
those with an income of $75,000 or more (4.7%).
Some education and income subpopulations
The prevalence was significantly higher with each
experienced significant changes in smoking; changes
decrease in income level.
by race/ethnicity and gender were not notable. Among
adults ages 65 and older, smoking decreased 20% • Multiracial adults (15.0%), 1.9 times higher than among
among college graduates (5.1% to 4.1%) and increased Hispanic adults (7.9%). The prevalence was also
20% among those with an annual household income significantly higher among American Indian/Alaska
below $25,000 (12.2% to 14.7%). Native adults (14.5%) than among white (8.5%) and
Hispanic adults.
22 SENIOR REPORT 2022 AmericasHealthRankings.orgFINDINGS | SOCIAL SUPPORT AND ENGAGEMENT
SOCIAL SUPPORT AND ENGAGEMENT
After nearly a decade of improvement, the percentage of low-care nursing
home residents spiked between 2019 and 2020. Meanwhile, most social
isolation risk factors improved between 2011-2015 and 2016-2020.
Low-care Nursing Home Residents
Low-care nursing home residents — those who require
no physical assistance in bed mobility, transferring,
toileting or eating — may be able to live in a less- The percentage
restrictive environment and receive less-intensive care of low-care
through home- or community-based services or in nursing home
alternative settings, such as assisted living facilities.29 residents
Aging in place has been shown to have physical, social increased 54%
and emotional benefits for older adults, resulting in between 2019
better health outcomes.30,31 and 2020.
Between 2019 and 2020
Nationally, the percentage of nursing home residents
who are considered low-care increased 54% from 9.9%
to 15.2%, reaching its highest point in Senior Report
history. Prior to the recent increase, the percentage of
low-care nursing home residents decreased 19% from
12.2% to 9.9% between 2010 and 2019. The percentage Source: Brown University, Shaping Long-Term Care in
of low-care nursing home residents increased in 49* America Project, 2019, 2020.
states — 44 increased 25% or more — led by: 181% in
Utah (3.6% to 10.1%), 134% in Ohio (6.8% to 15.9%) and
133% in North Carolina (4.6% to 10.7%).
Disparities in 2020 Low-care nursing home residents
was higher in Missouri than in
The percentage of low-care nursing home residents
Hawaii in 2020.
was lowest in Hawaii (3.7%), Maine (4.4%) and South
Carolina (7.9%); it was highest in Missouri (31.3%), Percentage of residents
Oklahoma (28.3%) and Kansas (26.0%).
31.3% 8.5x
Missouri
*No data available for Alaska
3.7%
Hawaii
Source: Brown University, Shaping Long-Term Care in America Project, 2020.
SENIOR REPORT 2022 AmericasHealthRankings.org 23FINDINGS | SOCIAL SUPPORT AND ENGAGEMENT
States throughout the West, Northeast and Midwest had the
lowest risk of social isolation among older adults, while states in
the South had the highest risk in 2016-2020.
Index from 1-100
≤37
38 to 45
46 to 55
DC
DC
56 to 67
≥68
DE
Data unavailable
RI
Source: U.S. Census Bureau,
American Community
Survey, 2016-2020.
Risk of Social Isolation
Socially isolated older adults may not receive needed Between 2011-2015 and 2016-2020
social support when experiencing stressful life
events.32 Strong social networks have been shown Nationally, most risk factors have improved (i.e.,
to improve the management of chronic illness and decreased), save for having never married, which
physical and cognitive health among older adults.33,34,35 increased 18% from 5.0% to 5.9%. Changes in living
alone were not notable. Significant improvements in
During 2016-2020 risk factors for social isolation among adults ages 65
and older include:
Risk of social isolation — an index of social isolation
risk factors: poverty; living alone; divorced, • Independent living difficulty decreased 10% from
separated or widowed; never married; disability; and 15.5% to 14.0%.
independent living difficulty — among adults ages
65 and older was highest in Mississippi (100) and • Disability decreased 6% from 36.0% to 34.0%.
lowest in Utah (1). For this analysis, risk factors were
• Being divorced, separated or widowed decreased
normalized on a scale of 1 to 100, with a higher value
4% from 40.2% to 38.6%.
indicating greater risk. County-level risk of social
isolation maps are available for download on the • Poverty decreased 1% from 9.4% to 9.3%.
website.
Risk of social isolation worsened (i.e., increased) by
Nationally, the most common risk factors for social five or more units on the 1 to 100 scale in 18 states,
isolation among older adults were being divorced, led by Alaska (33 to 47), New Mexico (77 to 89) and
separated or widowed (38.6%) and living alone (37.4%). Oklahoma (61 to 73). Three states improved (i.e.,
The least common risk factor was having never decreased) by five or more units: South Dakota (46
married (5.9%). to 39), Delaware (26 to 20) and Idaho (26 to 21).
24 SENIOR REPORT 2022 AmericasHealthRankings.orgYou can also read