Slow deformation event between large intraslab earthquakes at the Tonga Trench
←
→
Page content transcription
If your browser does not render page correctly, please read the page content below
www.nature.com/scientificreports
OPEN Slow deformation event
between large intraslab
earthquakes at the Tonga Trench
Yuta Mitsui1*, Hinako Muramatsu1 & Yusaku Tanaka2
Slow deformations associated with a subducting slab can affect quasi-static displacements and
seismicity over a wide range of depths. Here, we analyse the seismotectonic activities in the Tonga
subduction zone, which is the world’s most active area with regard to deep earthquakes. In our
study, we combine data from global navigation satellite systems with an earthquake catalogue. We
focus on the deep earthquakes that are below 400 km at the lower part of the Wadati–Benioff zone.
We find that trenchward transient displacements and quiescence of deep earthquakes, in terms of
background seismicity, were bounded in time by large intraslab earthquakes in 2009 and 2013. This
“slow deformation event” between 2009 and 2013 may have been triggered by a distant and shallow
M8.1 earthquake, which implies a slow slip event at the plate interface or a temporal acceleration of
the subduction of the Pacific Plate. These findings provide new insights into the relationship between
shallow and deep earthquakes in the subduction zone.
Several seismicity studies of subduction zones have recently suggested relationships between deep and shallow
earthquakes as results of possible slow deformations1,2 or fluid ascent3. In particular, slow deformations associ-
ated with a subducting slab can affect quasi-static displacements and seismicity through changes in the stress
state, like the variety of slow earthquakes that have been found at the Circum-Pacific subduction zones4, over a
wide range of depths.
The Tonga subduction zone, that is the most active area of deep earthquakes in the world5, belongs to the
Circum-Pacific subduction zones. It is well known for frequent occurrences of earthquakes much larger than M7
(magnitude 7). Figure 1 is obtained from the global Centroid Moment Tensor (CMT) solutions6 and shows the
seismicity map around the Tonga subduction zone. Among all the earthquakes, two deep intraslab earthquakes
with dynamic triggering (M7.6 and M7.7) occurred on 19 August 20027. Other shallow intraslab earthquakes
occurred near the Tonga Trench on 3 May 2006 (M8.0) and 19 March 2009 (M7.6)8. A normal fault earthquake
(M8.1) in the outer trench-slope occurred at the northern end of the Tonga subduction zone, possibly with two
interplate thrust subevents, on 29 September 20099–11. Figure 1 also shows that the seismicity at the lower part
of the Wadati–Benioff zone, below 400 km (represented by blue colours), is extremely high. We will focus on
these deeper earthquakes. This region is one of the best fields for investigating the relationship between deep
earthquakes, shallow earthquakes, and slow deformations.
Monitoring the surface displacements using a Global Navigation Satellite System (GNSS) at the Tonga subduc-
tion zone revealed a rapid plate convergence (approximately 240 mm/year) and back-arc extension12. Although
this region has few observation stations providing continuous GNSS monitoring, we can analyse temporal fluc-
tuations of the surface displacements. Here, using GNSS time series and earthquake catalogue data, we analyse
the seismotectonic activities in the Tonga subduction zone.
Data
GNSS time series data in the ITRF2014/IGS14 Reference F rame13 provided by the Nevada Geodetic Laboratory14
allow us to analyse transient surface displacements at the Tonga subduction zones after 2002. The locations of
the observation stations around the Tonga Trench are shown in Fig. 1.
We use Advanced National Seismic System (ANSS) Comprehensive Earthquake Catalog (ComCat) d ata15
for the timespan of 2002–2017 and the spatial range of 12–25 degrees south latitude and 178–192 degrees east
longitude (Fig. 1). We exclude earthquakes of M < 4.5 based on a histogram of earthquake magnitudes (Sup-
plementary Fig. S1). The magnitude value of 4.5 is a standard threshold for earthquake statistics studies using
the ANSS ComCat.
1
Department of Geosciences, Shizuoka University, Shizuoka 422‑8529, Japan. 2Earthquake Research Institute,
University of Tokyo, Tokyo 113‑0032, Japan. *email: mit@shizuoka.ac.jp
Scientific Reports | (2021) 11:257 | https://doi.org/10.1038/s41598-020-80728-w 1
Vol.:(0123456789)
www.nature.com/scientificreports/
Figure 1. Seismicity map around the Tonga subduction zone, where the Pacific Plate subducts from the
Tonga Trench. The coloured points show earthquakes during 2002–2017, the magnitudes of which are ≥ 4.5 as
per the Advanced National Seismic System (ANSS) Comprehensive Earthquake Catalog (ComCat). Colour
indicates focal depth. The beach-ball symbols and the red labels indicate the global Centroid Moment Tensor
(CMT) solutions for large earthquakes, with magnitudes ≥ 7.4. The brown squares and labels indicate the Global
Navigation Satellite System (GNSS) stations and their names. Figure generated with Generic Mapping Tools 5.x
(https://www.generic-mapping-tools.org/).
Figure 2 shows the results for an example of the GNSS time series (East–West component at TONG station)
and the depth time evolution of the earthquakes. The time series reveals stable data acquisition. The depth time
evolution of the earthquakes suggests that older data, those before ca. 2004, fixed the focal depths (e.g., 450 km)
of several deep earthquakes.
Methods
GNSS data analysis. To extract signals of transient surface displacements in the GNSS time series, we first
remove the offsets reflecting equipment changes for the GNSS stations by estimating the differences in median
values on five days before and after the offset times. If the terms for the offset estimation are separated by more
than two weeks, we do not perform the offset correction.
Then, we detrend the time series focusing on the transient displacements after the M8-class large shallow
earthquakes (on 3 May 2006 and 29 September 2009). Namely, the detrended time series data are obtained by
removing linear trends in the one-year period preceding the 2006 earthquake. Supplementary Fig. S2 shows the
detrended GNSS time series at all the stations.
Earthquake catalogue analysis. To exclude the effects of aftershock clustering from the earthquake cata-
logue data, we use the Epidemic-Type Aftershock Sequence (ETAS) model to extract the background seismicity
rate µ16. The ETAS model separates the seismicity rate into the background seismicity rate µ and clusters of
aftershocks. The seismicity rate (t) at time t is given by
Keα(Mi −Mc )
(t) = µ + (1)
t ≤t
(t − ti + c)p
i
where Mi and ti are the magnitude and time, respectively, of the i -th earthquake, Mc is the minimum magnitude
(= 4.5), and the other parameters ( K , α, c , and p) are constants. The five parameters in logarithmic form (log
µ, log K , log α, log c , and log p) are estimated by a limited-memory modification of the quasi-Newton method
with box constraints17.
We perform the ETAS analysis on yearly data. For the parameter estimation, the initial values are assumed to
be (µ, K , α, c , p) = (0.1, 1, 1, 1, 1) and their optimal values are assumed to be in the ranges of 0.001–10, 0.01–100,
0.01–100, 0.01–100, and 0.01–100, respectively.
Scientific Reports | (2021) 11:257 | https://doi.org/10.1038/s41598-020-80728-w 2
Vol:.(1234567890)
www.nature.com/scientificreports/
Figure 2. (Top) Example of the GNSS time series data (East–West component at TONG station). (Bottom)
Depth-time evolution of the seismicity. The red vertical broken lines and the red circles indicate the occurrences
and the focal depths of the respective large earthquakes in Fig. 1. The vertical blue lines indicate the time of the
equipment changes for the GNSS station. Figures generated with R 3.x (https://www.r-project.org/).
Results
Surface displacements. On the basis of the detrended GNSS time series (Supplementary Fig. S2), we con-
firmed that the two GNSS stations on the upper plate (TONG and VAVS) detected the large deformations related
to the 2006 M8.0 earthquake, and the four stations on the lower Pacific Plate (NIUM, FALE, SAMO, and ASPA)
detected the large deformations related to the 2009 M8.1 earthquake, as shown by a previous s tudy10.
Here, we focus on the behaviour of the southernmost TONG station on the upper plate, of which transient
displacements were not investigated in the previous study10. Figure 3 shows the detrended time series at the
TONG station, where we removed the coseismic offsets of the large earthquakes using a similar method to that
for the equipment changes. We define four periods: P1, P2, P3, and P4. P1 (before the 2006 earthquake) is the
reference period for the detrending process. This figure shows that the displacement rate during P4 (after the
2013 earthquake) is similar to that during P1. This suggests that the transient surface displacements following
the M8-class shallow earthquakes (on 3 May 2006 and 29 September 2009) occurred mostly during P2 and P3.
For P2 in Fig. 3, the transient displacements can be well fitted by a logarithmic function as
d(t) = 0.012ln(t/0.024), where d(t) means the displacements in the past year t from the beginning of P2 (the
2006 M8.0 earthquake). Such logarithmic behaviour is typical for postseismic deformation of large e arthquakes18
and may reflect postseismic relaxation following bi-viscous Burgers rheology19. Besides, we confirmed that the
relative amount of the transient displacements during P2 (~ 5.9 cm) to that of the coseismic offset of the 2006
M8.0 earthquake (~ 5.8 cm) as shown in Supplementary Fig. S2, was about 1. This value is not surprising, given
the transient displacements during P2 was normal postseismic deformation of the 2006 M8.0 earthquake, com-
pared with previous studies for postseismic d eformation20–22.
In contrast, for P3, the transient displacements linearly increased from the beginning of P3 (the 2009 M8.1
earthquake) and suddenly ceased around the 2013 M7.4 earthquake (Fig. 3), which is the boundary between P3
and P4. The amount of transient displacements during P3 (~ 4.8 cm) was extremely larger than that of the coseis-
mic offset of the 2009 M8.1 earthquake (~ 0 cm) as shown in Supplementary Fig. S2 These findings reveal that the
transient displacements during P3 were not simple postseismic deformation of the 2009 M8.1 earthquake. For
the other station on the upper plate, VAVS, we also find that the transient displacements during P3 differed from
the rapid logarithmic decay of the postseismic deformation during P2 (Supplementary Fig. S3). The transient
displacements on the upper plate during P3 were not ordinary postseismic deformation.
Furthermore, Fig. 4 shows the displacement vectors associated with the 2009 M8.1 earthquake around the
upper plate stations (and the southern part of the Tonga subduction zone). The transient displacements during
Scientific Reports | (2021) 11:257 | https://doi.org/10.1038/s41598-020-80728-w 3
Vol.:(0123456789)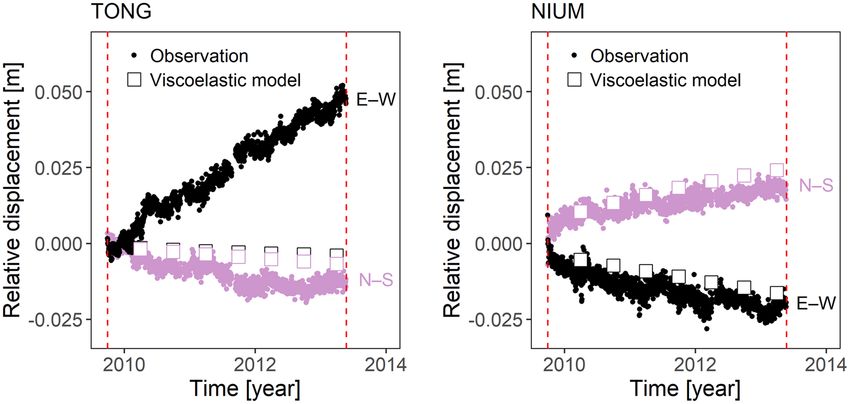
www.nature.com/scientificreports/
Figure 3. Detrended GNSS time series of the East–West component at TONG station, where we removed the
coseismic offsets of the large earthquakes (vertical red broken lines) in Fig. 1. We define four periods, P1, P2,
P3, and P4, bounded by the time of the large earthquakes. During P2, the logarithmic decay of the eastward
displacements fitted by the green chain line (the relaxation time is about 0.024 years, equal to 8.8 days) was
observed. During P3, the eastward displacements linearly increased. Figure generated with R 3.x (https://www.r-
project.org/).
Figure 4. Displacement vectors associated with the M8.1 earthquake on 29 September 2009. The coseismic
(black arrows) and transient displacements during period P3 (blue arrows) are mapped. Figure generated with
Generic Mapping Tools 5.x (https://www.generic-mapping-tools.org/).
P3 at the TONG station were almost trenchward, and were larger than the displacements at the other stations
(VAVS and NIUM) even though the TONG station was the most distant observation point (~ 750 km) from the
source of the 2009 M8.1 earthquake.
Earthquake activity. Figure 5 shows the result of the ETAS analysis. The background seismicity rate µ of
the deeper earthquakes, the focal depths of which were deeper than 400 km (d400km), decreased by a few tens
of a percent from the end of P2 (probably for the 2009 M7.6 earthquake, not the 2009 M8.1 earthquake) to the
end of P3. By contrast, the background seismicity rate µ of shallower earthquakes with a focal depth less than
400 km (s400km) showed slight increases from the end of P2.
In order to extract the characteristics of the deeper and shallower earthquake activities, we took the ratio
of the background seismicity rate µ of the deeper earthquakes (d400km) to that of the shallower earthquakes
(s400km). This ratio (Fig. 5) revealed that the quiescence period of the deeper earthquakes finished at approxi-
mately the same time around the 2013 M7.4 earthquake. The transient displacements (Fig. 3) ceased as well.
Scientific Reports | (2021) 11:257 | https://doi.org/10.1038/s41598-020-80728-w 4
Vol:.(1234567890)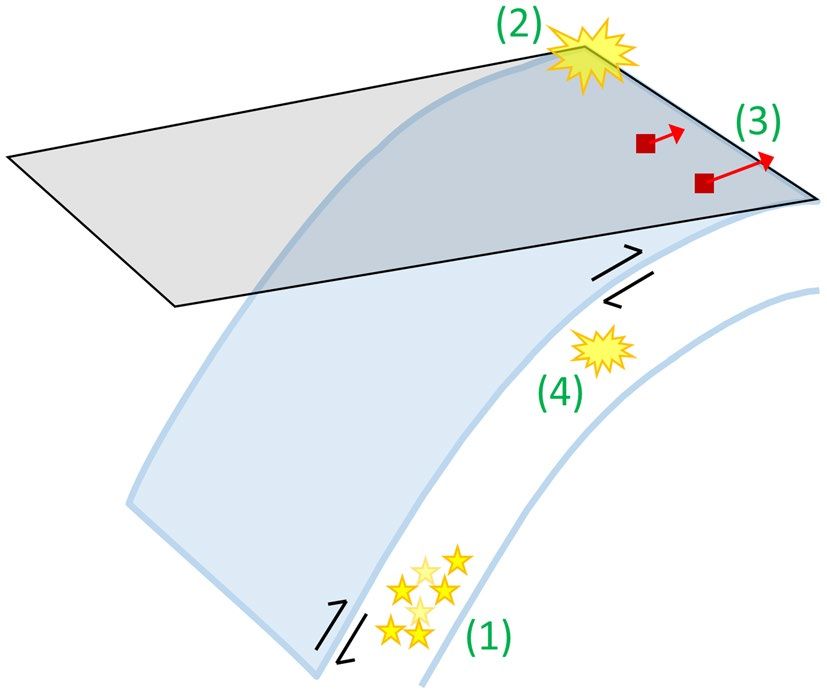
www.nature.com/scientificreports/
Figure 5. (Top) Temporal evolution of the background seismicity rate µ for earthquakes, with focal depths
shallower than 400 km (s400km) and deeper than 400 km (d400km), as obtained from Epidemic-Type
Aftershock Sequence (ETAS) analysis. The vertical error bars represent 95% confidence intervals. As in the
lower panel of Fig. 2, the red vertical broken lines indicate the time of the large earthquakes. The four periods,
P1, P2, P3, and P4, are shown by the orange arrows for reference. (Bottom) Temporal evolution of the ratio of
the background seismicity rate µ for the deeper earthquakes (d400km) to that for the shallower earthquakes
(s400km). Figures generated with R 3.x (https://www.r-project.org/).
Discussion
The trenchward transient displacements at the upper plate, which are measured by the TONG and VAVS stations
(Fig. 4), were not investigated in the previous study10. The mentioned study modelled the viscoelastic relaxation
of the 2009 M8.1 earthquake to explain the postseismic deformation. It was based on the GNSS and Gravity
Recovery And Climate Experiment (GRACE) data. In another region of the central Kuril Islands with near-trench
major earthquakes23, no additional trenchward movement similar to that estimated in this study was reported24.
Here, in order to compare the sophisticated model results of viscoelastic relaxation of the 2009 M8.1 earth-
quake with our results, we perform the same simulation as the previous study10 using the same numerical code
VISCO1D25. Here is a brief overview of that simulation: The code calculates viscoelastic relaxation of the asthe-
nosphere following the earthquake on a layered spherical Earth. The 2009 M8.1 earthquake was modelled as a
combination of normal and thrust faultings (Supplementary Table S1). The thickness of elastic lithosphere is
62 km, and the viscoelastic asthenosphere extends from a depth of 62–220 km. We assume a bi-viscous Burgers
body for the asthenosphere with the Maxwellian viscosity of 2 × 10¹⁸ Pa s and the Kelvin viscosity of 1 × 10¹⁷ Pa s.
Moreover, the Maxwellian viscosity for the upper (220–670 km) and lower (670–2900 km) mantle are set to be
1 × 10²⁰ Pa s and 1 × 10²¹ Pa s. The other parameters are described in Supplementary Table S2.
Figure 6 shows a comparison between the GNSS observations and the viscoelastic simulation during P3 at
the southern part of the Tonga subduction zone. This comparison confirms that the transient displacements
at the TONG station (previously shown in Figs. 3, 4) cannot be explained by the viscoelastic relaxation. This
finding supports our prior conclusion that the transient displacements at the TONG station during P3 (Figs. 3,
4) were not ordinary postseismic deformation of the 2009 M8.1 earthquake. By contrast, Fig. 6 also shows that
Scientific Reports | (2021) 11:257 | https://doi.org/10.1038/s41598-020-80728-w 5
Vol.:(0123456789)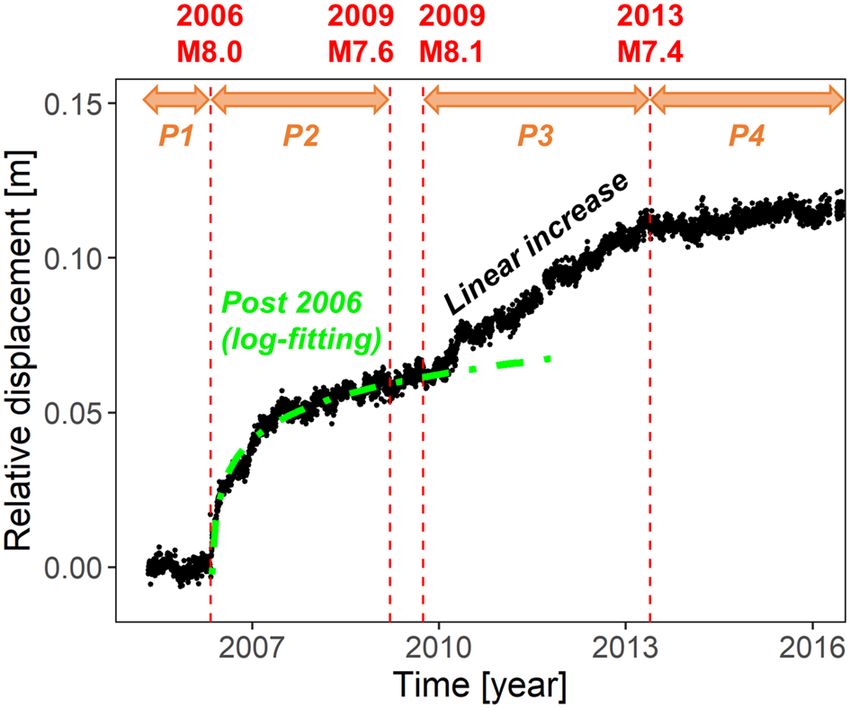
www.nature.com/scientificreports/
Figure 6. Comparison between the GNSS observation and the simulation results of the viscoelastic model
in the previous study10 during period P3, at the TONG station (left) and the NIUM station (right). Figures
generated with R 3.x (https://www.r-project.org/).
Figure 7. Illustration of a series of events at the southern part of the Tonga subduction zone after 2009. (1)
Beginning of the quiescence of the deeper earthquakes. (2) The 2009 M8.1 shallow earthquake in the far north.
(3) Beginning of the trenchward displacements at the upper plate TONG and VAVS stations (red arrows). (4)
The 2013 M7.4 intraslab earthquake, and the end of the above “slow deformation event”.
the displacements at the lower plate NIUM station after the 2009 M8.1 earthquake well followed the viscoelastic
simulation as investigated in the previous s tudy10.
To sum up, what happened in the Tonga subduction zone? During P2, after the 2006 M8.0 earthquake, we
observed the typical logarithmic decay of postseismic deformation at the GNSS stations (e.g., Fig. 3) and the
nearly constant (equal to those in the previous P1) background seismicity rates (Fig. 5). On the contrary, the
quiescence of the deeper earthquakes started around 2009 (Fig. 5), and the trenchward transient displacements
at the upper plate GNSS stations in the southern part of the Tonga subduction zone (e.g., the linear increase in
Fig. 3) occurred after the 2009 M8.1 shallow earthquake in the far north as P3. During P3, before the 2013 M7.4
earthquake, the background seismicity rates slowly returned to the same state as before 2009. The trenchward
transient displacements also ceased around the 2013 M7.4 earthquake. Figure 7 illustrates the above event series
after 2009. Further, we refer to both the deep earthquake quiescence and the trenchward transient displacements
together as a “slow deformation event”.
During the slow deformation event, the trenchward displacements, whuch cannot be explained by the viscoe-
lastic relaxation mechanism, were triggered by stress changes due to the 2009 M8.1 intraslab earthquake in the
far north through the following possible processes: (i) A slow slip event at the plate interface was triggered as in
the case of the 2016 M7.8 Kaikoura earthquake in New Zealand26 or (ii) temporal acceleration of the subduction
of the Pacific Plate to recover the force balance of plate tectonics was triggered and induced the changes in the
Scientific Reports | (2021) 11:257 | https://doi.org/10.1038/s41598-020-80728-w 6
Vol:.(1234567890)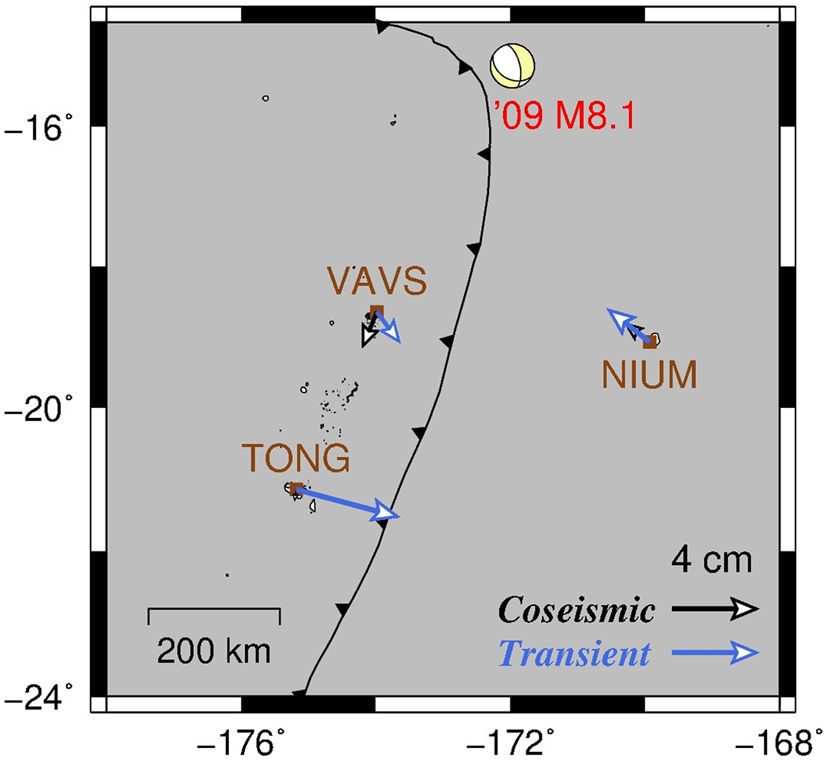
www.nature.com/scientificreports/
displacement field, as in the case of the 2003 M8.0 Tokachi-oki earthquake in Japan27. Unfortunately, it is difficult
to distinguish between the two possible processes from the present data set. We expect that the GRACE and its
follow-on data will contribute to solving this problem.
The mechanisms for the slow deformation event that finished around the time of the 2013 M7.4 intraslab
earthquake are not yet understood. One speculation is that the slab deformations due to the 2013 M7.4 earth-
quake regained the force balance before the event series. Besides, the possible effects of sudden fluid e xchange28 or
densification of metastable slab29 might cause the large-scale phenomena. In any case, the findings of the present
study provide new insights into the relationship between shallow and deep earthquakes in the subduction zone.
Conclusion
At the Tonga subduction zone, we identified a slow deformation event of the trenchward transient displacements
and the quiescence of the deeper earthquakes. The time-related accordance of both phenomena and the large
intraslab earthquakes implied an interconnected system between earthquakes from shallow to deep parts of the
subduction zone.
Received: 14 May 2020; Accepted: 23 December 2020
References
1. Bouchon, M. et al. Potential slab deformation and plunge prior to the Tohoku, Iquique and Maule earthquakes. Nat. Geosci. 9(5),
380–383 (2016).
2. Delbridge, B. G. et al. Temporal variation of intermediate-depth earthquakes around the time of the M9.0 Tohoku-oki earthquake.
Geophys. Res. Lett. 44, 3580–3590 (2017).
3. White, L. T. et al. Earth’s deepest earthquake swarms track fluid ascent beneath nascent arc volcanoes. Earth Planet. Sci. Lett. 521,
25–36 (2019).
4. Obara, K. & Kato, A. Connecting slow earthquakes to huge earthquakes. Science 353(6296), 253–257 (2016).
5. Frohlich, C. Deep Earthquakes (Cambridge University Press, Cambridge, 2006).
6. Ekström, G., Nettles, M. & Dziewoński, A. M. The global CMT project 2004–2010: Centroid–moment tensors for 13,017 earth-
quakes. Phys. Earth Planet. Int. 200–201, 1–9 (2012).
7. Tibi, R., Wiens, D. A. & Inoue, H. Remote triggering of deep earthquakes in the 2002 Tonga sequences. Nature 424, 921–925
(2003).
8. Meng, Q. et al. The 3 May 2006 (Mw 8.0) and 19 March 2009 (Mw 7.6) Tonga earthquakes: Intraslab compressional faulting below
the megathrust. J. Geophys. Res. 120(9), 6297–6316 (2015).
9. Beavan, J. et al. Near-simultaneous great earthquakes at Tongan megathrust and outer rise in September 2009. Nature 466, 959–963
(2010).
10. Han, S., Sauber, J., Pollitz, F. & Ray, R. Sea level rise in the Samoan Islands escalated by viscoelastic relaxation after the 2009
Samoa–Tonga earthquake. J. Geophys. Res. 124, 4142–4156 (2019).
11. Lay, T. et al. The 2009 Samoa–Tonga great earthquake triggered doublet. Nature 466, 964–968 (2010).
12. Bevis, M. et al. Geodetic observations of very rapid convergence and back-arc extension at the Tonga arc. Nature 374, 249–251
(1995).
13. Altamimi, Z., Rebischung, P., Métivier, L. & Collilieux, X. ITRF2014: A new release of the International Terrestrial Reference Frame
modeling nonlinear station motions. J. Geophys. Res. 121, 6109–6131 (2016).
14. Blewitt, G., Hammond, W. C. & Kreemer, C. Harnessing the GPS data explosion for interdisciplinary science. EOS. https://doi.
org/10.1029/2018EO104623 (2018).
15. USGS. Advanced National Seismic System (ANSS) Comprehensive Catalog of Earthquake Events and Products. https://doi.
org/10.5066/F7MS3QZH (2017).
16. Ogata, Y. Statistical models for earthquake occurrences and residual analysis for point processes. J. Am. Stat. Assoc. 83, 9–27 (1988).
17. Byrd, R. H., Lu, P., Nocedal, J. & Zhu, C. A limited memory algorithm for bound constrained optimization. SIAM J. Sci. Comp. 16,
1190–1208 (1995).
18. Bevis, M. & Brown, A. Trajectory models and reference frames for crustal motion geodesy. J. Geod. 88, 283–311 (2014).
19. Hetland, E. A. & Hager, B. H. The effects of rheological layering on post-seismic deformation. Geophys. J. Int. 166, 277–292 (2006).
20. Heki, K., Miyazaki, S. & Tsuji, H. Silent fault slip following an interplate thrust earthquake at the Japan Trench. Nature 386, 595–598
(1997).
21. Bürgmann, R. et al. Rapid aseismic moment release following the 5 December 1997 Kronotsky Kamchatka earthquake. Geophys.
Res. Lett. 28, 1331–1334 (2001).
22. Pritchard, M. E. & Simons, M. An aseismic slip pulse in northern Chile and along-strike variations in seismogenic behavior. J.
Geophys. Res. 111, B08405 (2006).
23. Han, S., Sauber, J. & Pollitz, F. Postseismic gravity change after the 2006–2007 great earthquake doublet and constraints on the
asthenosphere structure in the central Kuril Islands. Geophys. Res. Lett. 43, 3169–3177 (2016).
24. Kogan, M. G. et al. The mechanism of postseismic deformation triggered by the 2006–2007 great Kuril earthquakes. Geophys. Res.
Lett. 38(6), L06304 (2011).
25. Pollitz, F. F. Gravitational-viscoelastic postseismic relaxation on a layered spherical Earth. J. Geophys. Res. 102, 17921–17941 (1997).
26. Wallace, L. M. et al. Large-scale dynamic triggering of shallow slow slip enhanced by overlying sedimentary wedge. Nat. Geosci.
10, 765–770 (2017).
27. Heki, K. & Mitsui, Y. Accelerated pacific plate subduction following interplate thrust earthquakes at the Japan trench. Earth Planet.
Sci. Lett. 363, 44–49 (2013).
28. Materna, K., Bartlow, N., Wech, A., Williams, C. & Bürgmann, R. Dynamically triggered changes of plate interface coupling in
Southern Cascadia. Geophys. Res. Lett. 46, 12890–12899 (2019).
29. Bedford, J. R. et al. Months-long thousand-kilometre-scale wobbling before great subduction earthquakes. Nature 580, 628–635
(2020).
30. Wessel, P., Smith, W. H. F., Scharroo, R., Luis, J. & Wobbe, F. Generic mapping tools: improved version released. EOS Trans AGU.
94, 409–410 (2013).
Scientific Reports | (2021) 11:257 | https://doi.org/10.1038/s41598-020-80728-w 7
Vol.:(0123456789)www.nature.com/scientificreports/
Acknowledgements
We thank the United States Geological Survey and Nevada Geodetic Laboratory for providing the data, and
Shin-Chan Han for providing the fault model. We are grateful to Geoscience Australia, GNS Science, NOAA,
Pacific GPS Facility, Samoa Lands and Survey, and Tonga MLSNR for installing the GNSS stations. Insightful
comments from two reviewers improved this manuscript. The figures were made using Generic Mapping Tools30.
We would like to acknowledge financial support from the Japan Society for the Promotion of Science (JSPS)
KAKENHI (Grant Nos. JP16H06477 and JP19K04036).
Author contributions
Y.M. conceived and conducted the analysis, H.M. conducted the analysis, and Y.T. discussed the results. All
authors reviewed the manuscript.
Competing interests
The authors declare no competing interests.
Additional information
Supplementary Information The online version contains supplementary material availlable at https://doi.
org/10.1038/s41598-020-80728-w.
Correspondence and requests for materials should be addressed to Y.M.
Reprints and permissions information is available at www.nature.com/reprints.
Publisher’s note Springer Nature remains neutral with regard to jurisdictional claims in published maps and
institutional affiliations.
Open Access This article is licensed under a Creative Commons Attribution 4.0 International
License, which permits use, sharing, adaptation, distribution and reproduction in any medium or
format, as long as you give appropriate credit to the original author(s) and the source, provide a link to the
Creative Commons licence, and indicate if changes were made. The images or other third party material in this
article are included in the article’s Creative Commons licence, unless indicated otherwise in a credit line to the
material. If material is not included in the article’s Creative Commons licence and your intended use is not
permitted by statutory regulation or exceeds the permitted use, you will need to obtain permission directly from
the copyright holder. To view a copy of this licence, visit http://creativecommons.org/licenses/by/4.0/.
© The Author(s) 2021
Scientific Reports | (2021) 11:257 | https://doi.org/10.1038/s41598-020-80728-w 8
Vol:.(1234567890)You can also read