Smash repair industry - NRMA Insurance October 2011
←
→
Page content transcription
If your browser does not render page correctly, please read the page content below
Smash repair
industry

NRMA Insurance

October 2011
Deloitte Access Economics Pty Ltd
                                                                                   ACN: 149 633 116

NRMA Insurance                                                                     Level 1, 9 Sydney Ave
388 George Street                                                                  Barton ACT 2600
                                                                                   PO Box 6334
Sydney NSW 2000                                                                    Kingston ACT 2604

                                                                                   Tel: +61 2 6175 2000
                                                                                   Fax: +61 2 6175 2001
24 October 2011                                                                    www.deloitte.com.au

To NRMA Insurance

                                 RE: REVIEW OF THE SMASH REPAIR INDUSTRY

NRMA Insurance has sought advice on the future of the smash repair industry. Automobile
insurers need to consider the evolution of the smash repair industry in their strategic planning
and in managing their relationships with repairers. NRMA Insurance commissioned Deloitte
Access Economics to provide this advice, and we are pleased to do so.

Please find attached Deloitte Access Economics’ final report.

Yours sincerely,

Ric Simes
Director
Deloitte Access Economics Pty Ltd

Liability limited by a scheme approved under Professional Standards Legislation.

© 2011 Deloitte Access Economics Pty Ltd
Smash repair industry
Contents
Glossary ..................................................................................................................................... i
Executive Summary.................................................................................................................... i
1 Background ..................................................................................................................... 4
1.2 Aim of the report .............................................................................................................. 4
1.3 Scope of the report ........................................................................................................... 5
1.4 Contents ........................................................................................................................... 5
2 The smash repair industry ............................................................................................... 6
2.1 State of the industry today ................................................................................................ 6
2.2 Key drivers ...................................................................................................................... 12
2.3 Comparison with experience elsewhere .......................................................................... 17
3 Relationships ................................................................................................................ 22
3.2 Overview of relationships................................................................................................ 23
3.3 Impact on consolidation etc ............................................................................................ 26
4 Future of the industry ................................................................................................... 27
4.1 Current trends ................................................................................................................ 27
4.2 Key strategic propositions ............................................................................................... 29
5 Recommendations ........................................................................................................ 31
References .............................................................................................................................. 32
Limitation of our work ............................................................................................................... 33
Tables
Table 2.1 : Revenue and wages ............................................................................................... 11
Figures
Figure 1.1 : Consolidation in establishments ............................................................................. 4
Figure 2.1 : Smash repair industry ............................................................................................. 7
Figure 2.2 : Employment in the smash repair industry ............................................................... 8
Figure 2.3 : Distribution of smash repair establishment locations .............................................. 8
Figure 2.4 : Establishments and population, share of total ........................................................ 9
Figure 2.5 : Industry value added ............................................................................................ 10
Liability limited by a scheme approved under Professional Standards Legislation.
Deloitte refers to one or more of Deloitte Touche Tohmatsu Limited, a UK private company limited by guarantee, and its network
of member firms, each of which is a legally separate and independent entity.
Please see www.deloitte.com/au/about for a detailed description of the legal structure of Deloitte Touche Tohmatsu Limited and
its member firms.
© 2011 Deloitte Access Economics Pty LtdSmash repair industry Figure 2.6 : Significance of issues ............................................................................................ 12 Figure 2.7 : SMART shops ........................................................................................................ 14 Figure 2.8 : Evolution of the smash repair sector ..................................................................... 15 Figure 3.1 : Smash repair relationships .................................................................................... 23 Deloitte Access Economics
Smash repair industry

Glossary
AAMI                              Australian Associated Motor Insurers
ABS                               Australian Bureau of Statistics
ANZSIC                            Australian and New Zealand Standard Industrial Classification
ACCC                              Australian Competition and Consumer Commission (ACCC)
DEEWR                             Department of Education, Employment and Workplace Relations
DIISR                             Department of Innovations, Industry, Science and Research
EU                                European Union
FCAI                              Federal Chamber of Automotive Industries
FTFM                              funny time, funny money
GFC                               Global financial crisis
ICDPA                             International Car Distribution Programme Australia
ISA                               Insurance Statistics Australia
ITAB                              Industry Training Advisory Body
MTAA                              Motor Trades Association of Australia
NRMA                              National Roads & Motorists' Association
NTAR                              new times and rates
OEM                               original equipment manufacturer
PC                                Productivity Commission
PSR                               preferred smash repairer
SMART                             small to medium area repair techniques
UK                                United Kingdom
WA                                Western Australia

Liability limited by a scheme approved under Professional Standards Legislation.

Deloitte refers to one or more of Deloitte Touche Tohmatsu Limited, a UK private company limited by guarantee, and its
network of member firms, each of which is a legally separate and independent entity.
Please see www.deloitte.com/au/about for a detailed description of the legal structure of Deloitte Touche Tohmatsu Limited
and its member firms.

© 2011 Deloitte Access Economics Pty Ltd
Smash repair industry
Executive Summary
Consolidation is underway in the Australian smash repair industry, especially minor repairs
in urban centres. A few entrepreneurs in the industry who have invested in technology and
scale and AAMI’s model of the insurer choosing repairers are driving this trend. Other
repairers and insurers are following down similar paths.
The nature of this consolidation is a move away from a market dominated by ‘cottage
industry’ repair shops towards larger ‘factory’ operations which specialise in the fast
processing of a high volume of low value repairs. The economies of scale which have been
demonstrated from the latter have put pressure on the viability and competitiveness of
smaller repairers.
In the last decade, the smash repair industry has reduced in size, employment and revenue,
as shown in Table i. As a share of the economy, it has fallen from 0.19% to 0.15% during
this period. Furthermore, the outlook for the industry is for further consolidation, in
response to a range of forces.
Table i: Smash repair industry consolidation
2001-02 2010-11 Decline
Establishments 10,575 9,100 -16%
Enterprises 5,891 4,652 -27%
Employment 32,270 31,550 -2%
Revenue ($m) 6,332 5,241 -21%
Source: IBISWorld, 2010
While there are a large range of factors which influence the production level and/or the
range of services that the industry is capable of providing, the key drivers of consolidation
in the smash repair industry have been identified as:
automobile technology and safety;
financial and economic considerations;
changing repair types and techniques, particularly within the differentiated markets
within the industry; and
regulatory pressures.
The first two drivers affect the demand for smash repair services. Improved technology and
road safety initiatives have reduced the number of motor vehicle accidents, and hence the
need for smash repair services. Financial and economic considerations play a part in the
consumer’s decision whether or not to repair a vehicle, with more people opting to repair a
vehicle in weak economic times rather than purchase a new vehicle. As Australia’s
economy has been relatively strong emerging from the global financial crisis, there has
been a trend towards the purchase of new vehicles, which often contain more safety
features than older models, therefore reducing the demand for smash repairs.
Deloitte Access Economics iSmash repair industry
On the other hand, the supply of smash repair services is influenced by the latter three key
drivers. Financial constraints affect the relative profitability of smash repairers and
determine their viability in the market. It is likely that specialisation in different market
segments will continue in response to these constraints, as well as the constant evolution
of car technology and repair techniques. Further, regulations imposed on the industry,
such as planning constraints and waste disposal, have impacts on the profitability of
repairers as well as methods of repair.
Overseas experience suggests that Australia is still in the early stages of consolidation,
based on the number of repairers per capita. For example, in 2007 there were 6.6 smash
repairers per 100,000 people in the UK compared to 24.8 repairers in Australia. Moreover,
the UK market experienced a 12% decline in smash repairers between 2006 and 2009,
while the number of Australian fell only 2% in the same period. This indicates that
consolidation still has a long way to run in Australia.
The UK experience provides an insight into the consolidation process likely to occur in
Australia. Along with many of the key drivers confronting the Australian market today, the
UK also faced stronger pressure for change from regulatory and financial pressures. While
this would imply that consolidation is likely to be less rapid in Australia, insurer knowledge
of the UK experience may accelerate the outcome.
The future of the industry will be further consolidation, as current trends are expected to
continue. This impact is likely to differ across the different market segments. For instance,
there is likely to be a greater degree of consolidation in metropolitan smash repairers, as
these regions have the volume of repairs required to make a factory shop model viable.
Regional smash repairers may suffer from the current skills shortage, particularly as there is
also a trend of cars being transported to metropolitan centres for major repairs.
Premium car repairers and those specialising in major repairs are expected to face the
lowest degree of consolidation due to their niche markets. High value cars are the most
likely to be repaired rather than written off after a major collision, and these will require
skilled repairers. With the current and expected future skills shortage in the industry, it is
likely that these qualified tradespeople will specialise in the higher value end of the market.
The key strategic propositions derived from Deloitte Access Economics’ study of the smash
repair industry are:
The AAMI model (limited choice, a greater reliance on SMART shops) will continue to
spread, driving consolidation and constraining price increases for minor repairs in
metro markets. QBE, Allianz and other insurers are offering products that reinforce
this.
Prestige car makers will continue to try to tie their customers to their accredited repair
shops. Their challenge will be to compete in an area that has not been core to their
business model – large, specialist insurers should be able to offer better prices.
Regional markets will continue to offer greater diversity of repairers.
• However, large chains may encroach in regional areas over time.
• Greater numbers of repairs could occur outside the region, especially as the
technologies and skills needed for the repair become more involved.
Deloitte Access Economics iiSmash repair industry
Insurers will be able to price for choice, offering for example basic no-choice of insurer
cover and more expensive with-choice cover.
• However, choice does not appear to be a powerful motivator for consumers,
as illustrated by the acceptance of the AAMI model and prestige
manufacturers’ efforts to tie their customers’ hands.
Technology will lead to a shrinking volume of repairs.
• Technological advances will push up the cost of skilled labour and equipment,
favouring larger repairers who benefit from scale.
• The trend towards replacement over repair will continue.
Regulations (e.g. environmental and OHS) will provide a mild incentive to build scale.
A reduced chance of having to have a repair is expected to reduce the price of insurance,
although the extent of this will depend on the average cost of repairs. To the extent that
declining volume of repairs – due to changing technology and fewer accidents – will put
pressure on the smash repairer industry to consolidate, it also has ramifications for the
price of insurance and, hence, insurers.
Deloitte Access Economics
Deloitte Access Economics iiiSmash repair industry
1 Background
The smash repair industry in Australia is undergoing consolidation, consistent with
experience overseas, such as in the United Kingdom. Consolidation in this industry refers to
the trend to fewer establishments, to more repairs per establishment and to more shops
per company. The trends in establishments in the smash repair industry are shown in
Figure 1.1.
Figure 1.1: Consolidation in establishments
11,000 2.1
10,500 2.0
10,000 1.9
9,500 1.8
9,000 1.7
8,500 1.6
8,000 1.5
2001-02 2004-05 2007-08 2010-11 2013-14
Establishments (L axis) Forecast
Establishments/enterprise (R axis) Forecast
Source: IBISWorld, 2010
The extent of the change differs across sectors of the industry and jurisdictions. In
metropolitan markets for minor repairs, the fragmented system of small independently-
owned repair shops that dominates the landscape has been slowly giving way to large chain
operators over the past decade. However, in other sectors of the industry, outside major
population centres, or for major repairs and repairs to premium marques, the outlook is
less clear.
NRMA Insurance has sought advice on the future of the smash repair industry. Automobile
insurers need to consider the evolution of the smash repair industry in their strategic
planning and in managing their relationships with repairers. NRMA Insurance has
commissioned Deloitte Access Economics to provide this advice.
1.2 Aim of the report
This report aims to provide NRMA Insurance with a scoping study for a full assessment of
the outlook for the smash repair industry.
Deloitte Access Economics 4Smash repair industry
The Productivity Commission (PC) report Smash Repair and Insurance (PC 2005) is a useful
departure point for a high-level analysis of the likely future of industry. This report seeks to
update the relevant parts of the PC report, using information provided by NRMA Insurance
and publically available sources.
Ultimately, this scoping study aims to provide informed answers to the questions in the
brief, but is also intended to identify potentially rewarding areas of study to pursue and the
appropriate methodology to use.
1.3 Scope of the report
The items addressed in this report are:
what is the current state of the smash repair industry;
• economic drivers
• regulatory landscape
the nature and consequences of the relationship between the smash repair industry
and the motor insurance industry, and the relationship between smash repairers and
car manufacturers; and
where the smash repair industry is likely to be in 5 to 10 years.
• based on existing trends (i.e. consolidation)
• what forces could speed up or hinder the process
The conclusions in the report are based on public sources of information – e.g. the PC
report, IBISWorld, state and industry body reviews and reports, and the Australian Bureau
of Statistics (ABS) – and information and guidance provided by NRMA Insurance and
industry experts.
1.4 Contents
In Chapter 2, the current state of the smash repair industry is described. The key economic
and regulatory drivers of the industry are identified. The smash repair industry’s progress
from a ‘cottage industry’ towards a ‘factory model’ is compared and contrasted with the
experience of other industries and jurisdictions that have undergone consolidation.
The relationship between smash repairers and motor vehicle insurers is an important driver
of the industry, as repairers rely on insurers for up to 80% of their work. Hence, the nature
and consequences of this relationship are examined in more detail in Chapter 3.
Chapter 4 discusses where the smash repair industry is likely to be in 5 to 10 years,
presenting a number of propositions to be tested based on the forces that could speed up
or hinder consolidation identified in the earlier chapters.
The report’s conclusions are presented in Chapter 5, including recommendations for the
way forward.
Deloitte Access Economics 5Smash repair industry
2 The smash repair industry
This chapter defines the state of play in the smash repair industry. It provides estimates of
its dimensions, a summary of the underlying trends, and provides comparison and contrast
with other jurisdictions.
2.1 State of the industry today
There are numerous forces acting to shape the future of the smash repair industry, which
are discussed in this report. These forces are expected to have different impacts on the
different sectors of the smash repair markets. These interactions will determine, in sum,
the pace of consolidation going forward and guide the strategic planning of smash
repairers, insurers and other stakeholders in the industry.
2.1.1 Definitions
The smash repair industry in Australia is mainly comprised of small privately-owned
businesses. The main services provided are post-collision repair of motor vehicles, and
hence the major factors driving the industry are those which affect the frequency and
severity of crashes. IBISWorld (2010) breaks down the primary activities of the industry as:
motor vehicle body repairing, including panel beating (57.2% of industry value);
spray painting (28.1%);
towing services (10.3%);
motor trimming (3%); and
other services, including rustproofing and salvage operations (1.4%).
The Australian and state markets can be further broken down as shown in Figure 2.1:
urban repair shops face a different set of consolidating forces compared to regional
smash repairers, due to the proximity of competition;
within these markets, there is a division between the premium car repairers and those
which service all other cars. Premium repairers tend to specialise in a particular
premium marque and face less substitutability than general repairers; and
these general repairers can also be broken down into major and minor damage sectors.
Some businesses specialise in repairing a higher volume of vehicles requiring relatively
minor repair compared to the other end of the spectrum with high-value repairs
requiring both more labour and inputs.
Deloitte Access Economics 6Smash repair industry
Figure 2.1: Smash repair industry
All smash repairers
Urban Regional
Premium All other
cars cars
Major Minor
repairs repairs
Source: Deloitte Access Economics, based on consultation with NRMA Insurance.
The businesses in the industry are known as enterprises, the divisions that are separately
managed and keep management accounts. Enterprises may be responsible for one or more
establishments which are the smallest accounting unit which, in turn, may consist of one or
more locations in a state or territory.
2.1.2 Macro indicators
IBISWorld estimated that, in FY 2010-11, there were 4,652 smash repair enterprises in
Australia, accounting for 9,100 establishments in varying locations. The number of
establishments in the industry has been declining, at a rate of 1.9% annually in the 10 years
to 2010-11. This is consistent with industry rationalisation. Possible reasons for this trend
will be explored in the following sections in the report, and include overcapacity and
decreased demand based on a declining number of accidents (IBISWorld, 2010).
Likewise, there has been a downward trend in employment in the industry, as shown in
Figure 2.2. In 2010-11, 31,550 persons were employed in the smash repair industry, and
this is forecast to decline further in the upcoming five years, partly in response to the
rationalisation of the industry and the utilisation of current overcapacity (IBISWorld 2010).
Deloitte Access Economics 7Smash repair industry
Figure 2.2: Employment in the smash repair industry
32,500
32,000
31,500
31,000
30,500
30,000
2001-02 2004-05 2007-08 2010-11 2013-14
Employment Forecast
Source: IBISWorld, 2010
As shown in Figure 2.3, the majority of smash repair establishments are located in NSW and
Victoria.
Figure 2.3: Distribution of smash repair establishment locations
1.6% 1.1% 1.1%
7.0%
NSW
10.3% Vic
32.5%
Qld
WA
SA
Tas
22.2%
ACT
NT
24.2%
Source: IBISWorld, 2010
Generally, the distribution of establishments is in line with the population in each of the
states (as shown in Figure 2.4). This reflects the nature of the industry as a locationally-
based service highly dependent on demand and hence population, as cars are rarely taken
extensive distances to be repaired (although this is changing).
Deloitte Access Economics 8Smash repair industry
In Queensland and South Australia, there are more smash repair establishments
per capita than other states. Given the oversupply in the Australian market relative
to overseas, this looks to reflect oversupply in these states in relation to the
average. Further research is required to establish why this is the case.
In Victoria and Western Australia, there are fewer smash repair establishments
relative to population, indicating that consolidation may be more advanced in these
states.
Figure 2.4: Establishments and population, share of total
35%
30%
25%
20% population
15%
smash repair
establishments
10%
5%
0%
NSW Vic Qld SA WA Tas NT ACT
Source: IBISWorld, 2010, ABS 2010.
Industry value added (the gross product of the industry, measured as the sum of wages,
depreciation and profit) has been growing over the past decade. Despite the growth in
value added over time, the industry has been growing at a slower rate than the rest of the
economy, with value added as a share of GDP on a declining trend over the past decade.
IBISWorld forecasts suggest that value added will peak in 2011-12 and then begin to
decline, although the calculations underpinning this projection are not provided. These
trends are shown below in Figure 2.5.
Deloitte Access Economics 9Smash repair industry
Figure 2.5: Industry value added
2,000 0.20%
$m
1,900 0.16%
1,800 0.12%
1,700 0.08%
1,600 0.04%
1,500 0.00%
2001-02 2004-05 2007-08 2010-11 2013-14
Industry value added ($m) Forecast
Value added as share of GDP (%) Forecast
Source: IBISWorld, 2010
2.1.3 Financial performance
Indicators of the smash repair industry’s financial performance are shown in Table 2.1. The
smash repair industry is expected to account for $5.2 billion of revenue in 2010-11. The
average revenue for an enterprise is $1.1m and expected to grow in upcoming years. This
will in part be attributable to the consolidation of the industry resulting in larger
enterprises in place of less efficient shops which will exit the industry.
For a well-managed medium-sized enterprise, profits as a proportion of revenue are
estimated to be 8-12% in 2011. Overall industry profitability (measured as return on
investment) was expected to rise from 7.8% in 2005-06 to 8.0% in 2010-11 (IBISWorld,
2010). This increase in profitability over time is attributed to improved relationships with
insurers, which has resulted in a more reliable supply of work, as well the initial stages of
industry consolidation, where repairers have benefited through economies of scale, and the
exit of unprofitable enterprises.
The number of employees per establishment is estimated to be around 3.5 employees.
Wages in the industry represent around $1.4 billion per year, which equates to an average
annual wage of approximately $43,000 in 2010-11 (IBISWorld 2010).
Deloitte Access Economics 10Smash repair industry
Table 2.1: Revenue and wages
Year Revenue ($m) Revenue per Wages ($m) Employees/
enterprise ($m) establishment
2005-06 5,305 1.08 1,247 3.4
2006-07 5,356 1.09 1,266 3.4
2007-08 5,239 1.08 1,296 3.4
2008-09 5,182 1.08 1,320 3.4
2009-10 5,260 1.12 1,357 3.5
2010-11* 5,241 1.13 1,363 3.5
2011-12* 5,351 1.16 1,402 3.5
2012-13* 5,357 1.18 1,393 3.5
2013-14* 5,274 1.17 1,376 3.5
Source: IBISWorld, 2010, *forecasts
In comparison with the smash repair industry, the automotive maintenance and servicing
industry involves mechanics and repair shops that perform routine maintenance and
servicing. The long term trend appears to be a decreasing average age of the fleet,
reducing the demand for maintenance services. While this industry is also in decline, it has
performed relatively well in recent years as consumers have refrained from purchasing
newer cars due to the economic downturn, hence, requiring maintenance on older vehicles.
Revenue for this industry exceeded $13 billion in 2010-11, with 4.1 employees per
establishment and industry profitability of 8.5%, all greater than the respective metrics for
the smash repair industry. However, average growth in revenue from 2005-06 to 2010-11
is less than 1.2% annually (IBISWorld, 2011).
The level of labour intensity in the smash repair industry is high, with approximately 13
units of labour required per unit of capital (IBISWorld, 2010). This intensity is above the
economy-wide average of 4 units of labour per unit of capital. However, while repair has
been traditionally labour intensive, the capital intensity of the industry is rising. This is due
to advancements in repair technologies, related to the increasing complexity of vehicles to
repair.
In general, tendered repairs cost less than the average cost of repair, though there is an
indication that smash repairers are subsidising these costs with higher prices on jobs that
are not tendered (NRMA Insurance consultations, 2011).
Concentration in the industry is low. The only state to have large chain operations is
Victoria, with the extent of this only six to eight companies operating six to eight shops
each. In Victoria, the top 350 companies in the industry control 70% of industry revenue.
This is similar to the other states though they do not yet have any chain operations.
IBISWorld estimates that no single entity will have a market share greater than 1.0% in
FY 2010-11.
2.1.4 Summary
While the industry is undergoing consolidation, there are several sectors within the overall
smash repair market that appear less vulnerable than the less efficient operators in the
general market. It should be noted that industry consolidation is still in its early stages,
Deloitte Access Economics 11Smash repair industry
which may account for why current patterns of consolidation may appear inconsistent with
expectations, though this should even out in the longer term.
Establishment and employment numbers in the industry have been declining for the past
decade and are expected to continue to do so. While industry value added has increased in
the past 10 years, its contribution to the economy has been on a declining trend.
Despite consolidating forces in the industry, concentration is low. However, as
consolidation progresses, the remaining enterprises are likely to experience an increase in
profitability in line with their increased productivity. The capital/labour ratio is expected to
rise due to an increase in the capital intensity of operations.
2.2 Key drivers
This section summarises the main factors influencing demand for smash repairs and supply
of smash repair services, including automobile technology and safety, regulation, financial
and economic considerations. The key relationships between stakeholders that also shape
the industry are addressed in Chapter 3.
In October 2010, Automotive Business Research (ABR) was commissioned to undertake a
study to explore the strategic issues in the present and future operations of the Australian
smash repair industry. The survey of 36 smash repairers in the Sydney, Brisbane and
Melbourne areas highlighted the relative significance of these key drivers to repairers’
production and range of services. A summary of the findings is shown in Figure 2.6 below.
Figure 2.6: Significance of issues
Production level Skills shortages Insurer issues
Government policies Suppliers enter/exit market
Vehicle manufacturers
Economy Regulation
Industry over/undercapacity Write-offs
Road traffic Accident frequency
Vehicle safety
Age of vehicle fleet
Levels of vehicle Interest rates
ownership Green issues/environment
Fuel prices
Range of services
Source: ABR, 2011
Deloitte Access Economics 12Smash repair industry 2.2.2 Automobile technology and safety The demand for smash repairs is directly related to the number of motor vehicle crashes on roads. The movement towards improving driver safety though more effective policing and education, as well as improving the safety of roads has led to a reduction in such crashes. IBISWorld (2010) estimates industry revenue will decline by 0.2% annually over the five years to 2010-11, to $5.24 billion. This is in line with the declining trend in the number of deaths caused by motor vehicle accidents over this period (which is a proxy for total road traffic accidents as data for non-fatal accidents is difficult to obtain) (ABR, 2011). Since the GFC, consumers have been confident enough to make large purchases, the average age of the Australian car fleet has been falling and the quality of cars has continued to improve. In the last decade there has been significant change in the construction and materials used in cars, which had been relatively unchanged since the 1970s. The major change was to the structure of cars, making use of high-strength steel to improve the safety rating of cars. These cars sacrifice their structure in a collision to save the occupants. Also, technologies such as anti-locking braking systems and electronic stability control have been implemented, as well as the more recent development of collision avoidance technologies which automatically apply the brakes when a potential collision is detected. Combined, these technologies reduce the likelihood and severity of potential collisions, with associated implications for the smash repair industry. Technology has also reduced the likelihood of minor-impact collisions. Parking sensors which warn the driver when the vehicle is approaching an object reduce the occurrence of low-speed collisions which would otherwise have required minor repairs. Further, this technological advancement of newer cars and the cost of these components have led to a trend of more cars being written off following major collisions. Modular construction has also led to some parts being replaced completely rather than requiring repair. These factors have also contributed to the decline in demand for smash repair services. Hybrid and electric cars are unlikely to have a major effect on the smash repair market. Their cost represents a barrier to mass market sales, with lower than expected demand for hybrid family vehicles (personal communication, 7 July 2011). While the technology in an electric car differs from that of fuel vehicles, the battery pack and electric motor are well shielded from collisions and are unlikely to be damaged in low-impact collisions. That is, the electronic components themselves have not contributed to increased cost of repair. The demographic cohort most likely to be involved in car accidents is 18-25 year old drivers, who are generally the least experienced, and often probationary, motorists. Over the past five years there has been an increase in this demographic, which, other things being equal, would increase the likelihood of motoring accidents. 2.2.3 Repair types and techniques The more advanced technology used in cars has contributed to industry consolidation by making the distinction between smash repair services more pronounced. While in past decades a general smash repairer could undertake repairs on most vehicle types and Deloitte Access Economics 13
Smash repair industry
makes, this is becoming increasingly the domain of specialist repairers due to higher capital
and labour requirements.
Minor repairs
Resulting from this, there has been a move towards market segmentation in terms of the
development of factory shop models which conduct a high volume of low value repairs, and
the specialist shops which focus on high value structural or premium marque repairs. As
such, there are pressures on standard repair shops in major population centres to increase
specialisation in the face of competition from the larger factory shop operations.
Most car accidents occur at low speed, as a result of misjudgement. For instance,
approximately 25% of all car accidents occur in car parks. Such non-structural repairs have
low technology requirements in repair and account for over 80% of car accidents (personal
communication, 7 July 2011).
These repairs are suited to small to medium area repair techniques (SMART) facilities which
focus on reducing cycle time and wastage. Such facilities avoid capital and/or labour
intensive repairs, and profit through turning over high volumes of small-margin jobs. They
are generally larger factory-style workshops in metropolitan areas which are able to reap
benefits from economies of scale.
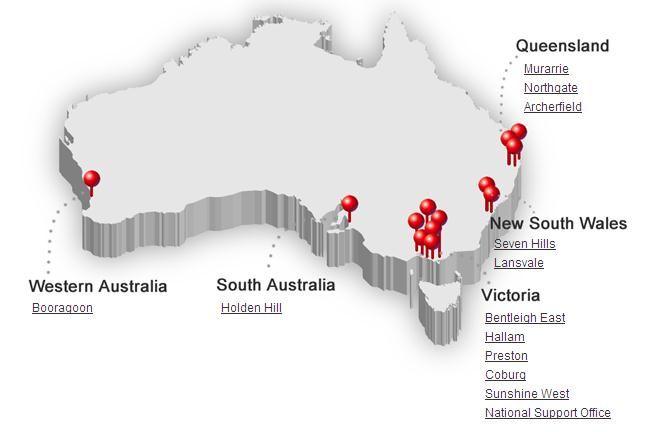
There are currently 12 SMART shops nationally, as shown in Figure 2.7 below. They are
characterised by using market leading technology and innovative techniques to accelerate
the repair process for minor collisions. Entrepreneurs are encouraged to invest in the
equipment required for SMART facilities by the prospect of securing regular, high volumes
of work from insurers. Repair times are half to one third of other business models, with a
standard above the industry average (Capital SMART, 2011).
Figure 2.7: SMART shops
Source: http://www.capitalsmart.com.au/locations
Deloitte Access Economics 14Smash repair industry
Major repairs
On the other hand, up to 15% of accidents involve major structural damage due to high-
speed collisions. Most of these cars are written off due to the high cost of repair, and thus
only 2-5% of insurance claims are for structural repairs, generally for premium vehicles
(personal communication, 7 July 2011). The introduction of high-strength steel has
changed the landscape for structural repairs as capital-intensive equipment is required for
repair as normal welding will weaken the steel and compromise its properties.
These structural changes to the car have led to the development of specialist shops with
the capital and labour requirements to undertake such repairs. Due to the shortage of high
skilled tradesmen in the industry, there is a premium paid for qualified staff. On the other
hand, repair shops which do not conduct structural repair would hire lower skilled
tradesmen who are able to remove and replace parts quickly. The specialisation of the
industry could result in the evolution of the market as shown in Figure 2.8 below.
Figure 2.8: Evolution of the smash repair sector
Present Future
Production level Production level
SMART SMART
shop shop
Flexible repairer
Flexible repairer
Traditional repairer
Traditional
repairer
Range of services Range of services
Source: ABR, 2011
Premium marques
Premium cars are the most likely to be repaired following a major collision as the value of
the repair as a percentage of the cost of the car (write-off value) is lower than for cheaper
cars. Hence, premium car manufacturers or repairers are most likely to face demand in this
space.
The requirements for accreditation by manufacturers, such as specialised equipment and
training and using original parts, will beyond the means of most repair shop operators.
However, they are guaranteed supply by manufacturers’ requirements for honouring
warranties.
Deloitte Access Economics 15Smash repair industry Metro vs. Regional Specialisation is likely to be a stronger force in major population centres. In regional areas, the volume of work – of all types – may only be able to support one smash repair shop catering for minor and major repairs. With a likely skill shortage in regional areas, as well as a higher cost of parts due to their distance from major centres, maintaining smash repair shops in regional areas may become unviable. There is already a trend of transporting vehicles from regional areas to cities to be repaired, then returning the cars to their owners, with total costs lower than if they had been repaired locally. For instance, this is currently occurring between Townsville and Brisbane, reflecting higher repair costs in Townsville with the difference more than compensating for the cost of transporting the vehicle both ways (personal communication, 8 August 2011). 2.2.4 Regulation Regulation impacts on the current and future shape of the industry. In Australia, a voluntary national code was established in 2006 in response to the Productivity Commission’s inquiry in 2005. This code aimed to provide a governance structure to the sector to manage the adversarial relationship between smash repairers and the insurance industry. In particular, it sought to ensure fair trading, transparency and efficiency, though not seeking a national licensing system for repairers. In 2007, a similar mandatory code was implemented in New South Wales. On a Federal level, OHS regulation enforces the need for safe working conditions and equipment to minimise physical strain on workers. As the majority of smash repairers are small establishments, the implementation of such policies can be a substantial cost and impact on other investment or expansion. Consumer protection policies also affect the way that smash repairers and insurance companies operate, in terms of providing a quality service and transparency in operations even where consumers are external to the selection and repair process. Local council regulations include waste disposal policies which can increase costs of smash repairers with significant waste. Town planning regulations, in conjunction with land prices, can also impact on the location of repairers in residential or industrial areas and limit the size of operations, potentially hindering expansion. There are also indirect regulation impacts from drink driving laws and the enforcement of speed limits, which reduce the number of accidents and thus have a flow on effect to the supply of work for smash repairers. Environmental considerations can affect the operation of the industry. Though they may not be strictly regulated, water, air and noise pollution policies can affect the hours of operation and processes used by smash repairers, which can incur additional costs. For instance, the use of water based paints can require a change in infrastructure and application techniques. Deloitte Access Economics 16
Smash repair industry

Requirements for manufacturers to build cars that can largely be recycled are in place in
Europe, but not yet in Australia. If such regulations make cars a more disposable
commodity, this will reduce the volume of repairs.

2.2.5        Financial and economic
The financial viability of smash repairers depends largely on their relationship with insurers.
In some cases, repairers rely on insurers for up to 80% of their work and, hence,
relationships such as preferred smash repairer (PSR) arrangements are important to ensure
a steady volume of work. Additionally, relationships with tow truck companies and car
makers can also be important in sourcing work. This is further explored in Chapter 3.

Economic considerations in establishment and operation of a smash repair establishment
depend on the costs of setting up and remaining competitive. While there do not appear to
be substantial barriers to entry in this industry, there are significant capital costs in terms of
repair equipment as well as investment in training and skills. As the types and construction
of cars are constantly evolving, these are ongoing costs incurred in remaining competitive.

Opposing forces make the outlook for training and skills uncertain. On the one hand, the
greater diversity in car types and improved technology implies a need for a broader range
of skills and a higher degree of technical knowledge. However, with the trend towards
factory repair shop models, workers are more likely to specialise in a small range of skills
rather than requiring the ability to repair the whole car. Also, with parts increasingly
replaced rather than repaired, there may, in fact, be a lower requirement for repair skills.
Competition for skilled labour from other industries, notably mining, is also an issue
affecting the supply of repairers. These factors will have important implications for wages
in the sector.

Other economic factors will impact on the outlook for the industry. A positive economic
environment will lead to greater car ownership, and the number of cars on the road is
positively correlated with the number of accidents. Contrasting this, high petrol prices will
reduce the kilometres driven and the number of leisure drives and, hence, reduce the
likelihood of accidents.

2.2.6        Summary
Technology and safety influence the cost and volume of repair work. Dividing the repair
industry into repair types and techniques and financial and economic factors determine
which repairers are more vulnerable to competitive pressures. The cost of regulation is
likely to be higher for small repairers.

2.3 Comparison with experience elsewhere
2.3.1        Domestic
The consolidation process appears to have been more rapid in Victoria and Western
Australia than in the other states. Part of this can be attributed to the origination of SMART
facilities in Victoria, aiding their uptake and acceptance. Further, there is a mindset of
consolidation and entrepreneurship facilitated by the relationships in the industry.

Deloitte Access Economics                                                                      17
Smash repair industry

Insurance companies have faced pressures to reduce costs of premiums to remain
competitive. The move towards factory shop models provides an alternative repair
pathway with a low cost and turnaround time through benefits derived from economies of
scale.

In Western Australia, there are fewer smash repairers per capita than in any of the other
states. Much of this can be attributed to the mining boom, which has attracted much of
the labour and capital resources through higher wages and capital returns. As such, other
industries, such as the smash repair industry, have found it difficult to recruit and retain
skilled labour.

A UK operation, Gemini, is owner of a number of smash repair shops nationally. As the
Australian market is characterised by most owners only having one shop, there is a
generally low level of consolidation. Gemini operates with a process similar to SMART
facilities and has sought to recruit skilled tradesmen from overseas. The reasons for
seeking skilled repairers overseas are twofold; firstly there are competitive pressures from
the mining industry which offers higher wages, and the shortage of skilled workers in
Australia (personal communication, 8 August 2011).

This reflects a broader trend of skills shortages in the industry. Since 1994, there has been
a steady decline in the number of apprentices in the formal training system, accelerating
post-2000. Since 1994, there has been a 39% fall in apprentices. As a result of the
concurrent skill shortages and decreasing labour availability, there has been an exit to entry
ratio of up to 3:1 in some states, attributable to natural attrition as well as opportunities in
other industries (ABR, 2011).

Contrasting the situation in other states, there is a shortage rather than an excess of
repairers in Western Australia. However, it is unlikely that the number of repairers will
increase to fill the gap as rent, labour and car parts are all more expensive than in the other
states, due to the mining boom as well as the geographical distance from the other state
capitals. These factors contribute to a higher average cost of repair in Perth of $3,500
compared to around $2,300 in other capital cities, though this does not appear sufficient
incentive due to start up shops due to the competitive pressures faced (personal
communication, 8 August 2011).

2.3.2        International
The UK smash repair market was valued at £3.8 billion in 2009, a 16% decline in value in
real terms from 1999 (Trend Tracker, 2010). Demand has slowed due mainly to a decline in
insurance-related work, the rising level of total losses and a higher proportion of repair
costs falling below policy excess figures. Since 2004, the market has experienced a fall in
average repair costs due to a fall in the value of replacement parts, as well as the increasing
use of low-cost SMART facilities (Trend Tracker, 2010).

Changes in the UK smash repair sector have resulted from addressing problems which are
also evident in Australia, namely conflicting relationships between insurers and repairers,
price pressures imposed on repairers from insurers, and inadequate returns. Experience
from the UK includes a consolidated motor insurance industry, where the 5 largest insurers
control over 54% of the market (Auto Body Professionals Club Submission, 2010), similar to
the situation in Australia with four major players in the insurance market. A lack of

Deloitte Access Economics                                                                    18
Smash repair industry

profitability and low consumer loyalty have led to a cycle of price wars which drive the
motor insurance market, with signs of unsustainable pricing.

On the smash repair front, there is evidence in the UK that the small and the very large
smash repairers do the best financially in relation to the industry average, in terms of gross
profits on paint and materials, operating and net profits and sales. The reasons for this
need to be explored in greater depth, to see if this can inform the potential shape of
consolidation in the Australian industry.

Conclusions from the UK and potential implications for Australia, are presented in the
autoPOLIS (2005) presentation. These include, that there is an absence of large branded
smash repair networks in the UK, that repairers have historically played a role in bringing
the sector to a point where it needs to be consolidated and that substantial divergences in
performance of repairers means that consolidation forces will impact businesses
differently.

Implications for Australia include the need for further consolidation, though this should not
be viewed as a silver bullet solution to the industry’s issues, and that more thought is
required around the approach to cost reduction including focusing on productivity and cost
rather than just price. The Australian industry would benefit because of economies of
scale, more efficient administration, and technological improvements that would be
evident in a consolidated industry.

Consolidation has been driven by a reduction in vehicle usage, which reduced the number
of motor vehicle accidents. Further, there was evidence of consumers avoiding or deferring
the repair of minor damage in difficult economic times. This has increased the popularity of
small to medium area repair techniques (SMART) repairers, at the expense of traditional
smash repairers.

The deep recession resulting from the GFC further enforced these trends. Hence, the
consolidation in the UK is ongoing, with a 12% decline in the number of smash repairers
between 2006 and 2009, and anticipated decline of 16% between 2010 and 2015 (Trend
Tracker, 2010). This forecast is mostly attributed to the closure of the small and large body
shops which have been affected by regulatory compliance costs and reduced volumes of
work from insurers respectively.

In comparison, IBISWorld (2010) records a modest 2% reduction in the number of
establishments in Australia between 2006 and 2009. Overseas experience suggests that
Australia is still in the early stages of consolidation, based on the number of repairers per
capita. For example, in 2007 there were 6.6 smash repairers per 100,000 people in the UK
compared to 24.8 repairers in Australia. This indicates that consolidation still has a long
way to run in Australia.

Similarly, vehicle manufacturers are beginning to have an influence on the repair process
through entering the smash repair market with their own repair networks. However, in
Australia 97% of repair businesses remain independent, compared to 80% in the UK (ICDPA,
2008). In Australia, there are few authorised repair networks with manufacturers and
much weaker ties than those in Europe.

Deloitte Access Economics                                                                  19
Smash repair industry
The average cost of repair is in Australia is $2,300, compared to $2,000 in western Europe
(ICDPA, 2008). It is not clear if the differences are due to relative positions on the
consolidation path, or factors such as the Australian exchange rate (affecting cost of
imported parts), increasing insurance costs for repairers and labour costs.
Smash repair chains are relatively common in Europe, suggesting a greater degree of
consolidation than in Australia. They are either franchise chains (which can include
vertically integrated companies) or ones owned by a single operator. In the UK, 16% of
smash repairers belong to such a chain, and up to 53% in France. The economies of scale
and cost advantages of such chains are evidence of an efficient and consolidated industry.
In Australia, there are few examples of such chains, though their development is likely in
coming years.
ICDPA (2008) highlights the key changes that have occurred in the UK that could also occur
in Australia:
development of specialised smash repair chains;
increasing size of smash repairers (> 20,000 square metres) to achieve economies of
scale (currently the average size of shops is 1000 square metres – personal
communication, 1 April 2011);
further concentration, with up to 80% of the market controlled by 20% of enterprises;
and
more freedom of choice and competition for consumers regarding access to car parts.
An unanticipated development from consolidation in the UK may also be pertinent to
Australia. The reduction in the number of smash repairers in the UK has created a near
monopoly situation for some repairers, with the balance of power shifting away from
insurers, and leading to upward pressure on repair prices. This potential implication could
have an effect on rural and regional Australian markets and should be studied closely.
There are also specific regulations in Europe which apply to the smash repair sector. The
Block Exemption Regulation allows for exclusive networks for retail distribution of vehicles
and parts sourcing outside the official vehicle manufacturer system. Euro-design and
intellectual property rights regulation protects the design of visible body parts of vehicles.
In some parts of the EU, right to repair provisions enable repairers to use non-original body
parts to promote competition.
Compared to the UK, Australia is still at a relatively early stage of consolidation of the
smash repair sector. The UK market faced strong consolidating forces, with regulation and
cost pressures leading to owners purchasing several shops to benefit from economies of
scale to remain competitive.
Australia faces similar forces, though with less regulatory pressure. Further, the Motor
Trades Associations wield greater power in Australia and, hence, repairers are less likely to
be subject to the pressures imposed by insurers on their margins. For the same reason, the
premium car market is less likely to gain significant market share.
Another factor affecting the rate of consolidation is the relative prices of vehicles in
Australia and the UK. For instance, BMWs are considered premium cars in the Australian
market and mid-range in the UK market. To illustrate the comparison, a BMW 320i sedan
Deloitte Access Economics 20Smash repair industry
costs $62,500 in Australia and £28,530 in the UK (equivalent to $44,500). Hence, in
Australia, they are more likely to be repaired than written off. Anecdotally, the total loss
percentage is 30% of a 35 million UK car fleet, compared to 10% of the 11 million Australian
car fleet (personal communication, 8 August 2011) 1.
This would imply that consolidation in Australia would be slower than in the UK. However,
with the benefit of the UK experience, entrepreneurial repairers and insurers have
identified that consolidation is beneficial for their business model. With meaningful long
term supply agreements, they could better align the industry on the path to sustainability.
This could potentially increase the rate of consolidation above that of the UK, despite the
fewer pressures faced in the Australian market.
The rate of consolidation, therefore, is likely to be influenced by whether the insurers or
the repairers wield greater power in the market.
In the United States, factory repair models similar to the SMART shops in Australia are
driven by profit due to the low supply of tradespeople. This has led to market consolidation
through the ability to hire people with lower skills and promoting fast turnover.
Similarly in Japan, there is a clearly fragmented market where car dealers specialise in
electronic repairs while smash repair shops maintain the equipment required for panel
repairs. In Germany there is a strong focus on after-sales service provided to car owners
and hence repairs are more commonly taken to dealer-preferred repairers than general
smash repairers, making the former less vulnerable to consolidation forces in their smash
repair market.
1
Deloitte Access Economics has not yet been able to independently verify these figures.
Deloitte Access Economics 21Smash repair industry 3 Relationships This section summarises the nature of relationships – between repairers and insurers, repairers and car makers, and repairers and other stakeholders – and whether they help or hinder consolidation. The major industry models for insurance are: choice of repairer (NRMA Insurance); no choice of repairer (AAMI); vehicle manufacturers; and no insurance. The ‘NRMA Insurance model’, allowing for consumer choice, supports diversity in the market and allows consumers to select their own repairer. On the other end of the spectrum, the ‘AAMI model’ effectively has the insurer acting as a middleman between consumers and smash repairers. As AAMI is ultimately making the choice of repairer, they can support a smaller number of repairers who can offer their desired qualities, for instance fast turnarounds at low cost. This is evidenced by their use of factory shop models of repair. This boosts the drive for consolidation and specialisation in the industry while the NRMA Insurance model supports diversity in the market through a broader network of repairers offering different benefits to consumers. Vehicle manufacturers are increasingly influencing the repair space, with ‘authorised repairer’ arrangements with particular smash repairers. This effectively narrows the range of choice available to consumers if they wish to retain their car warranty or other guarantees. Where ‘authorised repairers’ are not part of an insurer’s PSR network, conflicts over insurance and repair could result. This situation is not beneficial to insurers or consumers, and is commonly related to premium car marques. Smash repairers also have mutually beneficial relationships with car retailers and parts suppliers and tow truck operators. The interdependencies within the market are shown in Figure 3.1 below. Deloitte Access Economics 22
You can also read